Abstract
Inner race fault in bearing suspension is relatively the common fault in induction motors coupled with a gearbox, their detection is feasible by vibration monitoring of characteristic bearing frequencies. However, vibration signals have numerous drawbacks like signal background noise due to external excitation motion, sensitivity due to the installation position and their invasive measurement nature. For this reason, it is necessary to apply an extremely efficient method known as stator current signal analysis which offers significant savings and implementation advantages over traditional vibration monitoring. This paper represents a mathematical model for electromechanical systems and for rolling-element bearing faults to study the influence of mechanical defects on electrical variables (stator current). The novelty in this work involves three contributions: modelling of rolling bearing faults by external forces applied on the electromechanical system; Physical representation of rolling bearing fault allowing the modeling of the studied system functionality and, the influence of mechanical fault (inner race) in the electrical variables (stator current). Simulation results at the end of this paper demonstrate the effectiveness of the proposed mathematical model to detect gearbox’ bearing fault based on the electrical stator current signal with high sensitivity using fast Kurtogram approach.
Highlights
- In order to better identify the complex running conditions of induction motors coupled with a gearbox main bearings, we proposed a bearing fault mathematical model.
- Mechanical failures (inner race bearing defect in the gearbox) effects on the characteristics of the electrical quantities (stator current).
- Fourier spectrum of the induction stator current did not give any useful information about the presence of abnormality in the system.
- The kurtogram is a fourth-order spectral analysis, it is a fast and effective method to detect the inner race fault with efficiency.
1. Introduction
Gearboxes based on induction motors are one of the most popular mechanisms in industrial machinery. Their safety, reliability, efficiency and performance are highly considered by researchers and engineers. Although induction motors and their transmission mechanisms are reliable, however they are subjected to failures. Recent studies show that an important percentage of gearbox-induction machine failures are related to bearings [1]. This type of fault must be detected as soon as possible to avoid fatal machine breakdowns which may increase maintenance costs and leads to production losses.
Over the last two decades, Motor Current Signal Analysis (MCSA) method has been widely used for electrical and mechanical systems condition monitoring [2-8] and unquestionably contains a lot of information. Signal processing method for healthy gearbox monitoring can be classified into time, frequency and time-frequency domains analysis. These works confined us to use conventional method such as frequency domain technique analysis and signal demodulation technique [4], and signal demodulation technique [4, 5], which may detect abnormality in the system and faults' presence and do not provide enough information such as: the defect’s severity. Nevertheless, the combined time-frequency representation provides energy signal as function of time and frequency and can be performed with constant or varying time frequency resolution. Many time frequency approaches like: Multi resolution Fourier Transform [6]; Wavelet Packet Transform (WPT) [7, 8], have been exploited to analyze current signal and extract important information when diagnosing the induction motor.
Multi-resolution analysis method using wavelet transform have gained a lot in effective signal processing tool. Generally, the WPT needs comparison of Time-Frequency (TF) maps representing the normal or abnormal functioning, this is a very tedious work because of the increased dimensionality. Moreover, revelations of fault symptoms depend on the damage severity and this comparison may not be discernable at the first stages of fault evolution.
However, the recent proposed signal processing method, named the Fast-Kurtogram tool which has been developed by Antoni and Randall [9], who demonstrated the superiority of wavelet analysis in many applications [10]. The spectral kurtosis is a frequency indicator used to calculate the kurtosis of the analyzed signal. The objective is to detect the transient components in the signal and indicate the frequency band in which these will occur, the paradigm relies on the assertion that all types of transient are associated with the center frequency/bandwidth (/) which augments the kurtosis hence, its detection.
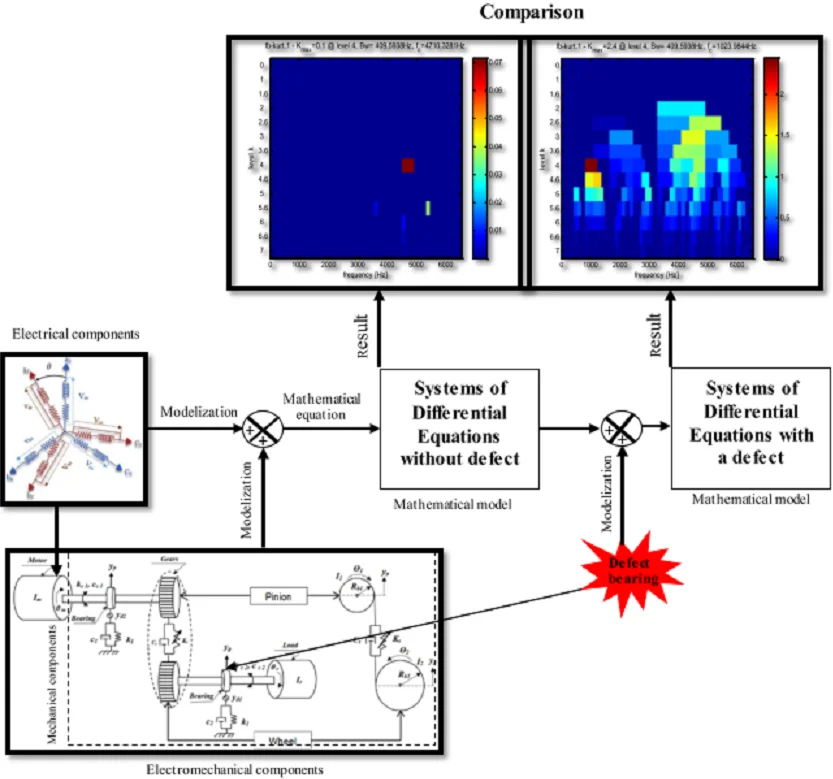
This paper represents the use of Fast Kurtogram to validate the mathematical model of the proposed rolling bearing in defect functioning mode in early detection and advancement monitoring of the receiver side’s bearing fault, particularly the inner race fault. Most of authors focus their research work on the motor alone, but in our study we consider the electromechanical system (both motor and gearbox reducer) as shown in Fig. 2. A new dynamic model of an electromechanical system is proposed. It consists of gearbox with and without defect driven rolling bearing.
The fast kurtogram approach is used for signature characterization of the inner race fault of the motor stator current. This approach is very suitable for such diagnosis and provides a better detection of the bearing fault in order to validate the proposed mathematical model.
The organization of this paper is as follows: The first section describes the Spectral Kurtosis and Kurtogram. Section 2 represents the electromechanical model. Section 3 represents the bearing mathematical model with a defect on the inner race. Finally, section 4 represents the simulation results and comments of the bearing fault in gearbox-induction machine.
2. Modeling of the electromechanical system
2.1. Modeling of the electrical part (asynchronous cage motor)
To model the asynchronous cage motor some hypotheses are considered which are:
– Perfect symmetry.
– Assimilation of the cage to a short-circuit winding of the same number of phases as the stator winding.
– The electromotive force has a sinusoidal distribution in the air gap of the machine.
– Notches are supposed to be non-existent.
– Saturation is neglected, it follows that the own and mutual inductances are independent of the currents flowing in the different windings.
– Hysteresis and eddy currents are not considered.
2.1.1. Three – phase model of the asynchronous machine
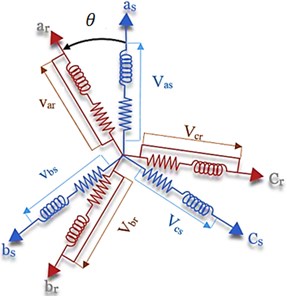
Either a three-phase asynchronous machine for stator or rotor is shown schematically in Fig. 1 where the phases are respectively marked , , and , , . The electrical variable angle as a function of time defines the instantaneous relative position between the magnetic axes of the and phases chosen as reference axes.
The six windings , , and , , (Fig. 1) obey the following electrical equations:
– For the stator:
– For the rotor:
where and designate the resistors per phase of the stator and the rotor respectively.
Fig. 1Asynchronous machine model (three-phase case), where: as, bs, cs: correspond to the three phases of the stator, ar, br, cr: correspond to the three phases of the rotor
The totalized flux coupled with the stator and rotor phases are expressed in the following form:
where , is the stator and rotor fluxes respectively; , represent the matrices of stator and rotor inductors respectively; corresponds to the matrix of stator rotor mutual inductances:
By introducing Eq. (3) in Eq. (1) and Eq. (4) in Eq. (2), we finally obtain:
Knowing that the matrix of mutual inductances contains trigonometric terms, which makes the analytical resolution of the system very difficult or practically impossible. This leads us to use the park transformation which will make these parameters independent of the position .
2.1.2. Model of the three phase asynchronous machine in the park reference
The park transformation often called two-axis transformation, makes the real variables correspond to their components:
– Homopolar (index 0).
– Direct axis (index ).
– Axis in quadrature (index ).
The relationships between three-phase and two-phase quantities are written as follows:
With , Park transformation matrix given by:
The three-phase- to two-phase transformation is done by:
The transformation 2 to 3 is done by:
where is the angle of the - mark.
We have three possible orientations of the - mark:
1) - mark linked to the stator 0 and .
2) - mark linked to the rotor and 0.
3) Landmark - linked to the rotating field :
A final important point of asynchronous machine modelling is the mechanical equation of the machine. This equation is written as:
with: : Total inertia of moving parts; : Mechanical speed of rotation, : electromagnetic torque of the machine, : friction resistant torque, : load torque, : number of pairs of electrical poles of the motor, : friction coefficient.
The electromagnetic torque of the machine is given by the following expression:
The equations of the system can be rewritten in matrix form as follows:
where:
where the state vector is given by as: and .
The mechanical equation is given by:
In addition, the equation of the electromagnetic torque can be expressed as a function of the stator currents and the rotor. This is given by Eq. (16):
2.2. Mechanical part model (one stage spur gear transmission)
A dynamic model is developed to study the bearing defect which influences on the dynamic behavior of the system. In this purpose, we propose a novel approach to model the dynamical behavior of bearing defect. The electromechanical model is shown in Fig. 2.
This is a model of two parameters, involving damping and stiffness, with lateral and transitional oscillations, and it has six freedom degrees. is the rotational angle of the motor, and are the pinion and the wheel rotational angles respectively, is the load rotational angle, and are the radial displacement of the flexible shafts. It was modeled as a pair of solid disks, related by a set spring damper along the contact line (inter-outer friction is ignored for simplification and placed on flexible shafts which are supported by rolling element bearing. Since inner race friction is canceled, the oscillation in the direction of is a free response and will vanish due to inherent damping. A set of differential equations can be obtained based on Fig. 2.
Fig. 26 degree -of-freedom gear dynamic model (Note that the vertical direction is aligned with the pressure line of the gear mesh) [11]
![6 degree -of-freedom gear dynamic model (Note that the vertical direction is aligned with the pressure line of the gear mesh) [11]](https://static-01.extrica.com/articles/21206/21206-img2.jpg)
Applying the fundamental principle of Newton’s dynamics, the dynamic behaviour of the electromechanical model can be represented by the system of differential equations as follows:
3. Bearing faults and vibration modeling
3.1. Mathematical description of rolling element bearings fault
Oscillation is the response of a mechanical system to the forces occurred by defects. An ideal gearbox or a bearing would generate minimal oscillation during its normal operation. Forces that generate vibration can be obtained from different sources. Most common sources are the unbalanced mass, faults or defects in the bearing and misalignment. Mass unbalance is caused by the non-uniform distribution of mass about the centre of rotation and generates a sinusoidal force expressed by Eq. (23):
When the shafts of the driver and the driven machines do not align properly: misalignment occurs, and generates a periodic impulsive force expressed as:
A bearing defect also generates an impulsive force given by Eq. (25):
To take into account rolling elements slip, a random uncertainty is added to the occurrence time for each impulse such that:
Assuming a fixed position of the sensor oscillation, Eq. (26) needs to be modified to take into account the transmission path variations of the rotating defects (ball and IR defects). As the defect rotates, the distance of the defect to the fixed sensor will change periodically. In addition, in case of non-uniform load distribution, when a rotating fault strikes the raceways, it will be felt differently in different load zones of the bearing. These can be translated to the input force by modulating with the appropriate cosine pulse series given by Eq. (27):
Based on the previous fault functions, we can deduce that the global fault function is as follows:
The parameters of the fault functions and the values for the frequency of the impulse train, for different types of faults are given in Table 1 and Table 2 respectively.
3.2. Bearing defect or characteristic frequencies
The characteristic vibration frequencies due to bearing defects can be calculated from the rotor speed and the bearing geometry. The typical rolling element bearing geometry is depicted in Fig. 3. The characteristic vibration frequencies can be calculated using equations given in Table 2. In the following equations, is the contact angle, between the races and the balls, in radians and , is the rotor speed (in Hz).
Table 1Fault functions parameters
Symbol | Description |
Appropriate amplitude found by the unbalance size | |
Appropriate amplitude of the th harmonic | |
Initial magnitude of the th harmonic | |
Running speed | |
Characteristic frequency of the defective bearing element | |
Appropriate phase angle | |
Initial phase of the th harmonic | |
Number of harmonics in the impulse train. |
Fig. 3Rolling element bearing geometry
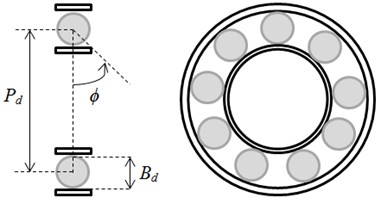
Table 2Bearing characteristic frequencies
Fault location | Failure frequency |
Defect on inner race (BPI) | |
Defect on outer race (BPO) | |
Defect on cage (FT) | |
Defect on ball (BS) | |
is the rotation frequency of the rolling bearing | |
4. Numerical simulations and results (detection of the inner race fault)
The following results have been obtained from the electromechanical system comprising the three-phase asynchronous motor and the single stage spur gear.
First, we consider the healthy mode functioning system, after that, the inner race bearing defect is modeled by considering Eq. (25) where 85.84 Hz.
Fig. 4Simulated stator current: a) healthy mode, b) in presence of the inner race defect (amplitude increase operated in ydt)
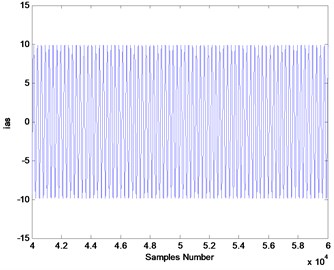
a)
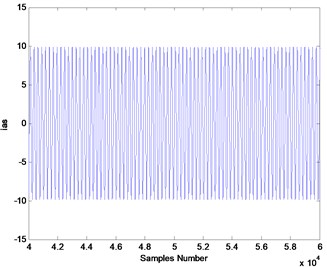
b)
The obtained signals of the induction stator current in healthy mode and in defect mode are shown in Fig. 4 and their spectrum signals are given in Fig. 4. It appears that it is not possible to detect the inner race defect directly from the analyses of the waveform of the stator motor current.
In Fig. 5, 50 Hz, denotes the stator current frequency. A comparison between the stator current spectrums obtained from healthy mode of the gearbox and the gearbox in defect mode on its bearing at the receiver side of the inner race. failed to detect the presence of abnormality in the system. Based on these results, we can say that the obtained waveforms using Fast Fourier Transform (FFT) analysis of the stator current does not detect the fault related to the inner race defect.
Fig. 5Stator current spectrum: a) healthy mode, b) in presence of the inner race defect
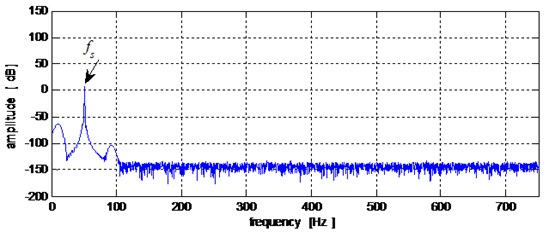
a)
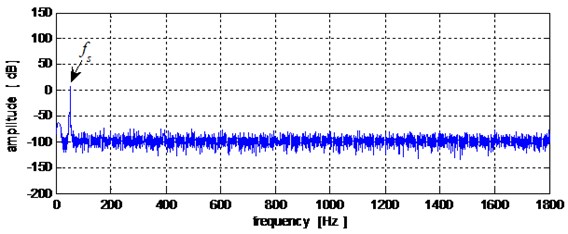
b)
Fig. 6a) Fast kurtogram of the signal of Fig. 4(a), b) squared envelope spectrum of stator current from gearbox with healthy bearing (Bw= 409.5938 Hz, fc= 4710.3181 Hz)
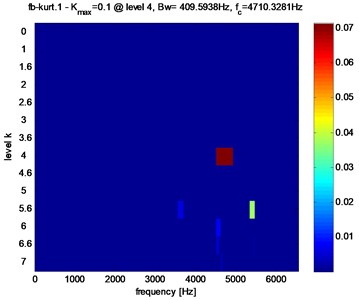
a)
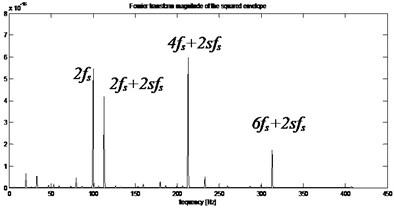
b)
In fact, the presence of inner race defect causes repetitive transient in the stator current whenever the rolling element passes through the damaged area. These transients present a small energy. So, it is not easy to detect the faults from simple conventional approaches. To solve this problem, we suggest to use the Fast kurtogram which is sensible in detecting any change in transient signal. To do so, the proposed approach is based on two steps:
Step 1: Obtain the Fast Kurtogram of signal given in Fig. 6(a) by using the Spectral Kurtosis algorithm. The obtained result indicated in color map is given in Fig. 6(a). We calculate the Kurtosis values for several combinations of center frequency () and bandwidth () in a predetermined way. Then calculate the optimum filter, defined by and . The highest Kurtosis of the optimum filter is selected to be used in the envelope computation.
Step 2: Squared envelope spectrum is performed. Its characteristic frequencies can be identified by the peak search around predicted values.
Fig. 7Fast kurtogram of the signal of Fig. 4(b), the maximum is reached at dyad (Bw= 409.5938 Hz, fc= 1023.9844 Hz)
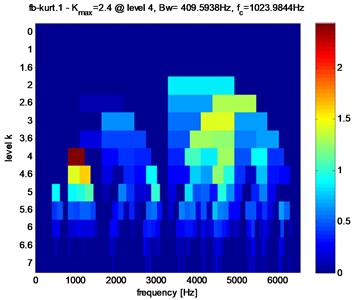
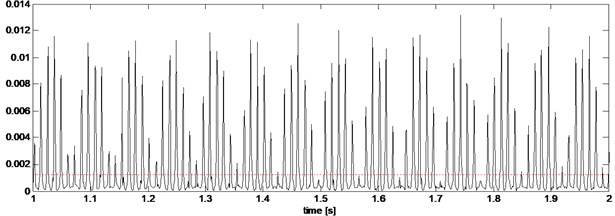
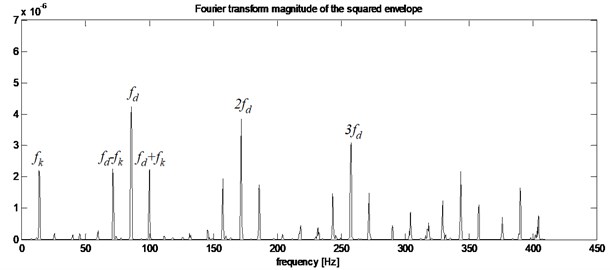
Fig. 8a) Squared envelope signal, b) squared envelope spectrum of stator current from gearbox with inner race defect (Bw= 409.5938 Hz, fc= 1023.9844 Hz)
The healthy gear is modeled to be geometrically perfect (0, i.e. 0 % amplitude increase), Fig. 7 shows the Kurtogram of stator current for a healthy bearing. Fig. 7(a) Shows the maximum spectral kurtosis value (0.1) at dyad ( 409.5938 Hz, 4710.3281 Hz) and the corresponding squared envelope spectrum. Fig. 6(b) indicates the current frequency components which corresponds to 2(50 Hz) and 2(12.9 Hz) where “” is the motor slip.
In the presence of the inner race defect, (amplitude increase operated in ), the Kurtogram has the maximum value of the spectral kurtosis ( 2.4) at dyad (409.5938 Hz, 1023.9844 Hz) as obtained in Fig. 7.
In the analysis of the squared envelope spectrum given in Fig. 7(b), the main feature observed is: the frequencies amplitudes of interest (85.84 Hz) and its harmonics with typical frequency modulation at , where .
We can conclude that the existence of bearing fault results in the maximum value of the spectral kurtosis () at dyad ( 409.5938 Hz, 1023.9844 Hz) in the Kurtogram.
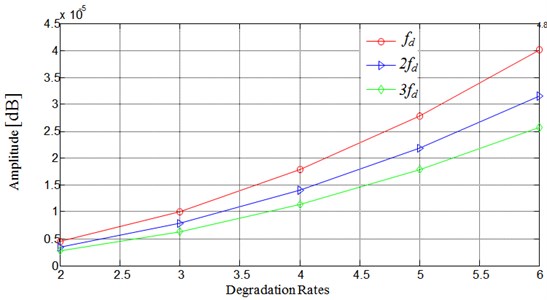
Fig. 9Amplitude variation of the frequency characteristic component based on the defect’s evolution
5. Conclusions
In this paper, a new mathematical modelling of rolling element bearings fault of induction motor coupled with a mechanical meshing transmission has been developed. This will allow us to simulate the dynamic interactions between the mechanical vibrations generated by gears-box in a healthy mode and with presence of bearing damage of the driving machines. Based on the simulation results, it has been shown that detecting the characteristic frequencies of a bearing fault in the current motor is difficult even when the corresponding fault frequencies are prominent in the gearbox vibration, and it is especially difficult for the inner race faults. Moreover, we have modeled the bearing defect in the receiver side, which make the detection of the damage through the stator current more difficult. Comparative studies between healthy and defect bearing using a direct analysis of waveform or Fourier spectrum of the induction stator current did not give any useful information about the presence of abnormality in the system. However, it has been shown that the use of Fast kurtogram is an effective tool to detect the inner race fault with efficiency. In reality, the fast kurtogram approach determines the dyad that causes spectral kurtosis maximization, the corresponding band pass filter is identified and used to determine the envelope obtaining. The obtained envelop spectrum in healthy bearing and faulty are compared to each other to provide the key information of the inner race bearing defect. The related frequency modulation of the inner race bearing fault is given by the characteristic frequency (frequency defect: ).
Through the obtained graphs, we can estimate the degradation rates of the inner race bearing through the increase of harmonic amplitude. These observations can be used to fix the threshold that helps us to decide when to stop the production line before any serious or drastic problems. As illustrated in (Fig. 9), the amplitude evolution of the characteristic frequency components is given as a function of the defect evolution. Notice the nonlinear progression between the amplitude of the characteristic frequency and the defect rate. By observing the frequency amplitude of bearing defect we can know the degradation rates of the component given in (Fig. 9).
References
-
Azeddine R., Chemseddine R., Djamel B. A new method to enhance of fault detection and diagnosis in gearbox systems. Journal of Vibroengineering, Vol. 19, Issues 1-2017, 2017, p. 176-188.
-
Metatla A., Benzahioul S., Bahi T., Lefebvre D. Eccentricity fault monitoring by analysis stator phase currents. International Review of Electrical Engineering, Vol. 3, Issue 4, 2010, p. 533-537.
-
Oscar Duque-Perez, Daniel Morinigo Sotelo, Marcelo Perez-Alonso Detection of broken bars in railway induction motors fed by frequency converter using spectral analysis of line current. International Review of Electrical Engineering, Vol. 5, Issue 2, 2012, p. 959-966.
-
Pillay P., Xu Z. Motor current signature analysis. Conference Record of the Industry Applications Conference, Vol. 1, 1996, p. 587-594.
-
Mohanty A. R., Kar C. Fault detection in a multistage gearbox by demodulation of motor current waveform. IEEE Transactions on Industrial Electronics, Vol. 53, Issue 4, 2006, p. 1285-1297.
-
Chinmaya Kar, Mohanty A. R. Vibration and current transient monitoring for gearbox fault detection using multi resolution Fourier transform. Journal of Sound and Vibration, Vol. 311, 2008, p. 109-132.
-
Levent Eren, Michael Devaney J. Bearing damage detection via wavelet packet decomposition of the stator current. IEEE Transactions on Instrumentation and Measurement, Vol. 53, Issue 2, 2004, p. 431-436.
-
Levent Eren, Michael Devaney J. Bearing damage detection via wavelet packet decomposition of the stator current. IEEE Instrumentation and Measurement Technology Conference Anchorage, 2002.
-
Antoni J., Randall R. B. The spectral kurtosis: application to the vibratory surveillance and diagnostics of rotating machines. Mechanical Systems and Signal Processing, Vol. 20, Issue 2, 2006, p. 308-331.
-
Bessous et al. N. Diagnosis of bearing defects in induction motors using discrete wavelet transform. International Journal of System Assurance Engineering and Management, Vol. 9, 2018, p. 335-343.
-
Azeddine Merainani R. B., Benazzouz D. Detection of shaft crack fault in gearbox using Hilbert transforms. 6th International Conference on Systems and Control (ICSC), Batna, 2017, p. 422-425.
Cited by
About this article

