Abstract
During the aircraft’s maintenance, it is essential that its structural inspection as well as potential found damages to be assessed in an effective manner within a limited time frame. To reduce the required time, for the aforementioned procedure, an innovative tool is developed. For the first time, a structural integrity assessment tool integrates image processing algorithms and FE models. The tool processes data from Non Destructive Testing (NDT), via image processing algorithms, and then provide pieces of information regarding the residual strength of the examined component in an automated way. The data acquired, from the NDT, are interpreted using the threshold method, in order to generate an accurate map of the component with its damages (size and location). This information automatically feeds a parametric Finite Element (FE) model, which forms an FE model of the damaged component ready for analysis. The parametric FE model can construct models for isotropic and laminated monolithic components using the XFEM method and the Cohesive Zone Modelling (CZM) technique respectively. For the case of laminated components, Progressive Damage Modelling (PDM) is also considered. In this study, simple geometries as the upper and lower wing skin, are analysed under static tension or compression. Aim is to examine the effectiveness and feasibility of the developed tool. The main benefits obtained from the application of the tool is that the image processing data are manipulated automatically and fast providing all the information regarding the location and size of damage in the examined component. Moreover, from the obtained numerical results the strength reduction of the component can be predicted well, by just comparing them with the respective numerical results of the reference undamaged component. Overall, the developed tool is very promising, since time saving can be gained.
1. Introduction
Aerospace industries are obliged, from European Aviation Safety Agency (EASA) and Federal Administration Aviation (FAA)), [1], to inspect all aircraft components for possible defects/flaws, before they are assembled into the aircraft and then they are periodically inspected throughout their useful life, using reliable and efficient NDT techniques. The result of an undetected flaw due to inefficient inspection or improper repair may lead to its catastrophic failure and eventually and aircraft loss, such as the incidence of the Adam Air Flight 172, [2]. Therefore, there are several NDT techniques, with their own set of advantages and disadvantages, so on every aerospace component the most suitable technique can be applied for its inspection [3, 4].
For damage tolerant design, as used in aviation, NDT is a prerequisite due to the fact that engineers design aircrafts to withstand a certain amount of damage with no risk of catastrophic failure. This is the concept of Damage Tolerance (DT), which is officially introduced mainly to aircraft design within the framework of the aeronautical regulations. However, during maintenance procedures, components are not usually assessed under DT rules. It is though essential, such an assessment to be performed since the DT addresses two essential points, concerning a damaged structure, (i) it determines fracture load for a specified defect size, and (ii) it predicts the required length of time for a sub-critical defect to grow to the size that causes fracture at a given load. To this contribution, FE method has been employed for the solution of DT problems, since it provides high level of physics and suitable defect front representation for metallic and composite materials.
The innovation of the developed tool is that combines, in a single module, image processing algorithms and FE analyses. Additionally, it manipulates and exchanges the data between image processing algorithms and FE analyses in an automated manner. The output of this tool are information that refer to the structural integrity (e.g. residual strength) of the examined aerospace component in a fast and efficient way. The current work is an extension of the work done by the authors in [5]. The paper focuses on presenting more advanced numerical analyses of damaged components, relative to their previous work. The current work includes the analysis of damaged metallic structures, while only composite materials were analysed in the previous work. Additionally, the analysis of the damaged composite plate has been upgraded with CZM with contact elements and PDM, for accurately predicting the onset and propagation of damage.
2. Image processing algorithm
The processing of a large number of NDT images and features of these, not only increases the computational complexity but often increases enormously the required size of the data, thereby degrading the algorithm’s performance. Among the most challenging problems in the design of any machine-based classification system, in terms of recognition accuracy, computational complexity and memory requirements is the definition of “the best” NDT data [6, 7] and the most robust set of their features. Therefore, the “right” but minimum amount of both NDT images and extracted data from these images should be correctly defined in order to form an input file for developing a representative FE model. The “right” characteristics that must be extracted from the NDT images, in order to generate an FE model of the investigated component could be the number of defects, the area/direction and centroid of each defect, and the geometry of the entire component. The architecture of the image processing algorithm is comprised by mainly seven different steps. Each step is necessary for the correct execution of the algorithm and it is compiled to serve a specific role. The algorithm’s sections, accompanied with the processed images of a damaged component, are presented in detail in [5], however a brief description of it, is mentioned hereafter:
(i) NDT image is inserted to MATLAB software [8] and the actual dimensions of the examined sample/component are declared;
(ii) image segmentation, simplified and changed the representation of the NDT images into something that is more meaningful and easier to analyse, [9, 10];
(iii) RGB image is converted to a grayscale image (8-bit image) (prepare the image for the later stages);
(iv) filtering process in adopted to perform a two-dimensional adaptive noise-removal. As a result, the “wiener2” command is employed for this purpose. The “wiener2” low-pass-filters an intensity image that has been degraded by constant power additive noise. “wiener2” uses a pixelwise adaptive Wiener method, [11], based on statistics estimated from a local neighbourhood of each pixel;
(v) maximum entropy threshold theorem is applied to the filtered image;
(vi) geometric characteristics are defined and calculated from the processed NDT image; number of defects, their centroid, their direction (crack) or area (delamination) and coordinates with respect to the predefined coordinate system are calculated automatically;
(vii) geometric characteristics of the damaged component are exported from the image processing algorithm to a text file, which can be used as an input file to ANSYS [12], where the numerical model is built.
3. Damage tolerance analysis
To specify the criteria of the DT analysis of the aerospace components, the civil aviation regulations of large aircrafts powered by turbine engines [13] have been considered. The CS-25 book specifies among others that the strength must not be reduced below the Ultimate Load (UL) capability. Therefore, in the current work, the stress levels are calculated when the UL is applied and stress criteria are hence applied. A flow chart, Fig. 1, presents the way the DT analysis is accomplished.
Fig. 1DT analysis procedure for static loading
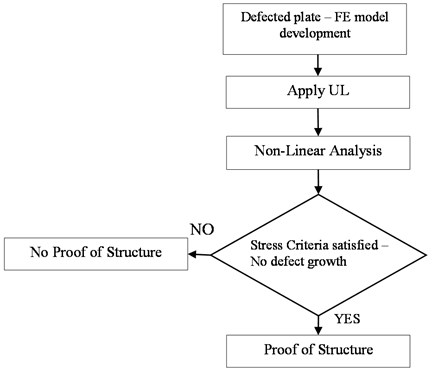
The way for verifying whether the component can operate with defect is by applying the UL and executing a non-linear FE analysis, where large deformations are considered. Using stress criteria with the strength values of the material, the onset of the material failure can be determined. Knowing that failure leads to structural strength reduction, the load where extensive failure occurs must not be experienced. Therefore, by satisfying the stress criteria using UL; proof of structure can be obtained, otherwise not. A no defect growth has been investigated, as an additional check, for proofing the structure via the respective contour plot.
4. Modelling techniques for simulating failure growth
In the following paragraphs, the required features of the defect modelling technique are presented based on the nature of the developed application. The application should be as automated as possible; therefore, the procedure of modelling the defect should be an easy and reliable process that will be able to be executed automatically by a routine having only as input the data from the image processing algorithm. Consequently, detailed defect modelling techniques that are case sensitive are not suitable for the current application. Depending on the material (metallic or monolithic composite) and the type of defect (crack or delamination), two different defect modelling techniques are employed that satisfy the aforementioned requirements.
Regarding the metallic structures, where arbitrary crack(s) may occur, the XFEM, introduced in [14], has been adopted because it overcomes the requirements of remeshing the crack tip as the crack grows. The XFEM approach is usually used to model cracks and other discontinuities by enriching the degrees of freedom in the model with additional displacement functions that account for the jump in displacements across the discontinuity. Moreover, in XFEM it is assumed that the newly introduced crack segments are automatically have cohesive zone behaviour, which is a desired feature for the DT analysis of the developed application. The XFEM crack-growth simulation is a convenient technique but applies only to isotropic materials; therefore it cannot be employed to composites as well.
Composite materials mostly experience the interface of the delamination damages, hence this type of failure is currently presented. Interface delamination is traditionally simulated using fracture mechanics methods, such as nodal release technique. Two distinctive modelling techniques exist for simulating delamination growth along a predefined interface and they both use special elements (interface or contact). The first technique is the Virtual Crack Closure Technique (VCCT), which computes energy release rates in the delamination interface. The second approach is based on the CZM that simulates interface delamination and other fracture phenomena. This approach introduces failure mechanisms by using the hardening-softening relationships between the separations and incorporating the corresponding tractions across the interface. Considering the fact that CZM technique can be easily applied to complex structure and loading cases, as well as the fact that the VCCT technique overestimate the delamination growth phenomena [15]; it can be concluded that the CZM modelling technique is more preferable to be employed for modelling the interface elements for the fracture problems of the developed application. Two additional features are also selected to be incorporated to the analysis. First, identification of the first ply failure using preset failure criteria, in order to better understand the onset of damage and second, PDM for capturing the residual strength of the structure under static load.
4.1. Numerical simulation and FE model description
A parametric FE model of the damaged component is developed within ANSYS software based on the output data of the image processing algorithm. The ANSYS scripting language is utilised to declare the geometric characteristics or import a geometry from a computer aided design (CAD) software, the material properties and boundary conditions of the damaged component. The respective loading conditions (UL) are then applied to the FE model and a non-linear stress-strain analysis is carried out. The plates considered are assumed to be a small portion of an aircraft’s skin structure, therefore flat and curved plates are considered. The metallic plates are analysed under tension and the composite plate under compression. The cases where compression is applied a buckling analysis has been considered to determine the critical buckling load reduction of the damaged component. In Table 1, the plates’ characteristics and the desired residual strength values for calculation are depicted.
Table 1Plates’ characteristics and loading conditions
Generic Samples | Proposed Dimensions (mm) | Material | Type of Defect | Loading | Targeted Value via modelling |
Flat plate | 150×100×1.6 | Metallic (Aluminum) | Middle Edge Crack (1 mm) | Tension | Residual Tensile Strength |
Flat plate | 500×50×11.3 | Monolithic Composite | Midplane through Delamination (length 100 mm) | Compression | Residual Compression Strength |
Curved plate | 150×100×1.6 | Metallic (Aluminum) | Middle Edge Crack (2 mm) | Tension | Residual Tensile Strength |
4.2. Metallic plates
Regarding the metallic plates two parametric FE models have been developed. The first model concerns flat plates and the second curved. From those two generic models a wide range of plates with arbitrary cracks can be built and analysed. The crack(s) of the plate is/are declared by parameters, which have been acquired from the image processing algorithm. To demonstrate the respective numerical models, the geometric characteristics of the metallic plates of Table 1 are utilised. The flat and the curved plates are assumed to have the following material properties; = 72 GPa and Poisson ratio of = 0.33. Furthermore, material nonlinearity is also considered to the numerical analysis by inserting a bilinear representation of the stress-strain curve. Finally, for each plate, a reference model referred hereafter as “Reference Plate”, with no cracks, is analysed for comparison purposes.
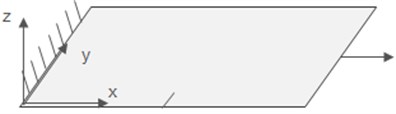
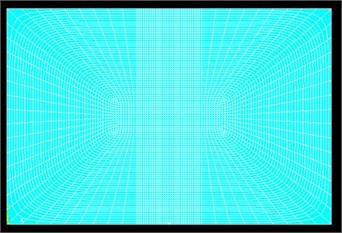
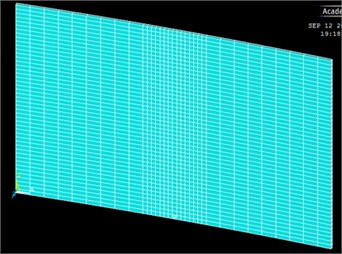
The mesh for both metallic plates has been carefully selected based on a convergence study. For the boundary conditions, the nodes of one end of the plate are fully constrained creating a fixed support, while the opposite end only and -direction is constraint (). An incremental forced displacement, in the -direction (), is applied to the latest edge to achieve tension. A representation of the plates is available in Figs. 2-3. The aforementioned FE models have been validated using the case studies from the ANSYS verification manual.
Fig. 2Geometry of flat plate with crack (a), FE model of flat plate with crack (b)
a)
b)
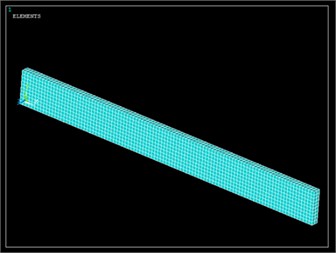
Fig. 3Geometry of curved plate with crack FE model of curved plate with crack (b)
a)
b)
The cracked areas of the plates have been introduced to the FE model using the XFEM method because it eliminates the need to remesh crack-tip regions. The method has some strong advantages, since it extends the conventional FEM to account for cracks based on the concept of partition of unity [16, 17]. Within the XFEM method, the Phantom-Node Method [18-21] is preferred because it considers only the displacement jump across the crack faces and ignores the crack-tip singularity contributions. The parameters applied for simulating the crack growth during tension, using the Phantom-Node method of the XFEM, are presented in Table 2.
Table 2Crack growth parameters for Phantom Node XFEM model
Maximum circumferential stress criterion [MPa] | 0.5 |
Rigid linear evolution law for the decay of stress | 0.04 |
4.3. Monolithic composite plates
For the case of the composite flat plate a parametric FE model has been also developed as previously. From this generic FE model a wide range of plates with arbitrarily located and sized delaminations can be built and analysed. The delamination(s) of the plate is/are declared by parameters from the image processing algorithm. To demonstrate the plate’s numerical model, the geometric characteristics of Table (1) are utilised. The material properties have the following representative values; = 32.3 GPa, = = 8.5 GPa and = 2.03, = = 1.01 GPa, while the Poisson ratio is = = = 0.29. A reference model, referred hereafter as “Reference-PDM”, where no delaminations are considered, is developed for comparison purposes. The reference FE model has PDM features to detect failure according to failure criteria.
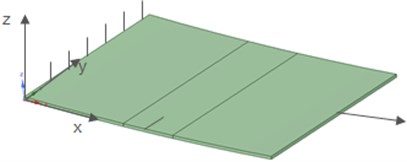
The mesh size has been carefully selected based on a convergence study, as well as model validation has been also performed. The same boundary conditions with those mentioned to the respective metallic plate are considered. One edge is loaded by applying incremental forced displacement in the -direction, so that plate’s compression is achieved. The forced displacement corresponds to the UL that has to withstand the plate. The characteristics of the composite plate are shown in Fig. 4. It has also to be noted that the developed FE model is not limited to generate plates with midplane through delaminations, but it can also generate multiple and randomly located delaminations.
Fig. 4Geometry of composite flat plate with delamination (a), FE model of flat plate with delamination (b)

a)
b)
The FE model described assumes that the delamination growth is initiated in the loading direction and the delamination is driven by local buckling of a thin delaminated region referred hereafter as sub-laminate. Additionally, it is assumed that the base substrate remains flat before sub-laminate buckling, in the local post buckled regime and at propagation. Finally, the released strain energy of delamination growth in the longitudinal yields to Mode I fracture of the resin material. In reality, the propagation is more complex than assumed, since growth is mixed mode, [22]. However, taking into account only Mode I for delamination due to buckling has shown to produce accurate numerical predictions [23].
In the current application, a bilinear form of the CZM model is used, employing the relation between normal cohesive traction and normal displacement jump , Eq. 1, [24].
where, is the damage parameter associated with Mode I dominated bilinear cohesive law. The bilinear form has been selected as the most suitable form for the numerical solution of delamination problems due to buckling, assuming that Mode I governs the failure analysis. The parameters applied for simulating the delamination growth during buckling, using the bilinear form of the CZM model, are presented in Table 3.
Apart from the CZM modelling technique that simulates delamination and delamination growth, PDM has been also considered. It is well known that the material can experience enough damage in local failure level that eventually the structure is not able to withstand the UL. Hence, in order the developed application to be able to calculate the strength reduction of the material, due to concentrated local failure, the appropriate ANSYS subroutines for PDM have been employed.
Table 3Interface delamination bilinear CZM model parameters
Maximum normal contact stress [MPa], [15] | 0.66 |
Critical fracture energy for normal separation [N/mm] | 1.16 |
Maximum equivalent tangential contact stress [MPa] | 15.3 |
Critical fracture energy for tangential slip [N/mm] | 1.72 |
Artificial damping coefficient | 1e-5 |
Flag for tangential slip under compressive normal contact stress | 1 |
To obtain PDM calculation, damage initiation and evolution criteria are set to analyse the progression of damage within the composite structure. Damage initiation criteria are used for declaring the failure criteria that determine the onset of material damage under loading. Two different failure criteria have been employed for the aforementioned purpose; Maximum Stress and Tsai-Wu failure criteria. Aim is to determine the most appropriate one. Furthermore, the Hashin and the Puck damage evolution laws are selected to define the material damage progression after the initiation of damage, referred hereafter as Hashin-PDM and Puck-PDM.
5. Numerical results
The investigated structural components are limited to the aircraft’s skin structure that it is simulated by flat and curved plates, while the examined loading cases are tension for metallic and compression that lead to buckling for monolithic composite flat plate. The numerical results concern static loads only and for the complete DT check, fatigue analysis has to be also carried out. The latest analysis is not presented hereafter, but it will be presented in a future work.
5.1. Metallic plates
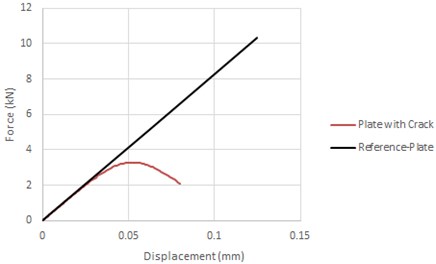
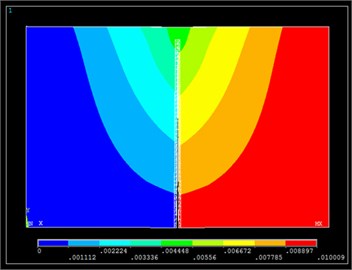
For the metallic plates the existence of crack(s) is/are expected to reduce the tensile strength of the plates due to their propagation. A force-displacement graph for each FE model (flat and curved plate) is extracted from the FE model and it is presented in Figs. 5-6 respectively. In the same graph, the respective reference FE model, where no crack is considered, is also depicted for comparison reasons. According to Section 3, if tensile strength reduction is detected before the UL is reached, then the plate is not able to operate properly and it has to be substituted. To visualize the displacements of the plates and the crack propagation the axial displacement of the cracked plates are also available in Figs. 5-6.
Fig. 5Contour plot of axial displacement-Flat plate (a), force vs. axial displacement-flat plate (b)
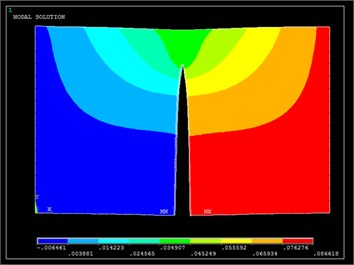
a)
b)
As it can be observed from Figs. 5-6 for small values of axial load, the force-displacement plot of the damaged plates coincide with the respective of the reference. This occurs due to the fact that the crack is not propagating yet. The propagation of the crack starts when a minimum load has reached (2.7 kN for the flat and 200 N for the curved plate), at these points the force-displacement plots start to deviate from the references plots. No UL is available for the analysed plates, hence comments for specific loads cannot be made. However, the following condition can be expressed for covering the requirements of the structural assessment rules of CS-25 book. If the UL of the plate is larger than the point where this deviation occurs then the plate cannot function any more under this static load and vice versa. This method can be adopted to examine the residual tensile strength of any structural component. It is also worth mentioning that the reference plots of both plates appear a bilinear behaviour due to the bilinear stress-strain plot that has been inserted as material properties. However, the change of slope (after yield stress) of the reference plots is not available in Figs. 5-6 for scaling reasons; it occurs at higher loads.
Fig. 6Contour plot of axial displacement-curved plate (a), force vs. axial displacement-curved plate (b)
a)
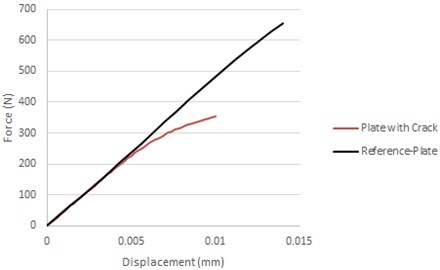
b)
5.2. Monolithic composite plates
The monolithic composite flat plate are subjected to compression load as it is mentioned in Table 1. As a result, buckling due to compression may appear to the plate. The fact that delamination(s) exist(s) may lead buckling to occur in lower critical buckling load. Therefore, in this section, a buckling analysis is performed for the composite monolithic plate, so that a comparison between the critical buckling load of the delaminated composite plates and the respective reference (plate with no delaminations) to be carried out. The force-displacement graph has been plotted for the FE model in Fig. 7. In the same graph, the respective reference FE model (Reference-PDM), where no delaminations exist, is also demonstrated in order to observe whether the delamination has caused critical buckling load reduction.
Fig. 7Force vs. axial displacement-curved plate
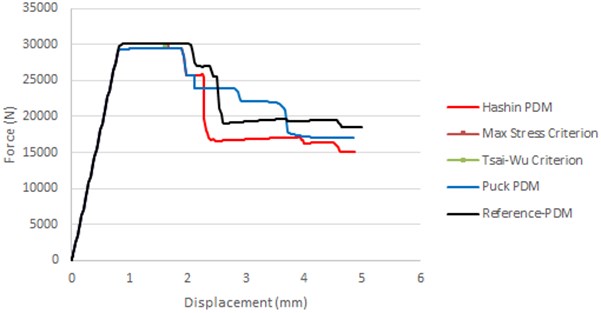
In Fig. 7, the force-displacement curve of the delaminated composite plate is demonstrated using Hashin and Puck damage evolution laws (Hashin-PDM and Puck-PDM respectively). Both evolution laws produce similar results regarding the prediction of the critical buckling load. The prediction of the onset of damage has been calculated using the Max-Stress and Tsai-Wu criterion. From the graph, it can be observed that both criteria yield the same force and displacement where damage growth occurs. Up to the aforementioned point the two analyses (Hashin-PDM and Puck-PDM) predict the same behaviour for the delaminated plate. Therefore, both damage evolution laws are adequate for the buckling analysis of delaminated plates under uniaxial compression. Moreover, in Fig. 7 the force-displacement curve for a reference plate (no delamination) is also plotted for comparison reasons. It can be observed that the critical buckling load of the delaminated plate, as analysed using the different PDM subroutines, appears to have a decrease of 3.33 %, in comparison with the respective reference plate.
To determine whether the delaminated plate is suitable under static load to continue to operate, its UL has to be considered. Assuming that the UL is the critical buckling load of the reference plate, then the delaminated plate has to be substituted by a new one, since strength reduction has occurred according to Fig. 7. In case that the UL is less than 29 kN then the component, under static load, has adequate residual strength to continue functioning. The observed critical buckling load reduction is relative small because the considered delamination has been assumed to exist in the midplane of the composite plate. In case that an eccentric delaminations exist, it is expected to have larger critical buckling load reduction in comparison with the respective reference.
6. Conclusion
An image processing algorithm, consisting of seven different steps, has been developed and presented in this work. The geometric characteristics of the damaged component are exported from the image processing algorithm and used as input to the FE model. The defected plates simulating the aircraft’s skin have been numerically analysed within ANSYS FE software using the appropriate numerical techniques. The metallic plates are analysed using the XFEM technique, whereas the monolithic composite flat plate has been analysed using CZM technique with contact elements and PDM features. Both techniques have been proven very efficient and suitable for the application providing a successful simulation of the force-displacement response curve as the damage propagates within the material. A comparison of the damaged plates with the respective references is made determining whether the plate is able to withstand the UL or not. The aforementioned approach can be adopted for the analyses of other aerospace components with more complex geometries than the demonstrated skin structure.
References
-
Aircraft Maintenance Checks. http://en.wikipedia.org/wiki/Aircraft_maintenance_checks.
-
Adam Air Flight 172. https://en.wikipedia.org/wiki/Adam_Air_Flight_172.
-
Hsu D. K. Non-destructive evaluation (NDE) of aerospace composites: ultrasonic techniques. Woodhead Publishing Series in Composites Science and Engineering, 2013, p. 397-422.
-
Bossi R. H. ASNT Industry Handbook: Aerospace NDT. American Society for Nondestructive Testing, Columbus, OH, 2014.
-
Stamatelos D., Stamatelos F., Kappatos V., Spathopoulos Th. Numerical structural integrity assessment of an aircraft’s delaminated composite plate against buckling. 6th International Conference on Experiments/Process/System Modelling/Simulation/ Optimization, Athens, Greece, 2015.
-
Kappatos V., Dermatas E. Feature extraction for crack detection in rain conditions. Journal of Nondestructive Evaluation, Springer, Vol. 26, Issues 2-4, 2007, p. 57-70.
-
Kappatos V., Dermatas E. Feature selection for robust localization of acoustic emission sources in ship-hull structures. Research in Nondestructive Evaluation, Taylor and Francis, Vol. 21, Issue 2, 2010, p. 127-140.
-
MATLAB V6.5.1 Computer Software. The MathWorks Inc., Natick, Massachusetts, 2003.
-
Shapiro L. G., Stockman G. C. Computer Vision. Prentice-Hall, New Jersey, 2001.
-
Lauren B., Le L. W. Perceptual Information Processing System. Paravue Inc. U.S. Patent Application 10/618,543, 2003.
-
Sezgin M., Sankur B. Survey over image thresholding techniques and quantitative performance evaluation. Journal of Electronic Imaging, Vol. 13, Issue 1, 2004, p. 146-165.
-
Academic Research Mechanical. ANSYS® V17, Computer Software, 2016.
-
Certification specification for large aircraft CS-25. European Aviation Safety Agency, Amendment 3, 2007.
-
Belytschko T., Black T. Elastic crack growth in finite elements with minimal remeshing. International Journal for Numerical Methods in Engineering, Vol. 45, 1999, p. 601-620.
-
Waseem M. H. S., Kumar K. N. Finite element modelling for delamination analysis of double cantilever beam specimen. International Journal of Mechanical Engineering, Vol. 1, Issue 5, 2014, p. 27-34.
-
Melenk J., Babuska I. The partition of unity finite element method: basic theory and applications. Computer Methods in Applied Mechanics and Engineering, Vol. 39, 1996, p. 289-314.
-
Remmers J. J. C., De Borst R., Needleman A. The simulation of dynamic crack propagation using the cohesive segments method. Journal of the Mechanics and Physics of Solids, Vol. 56, 2008, p. 70-92.
-
Song J. H., Areias P. M. A., Belytschko T. A method for dynamic crack and shear band propagation with phantom nodes. International Journal for Numerical Methods in Engineering, Vol. 67, 2006, p. 868-893.
-
Duan Song Q.-J.-H., Menouillard T., Belytschko T. Element-local level set method for three-dimensional dynamic crack growth. International Journal for Numerical Methods in Engineering, Vol. 80, 2000, p. 1520-1543.
-
Mergheim J., Kuhl E., Steinmann P. A finite element method for the computational modelling of cohesive cracks. International Journal for Numerical Methods in Engineering, Vol. 63, 2005, p. 276-289.
-
Hansbo A., Hansbo P. A finite element method for the simulation of strong and weak discontinuities in elasticity. Computer Methods in Applied Mechanics and Engineering, Vol. 191, 2004, p. 3523-3540.
-
Whitcomb J. D. Parametric analytical study of instability-related delamination growth. Composite Science and Technology, Vol. 25, Issue 1, 1986, p. 19-48.
-
Rhead A. T., Butler R., Baker N. Analysis and compression testing of laminates optimized for damage tolerance. Applied Composite Materials, Vol. 18, Issue 1, 2011, p. 85-100.
-
Alfano G., Crisfield M. A. Finite element interface models for the delamination analysis of laminated composites: mechanical and computational issues. International Journal for Numerical Methods in Engineering, Vol. 50, 2001, p. 1701-1736.
About this article

