Abstract
The spectrum of various methods and tools used for solving bioengineering problems is sufficiently wide. Dynamical systems (including the symbolic ones) in many cases become a base for design and implementation of methods of investigation and computer modeling complex processes. Whereas for solving direct problems we have many well-developed methods, results for inverse problems are much more modest. We discuss two methods for such tasks: Takens’ method for reconstruction attractor by a time series, and the based on ideas of symbolic dynamics method for digital image analysis using stationary flow on graph and weighted entropy. The results of numerical experiments are given.
Highlights
- Dynamical systems are widely used when solving both direct and inverse problems.
- We consider two examples of inverse problems, which arise in the cases it is required to reconstruct the behaviour of a system by experimental data.
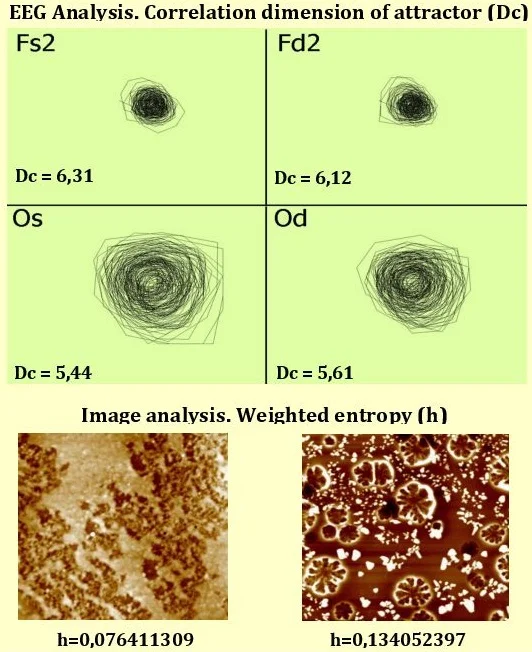
- Takens’ method allows reconstructing the attractor of a system by time series (record of a signal). The main characteristic of the attractor is correlation dimension.
- Digital image illustrating diffusion processes is represented by a weighted oriented graph. The distance between the initial and stationary distribution is measured by weighted entropy.
1. Introduction
Dynamical systems are models for many processes studied in mathematics, physics, biology (population dynamics), social sciences and economics. Many well-known systems having complex behaviour such as logistic map, the Lorenz system, the Ikeda map serve as the models for various classes of problems. Mention should be made of so-called lattice systems which include lattices of coupled maps and cellular automata. These systems are applied in rather wide range of investigations: from modelling the growth of bacteria and various kinds of diffusion (diffusion limited aggregation, cluster-cluster aggregation) [1] to epileptiform activity of neural tissues [2, 3]. Among the mathematical models arising in modern studies the number of systems that may be investigated manually without time-consuming calculations is insignificant. That inevitably leads to the progression of computer modeling of dynamical systems and various software packages which are successfully applied in investigations.
It should be noted that in the majority of cases in studies of complex biological system we cannot count on a mathematical model making. Hence, we have to follow practical methods of investigation – experiments and measurements. Modern technologies put forward a wide spectrum of high-resolution hardware to measure and register processes elapsing in biological systems. The results of measurements may be obtained as digital images (or signals) which are classified and analyzed by precise mathematical methods. The revealing an image structure results in obtaining characteristics of the system generating such an image (phase portrait).
In analysis of digital images statistical, texture, multifractal, morphological and spectral signs and their combinations are used. Many of these characteristics are invariant relative to wide class of image transformations, such as rotation, change of illumination, scaling. Fractal dimensions and various variants of entropy have a wide application in multifractal methods of image analysis [4-6]. The interpretation of obtained signs for phase portraits allows us to better understand the properties of the system studied. If for several values of a parameter, we obtain digital images which have similar structures (that may be indicated by multifractal or Renyi spectra) one may assume that the initial system has an “invariant set” (or an attractor).
Methods of nonlinear dynamics found wide application in the analysis of signals. Records of EEG, ECG and others are naturally considered as time series, so the Takens method to reconstruct the attractor by a time series [7] and the algorithm proposed by Grassberg [8] for calculation of correlation dimension of the restored attractor may be used.
In this paper we discuss two methods for analysis a system by its phase portrait, which are applied to solve inverse problems. The method of the reconstruction of the attractor of a system by a scalar time series may be interpreted as a variant of approximation of invariant sets for the systems given analytically. When solving a direct problem all the points which stay in an bounded area are considered as an approximation to the invariant set. In the Takens method we construct a copy of the attractor (if it exists) of an initial system in the space with greater dimension. The proximity of points on this copy is estimated by correlation integral.
The second method is based on ideas of symbolic dynamics (symbolic image) that allow us to represent the dynamics of a system by using an oriented graph. We propose to construct such a graph for digital images illustrating diffusion processes. In the graph the transitions from every point (pixel) to nearest neighbours are defined, such that a numerical value is assigned to every edge. Then this flow is normed and balanced to obtain the stationary one.
In fact, we model the transition of a system from an initial state to the stationary one. The measure of the difference between these states may be estimated by so called weighted entropy — in the stationary (stable) state this entropy is minimal. The method is demonstrated on examples of several classes of histological preparations.
2. Analysis of time series. Takens’ method
The result of the activity of a system may be registered as a signal and considered as a time series. The methods of analysis of EEG allows an expert to find peculiarities on the obtained records such as peak and wave complexes, which may imply some disruption in the system functioning. Along with the traditional methods statistical methods for analysis of time series are applied as well.
In 80th of the last century F. Takens proposed a new approach to the analysis of time series [15]. Assuming that a time series is a record (by one coordinate) of a trajectory of a dynamical system one may attempt to reconstruct the attractor of the system in a Euclidean space with an appropriate dimension and calculate correlation dimension of the attractor. Such an attractor has the same topological properties as the attractor of the system generating this series. The method got the name “reconstruction of attractor on a time series”. Needless to say, that the signal may happen to be random noise.
Note, that in the general setting the problem of defining some parameters of a system by a time series is incorrect, because the addition of a small noise to the signal may change system dynamics. Hence when applying the Takens method we should follow some restrictions, namely: for the time series the stationary condition is fulfilled, the mapping defining the system is smooth enough (class , trajectory visits different parts of the attractor with the same probability. Under suitable conditions the application of Takens’ method to EEG analysis allowed finding different sleep stages, recognize brain traumas, reveal the synchronization of -rhythms in different parts of brain [10-13].
The idea of the method is based on the fact that a -dimensional manifold may be embedded into -dimensional Euclidean space (Whitney’s theorem).
Let be a -th order dynamical system defined on a compact -dimensional manifold , and let we obtained a time series as a result of observation of the system functioning on a coordinate . Then is the value of -th component of at the time . If the system has an attractor , it may be restored in Euclidean space with dimension .
Define the map as the follows , where is a period of the sample. In what follows we omit the denotation for simplicity.
Construct the vectors from the data of the time series ...,,…, ...,,…, ...,, where is the length of the segment of the time series. In other words, we construct as a point in the space .
By the Takens theorem is embedding in , and it is the generic property.
Hence, we have two systems: , and which are connected by a nondegenerate change of variables . There is the characteristic that is invariant with respect to this change – correlation dimension, and we may obtain the properties of the attractor of the initial system as the properties of its copy in
To determine the dimension of the embedding we should find such for which there exists a functional dependence between values of the time series. If the system has an attractor, then the points (trajectories) constructed by the time series are close. To estimate the closeness of points we use correlation integral and then calculate correlation dimension of the attractor.
The correlation integral estimates the number of pairs of points (constructed vectors ) which are -close: , where is the size the sample and is the Heaviside function. The correlation dimension of the attractor is defined as and calculated approximately by the least square method as the angular coefficient of the line in coordinates
Thus, by changing the length of vectors (denote it by ) we calculate . This value may reach a stable value or not. In the first case we take the minimal value of for the dimension of embedding, otherwise we believe that our series is a random noise, not a dynamical system.
In [13] the author analyzed EEG of a patient with epilepsy and calculated the correlation dimension on each from 16 channels in various periods of disease. Basing on this characteristics the analysis of the dynamics of -rhythm (the main rhythm of brain) was performed. The results show that correlation dimension may be used to reveal the -rhythm synchronization in different parts of the brain, which is a disruption of brain activity.
The correlation dimension calculated for channels corresponding lesions is less than on the channels relating to health parts. Moreover, the decreasing of correlation dimension propagates on adjoining parts of brain. In the normal state -rhythm is not observed in frontal sections, whereas in epilepsy this rhythm may occur, in other words distant synchronization appears.
3. Mathematical modelling of diffusion processes by stationary processes on graph
А method of the classification of images illustrating the substance propagation process was proposed and developed in [14, 15]. The image is considered as a lattice formed by pixels of given intensities . Then an oriented graph corresponding to the image is constructed in the following way. Every vertex has the weight and is connected with neighbours, such that for a given vertex all outcoming edges have the value , for boundary vertex – , where or for and or for . The constructed flow is normed such that equals . In so doing we obtain Markov chain on the graph: for every vertex its weight is equal to the sum of weights of outcoming edges. Denote the initial distribution on edges by . Our purpose is to find such a distribution that the flow on the graph be stationary: for every vertex the sum of weights of incoming edges equals the sum of weights of outcoming ones. It is well known that such a problem has a solution if there is a cycle on a graph; the solution may be obtained by the Sheleihovsky-Bregman method [16]. Besides that, it was proved in [17] this solution minimizes weighted entropy .
It is weighted entropy that is used as a classifying sign when images concerning to different doses of a substance are analyzed. In fact, weighted entropy may be considered as a “time” that is required for a distribution process to achieve a stationary state: the more concentration the more this time. In [18] the authors used this method to classify pharmacological solution of Ag. We note that the classification gave reliable results when using H component of HSV palette.
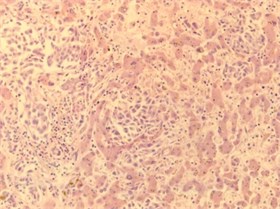
We consider the example of application of this method to the class of histological preparations – liver tissues.
The images were produced by using microscope AxioCam MRc5 (Carl Zeiss Microimaging GmbH), and program software ZEN 2011, Blue Edition. All the images were obtained in the same conditions, in RGB palette and have the size 2584х1936 pixels. We illustrate the method on the example of 4 images from different classes: plethora, fatty hepatosis, cirrhosis and metastasis. They are shown on Fig. 1.
Fig. 1Images of liver tissue from 4 different classes
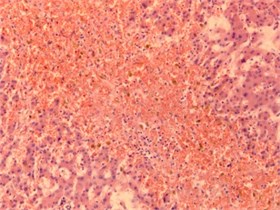
a) Plethora
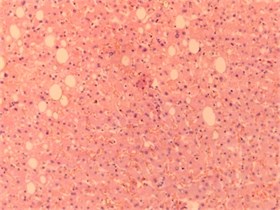
b) Fatty hepatosis
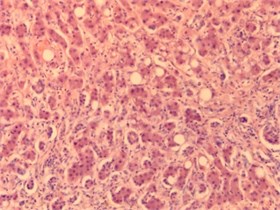
c) Cirrhosis
d) Metastasis
In experiments all the images were transformed to both greyscale and HSV (Hue, Saturation, Value) presentation. When using HSV palette the component H seemed to be the most informative, because namely this component shows structure peculiarities of an image, and weighted entropy is considerably different for images from different classes. The results of experiments are given in the table below. Here WE means weighted entropy.
The method described allows various variants of optimization. They were performed in [19] and, as experiments showed, leaded to the reducing run time in average 5-6 times comparing to the base algorithm.
Table 1Weighted entropy of given images for 2 color presentations
Image name | WE (Grayscale) | WE (H component) |
Plethora | 0,000018619 | 0,134031929 |
Fatty hepatosis | 0,000017132 | 0,125246805 |
Cirrhosis | 0,000016073 | 0,083312787 |
Metastasis | 0,000016761 | 0,095221617 |
4. Conclusions
Methods of the theory of dynamical systems are natural in scientific investigation, because any process has intrinsic dynamics and the objective of any study is to find it. By now significant advance has been made in the application of dynamical systems to solving different problems in the modeling biological processes. Classical dynamical systems are successfully used in the studying population dynamics, modeling neuronal activity. The attempt to solve inverse problems results in the analysis of a system behaviour by its phase portrait. The methods of nonlinear dynamics for signal processing and mathematical tools for digital image analysis serve for solving inverse problems.
As recent results show, complex problems in bioengineering may demand an extension of the class of mathematical models. Thus, in the last few years in modeling sociological processes the methods based on multi-agent paradigm are used. It is not improbable that a combining methods of dynamical systems with other approaches will lead to new ideas and methods in wide range of bioengineering problems.
References
-
Murray J. Mathematical Biology II: Spatial Models and Biomedical Applications. Springer 2003.
-
Dudkin A., Sbitnev V. Coupled map lattice simulation of epileptogenesis in hippocampal slices. Biological Cybernetics, Vol. 78, 1998, p. 479-486.
-
Sbitnev V., Ampilova N. Chaotic dynamics of field potentials simulated by a neural mass network. Biophysical Neural Networks, Mary Ann Liebert Inc., 2001, p. 389-409.
-
Ampilova N., Soloviev I. On application of entropy characteristics to texture analysis. Transactions on Biology and Biomedicine, Vol. 11, 2014, p. 194-202.
-
Ampilova N., Soloviev I. Entropies in investigation of dynamical systems and their application to digital image analysis. Journal of Measurements in Engineering, Vol. 6, Issue 2, 2018, p. 107-118.
-
Ampilova N., Soloviev I., Barth J.-G. Application of fractal analysis methods to images obtained by crystallization modified by an additive. Journal of Measurements in Engineering, Vol. 7, Issue 2, 2019, p. 48-57.
-
Malinetzki G., Potapov A. Modern Problems of Nonlinear Dynamics. Moscow, 2000. (in Russian)
-
Grassberger P., Procaccia I. Measuring the strangeness of strange attractors. Physica D: Nonlinear Phenomena, Vol. 9, Issues 1-2, 1983, p. 189-208.
-
Takens F. Detecting Strange Attractors in Turbulence. Lecture Notes in Mathematics, Springer, Berlin, Heidelberg, New-York, Vol. 898, 1981, p. 366-381.
-
Babloyantz A. Chaotic dynamics in brain activity. Dynamics of Sensory and Cognitive Processing by the Brain, Springer, Berlin Heidelberg, New-York, 1988, p. 196-202.
-
Röschke J., Basar E. The EEG is not a simple noise: strange attractors in intracranial structures. Dynamics of Sensory and Cognitive Processing by the Brain, Springer, Berlin Heidelberg New-York, 1988, p. 203-216.
-
Röschke J., Aldenhoff J. The dimensionality of human’s electroencephalogram during sleep. Biological Cybernetics, Vol. 64, Issue 4, 1991, p. 307-313.
-
Nikolaeva D. On application of the method of correlation dimension estimation for analysis EEG of patients with epilepsia. Differential Equations and Control Processes, Vol. 2, 2009, p. 43-51, (in Russian).
-
Ampilova N. Stationary processes on graphs and image analysis. Computer Instruments in Education, Vol. 3, 2013, p. 27-32, (in Russian).
-
Ampilova N., Sergeev V.,Soloviev I. On the method of digital image analysis based on the construction of a stationary flow on graph. Humanity and Science University Journal, Vol. 22, 2016, p. 29-36.
-
Bregman L. Relaxation method of the finding of a common point of convex sets and its application. Ph.D. Thesis, Leningrad, 1966, (in Russian).
-
Romanovsky I. Optimization of the stationary control of a discrete deterministic process of dynamic programming. Kibernetica, Vol. 2, 1967, p. 71-83, (in Russian).
-
Batyukov A. Digital image analysis based on the construction of a stationary process on a graph. Vestnik St. Petersburg University, Ser. 10, Applied Mathematics, Informatics, Control Processes, Vol. 2, 2015, p. 115-122, (in Russian).
-
Sergeev V. On the algorithm optimization for calculation a stationary flow on an oriented graph. Computer Tools in Education, Vol. 2, 2017, p. 16-24, (in Russian).
About this article

The authors thank the Mariinsky hospital in St. Petersburg for the images granted and useful discussions.
