Abstract
Rolling element bearing and gear are the most common used rotating parts in rotating machinery and they are also the fragile mechanical part. Studying the effective method of timely diagnosis of them is very necessary. The Wigner-Vile spectrum (WVS) is an effective time-frequency analysis and common used method for diagnosis of rotating machinery. However, it would not work effectively when the impulsion characteristic fault signal of rotating machinery is buried by strong background noise. To solve the above problem, the property of cyclostationarity of the rotating machinery signal is used, and the cyclic spectral density basing on second order cyclostationarity statistic is combined with the WVS, and the cyclic spectral density Wigner Vile spectrum (CSDWVS) time-frequency method is proposed in the paper. Through the analysis results of simulation and experiment, the CSDWVS method has the advantages of much more noise-resistant than traditional WVS method, and it could extract the fault feature of the vibration signal of rotating machinery buried in strong background noise. Besides, it also has better time frequency aggregation effect.
Highlights
- The disadvantage of WVS is improved when the fault signal of rolling bearing is buried by strong background noise.
- The property of cyclostationarity of the rotating machinery signal is used, and the cyclic spectral density basing on second order cyclostationarity statistic is combined with the WVS.
- The new time-frequency method naming cyclic spectral density wigner vile spectrum is proposed.
- The proposed method has the advantages of much more noise-resistant than traditional WVS method.
1. Introduction
The rolling element bearing is the key part in rotating machinery and is also fragile part [1], and it is meaningful to study effective fault diagnosis method of them in ensuring the reliable running of machinery. In recent years, amounts of literatures relating to fault diagnosis of rolling bearing have been arising. A signal processing techniques to extract entry and exit points from the bearing vibration signal for spall size estimation was proposed and the experiment results showed that the techniques provided less biased results with respect to spindle speed and more precise estimation [2]. An improved vibrational resonance method was proposed and applied to detect weak bearing fault detection successfully [3]. The paper characterized analytically bearing fault vibrations and explore its angle\time cyclostationary propery, and a real-world vibration signal demonstrated the preference of the proposed method over classical approaches [4]. The cepstrum pre-whitening method was applied in fault diagnosis of rolling bearing under variable speed conditions [5]. Time-frequency analysis (TFA) method is one of the common used methods for fault diagnosis of rotating machinery, and it could reflect the time-frequency characteristics of fault signals of rotating machinery simultaneously compared with the single time or frequency method. WVS time-frequency analysis method is the energy density function of signal in time-frequency two-dimensional plane, and it has the advantages of high resolution, energy aggregation and good instantaneous frequency tracking property. The WVS and its related improved method have been used widely in fault diagnosis of rotating machinery. The reassigned smoothed pseudo WVS and autoregressive model-based filtering were combined and used in fault diagnosis of gear [6], and it was verified that not only the single fault arising in gearbox could be identified, but also the compound gear defects could be diagnosed successfully by the combined method. To solve the defect of FFT in handing bearing' vibration signal, the WVS and the modified Poincare mapping method were used in detecting bearing failure [7]. The WVS and intrinsic time-scale decomposition were used together in fault diagnosis of rotating machinery [8], and simulation results using the proposed method showed that the method not only preserved the advantages of intrinsic time-scale decomposition and WVS, but also was better than the smoothed pseudo WVS (PWVS). However, there exists serious cross-interference terms in WVS and most literatures relating to WVS focus on mitigating the influence of cross-interference terms. The eigenvalue decomposition of the Hankel matrix was improved and used to reduce the cross-term in WVS [9], and satisfactory result is obtained. To solve the cross-terms existing in quadratic system and WVS, a bispectrum-based technique was proposed in paper [10] which had better smooth effect than pseudo-WVS, and the proposed method was used in analyzing of multicomponent signals. The authors of paper [11] studied the method to remove cross-terms in the WVS of multicomponent linear frequency modulation signals, and the proposed method not only improved the signal to noise ratio and removed the cross-terms, but also maintained high resolution through the verification of simulation and experiment. A new time-frequency analysis method based on multi-scale Chirplet sparse decomposition and WVS was proposed to solve the problem of time-frequency interference existing in the multicomponent polynomial phase signal WVS [12]. A time-frequency analysis method was enhanced in paper [13] to suppress the cross-terms in WVS which had the virtue of without degrading the energy concentration. Besides, the method outperformed the other relative methods in the ability of resolving close signal component. The tunable-Q wavelet transform was used in reducing cross-terms in WVS [14], and the advantages of the proposed method was shown by comparing its analysis results with the analysis results of relative existing methods which were based on the Fourier-Bessel series expansion and filter-bank based cross-terms reduction and so on. The adaptive Short-Time Fourier Transform spectrum was used to suppress the cross-terms in WVS basing on the study of correlation between auto-terms and cross-terms [15], and the examples indicated that a better resolution and more effective suppression of cross-term interference could be obtained using the proposed method. With the study of the cross-term in WVS, a new method to eliminate the cross-term which called the standardization of the pseudo quadratic form was presented in paper [16], and the simulation results showed that the method was accurate and easy to use.
In the paper, to solve the serious cross-interference terms in WVS and the problem that the time-frequency analysis method WVS could not extract the fault feature effectively when the impulsion characteristic fault signal of rotating machinery is buried by strong background noise, the CSDWVS time-frequency method is proposed in the paper basing on the property of cyclostationarity of rotating machinery by combing the cyclic spectral density basing on second order cyclostationarity statistics with the WVS. The paper is organized as follows. Section 2 is dedicated to the basic theory of WVS and cyclostationarity. The details of the CSDWVS are presented in Section 3. The validation of the proposed method on simulated data and experiment data are shown in Section 4 and Section 5 respectively, and Section 6 gives the conclusion obtained from the above results.
2. Basic theory
Due to the reason that the theory of proposed CSDWVS method is based on WVS and Cyclostationarity, so the theories of WVS and cyclostationarity will be described briefly in this section.
2.1. WVS
The Wigner-Ville (WV) of any given signal is defined as following:
where represents the analytical result of , and conjugated results of is represented by . Besides, there exists the following equation:
where represents the real part of , and represents the Hilbert transform of and it is the imaginary part of .
The WVS of any given signal is defined as following:
In Eq. (3), and represents mean and autocorrelation algorithm respectively:
2.2. Cyclostationarity
Cyclostationarity is the characteristic of non-stationary signals which means that some order statistics of the signal takes on cyclic characteristics. Signals could be divided into first order, second order and high order cyclostationarity [17-19]. Cyclostationarity has been used widely in fault diagnosis of rotating machinery since it was put forward [20-23]. The proposed method mainly bases on the second-order cyclic correlation density (CSD) method, and the basic theories of second-order cyclostationarity and CSD are presented as following.
The definition of second-order cyclostationarity: The signal is defined as second-order cyclostationary if the period of autocorrelation function of non-stationary signal is time-varying (The period is ), and which could be represents by the following equation:
in Eq. (5) could be expressed by Fourier series as shown in Eq. (6):
where , … –2, –1, 0, 1, 2 represents the discrete cyclic frequency, and is Fourier coefficients which could be calculated by Eq. (7):
is named as cyclic autocorrelation (CA), and is cyclic frequency (CF). The fault characteristic frequency (FCF) is CF when fault arises in rolling element bearing.
The definition of CSD: The Fourier transform of CA relating to time-delayis named CSD which could be expressed by Eq. (8):
3. CSDWVS
The following equation could be deduced by considering Eqs. (3), (6) and (8) comprehensively:
Apply inverse transformation on Eq. (9) and the CSDWVS could be obtained as shown in Eq. (10):
Though one more CSD step is added in CSDWVS by comparing Eq. (10) with Eq. (3), the amount of calculation of SCDWVS would not be increased too much in practical application because the cross-correlation between different frequencies is only calculated sequentially. Besides, The CSDWVS method can also use long time series to calculate the time-frequency distribution of WVS effectively.
The SCD of signal for any given cyclic frequencycould be calculated by using Eq. (11) based on Eqs. (7) and (8):
where , and is the cross-correlation function of and . So it only needs to scan the interested cyclic frequency set in the calculation process of CSDWVS and the cross-interference terms are mitigated to some extent. Besides, the noise could be reduced in CSDWVS by utilizing the homogenization effect of long time series on stationary noise.
4. Simulation
The mathematical model [24-25] of rolling bearing fault shown in Eq. (12) is used to verify the effectiveness of the proposed method. is the tiny fluctuation around mean period . The sampling frequency is set as 25.6 kHz, and the rotation frequency of shaft is set as 12 Hz. The inner race FCF is set as 100 Hz, and 2 kHz represents the system nature frequency. The random slide between the race and rolling element is supposed to be distributing normally, and its standard deviation is set as 0.5 % of the shaft rotation ratio:
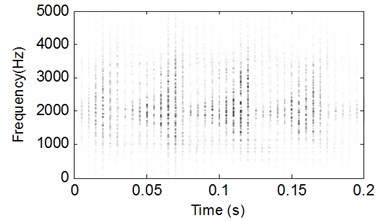
First, let 0 in Eq. (12) to simulate inner race fault signal without noise interfering and the corresponding time-domain waveform is shown in Fig. 1 from which the modulation and impulsion phenomenon of bearing fault signal is very evident. Apply CSDWVS and WVS on the signal shown in Fig. 1 respectively and the analysis results are shown in Fig. 2 and Fig. 3, and it is verified that the inner race FCF could be extracted by the two methods when there is no noise interfering.
Fig. 1Time-domain waveform of rolling bearing simulation signal without noise
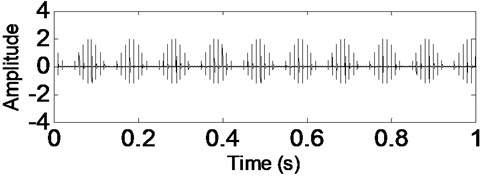
Fig. 2CSDWVS analysis result of the signal shown in Fig. 1
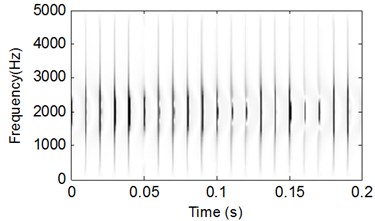
Fig. 3WVS analysis result of the signal shown in Fig. 1
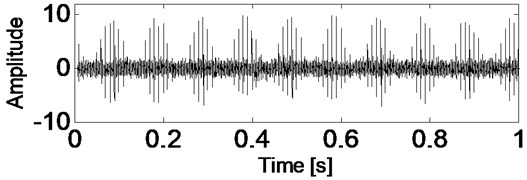
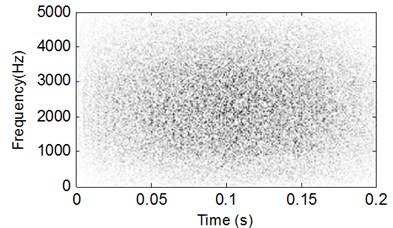
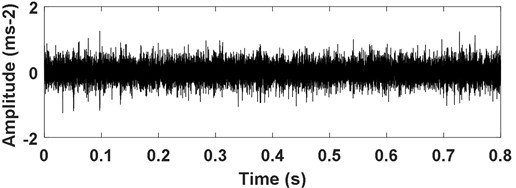
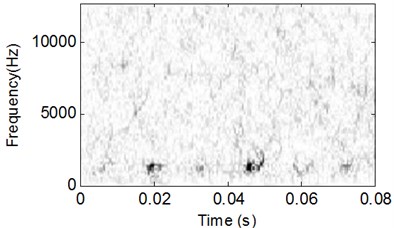
Add white noise into the signal shown in Fig. 1 and the time-domain waveform of the noised signal is presented in Fig. 4. The analysis results of the signal shown in Fig. 4 using CSDWVS and WVS are shown in Fig. 5 and Fig. 6 respectively: it is evident that the WVS could not extract the inner race FCF based on Fig. 6 when the background noise is strong. However, the inner race FCF still could be identified successfully based on Fig. 5 by using SCDWVS method. So, the noise-resistance virtue of SCDWVS over WVS is verified.
Fig. 4Time-domain waveform of rolling bearing simulation signal with noise
5. Experiment
In the section, the analysis results of the proposed method on vibration signals of rolling element bearing and gearbox are presented respectively to verify the effectiveness and advantage of the proposed method.
5.1. Rolling element bearing experiment
The test bed of rolling bearing fault experiment is presented in Fig. 7. Two test rolling bearings are used to support the two ends of the shaft, and the right side bearing is removable for test convenience. The coupling is used to connect the shaft and driving AC motor, and 1.1 kW is the rated power of driving AC motor. The hydraulic position and clamping were equipped on the test bed to fix the outer race of test bearings in the experiment process.
Fig. 5CSDWVS analysis result of the signal shown in Fig. 4
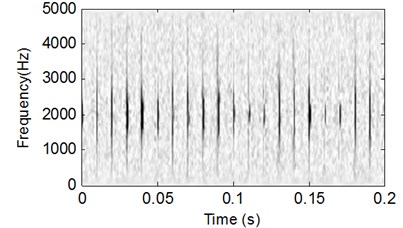
Fig. 6WVS analysis result of the signal shown in Fig. 4
Firstly, the run state of normal bearing is carried out and the type of the test bearing is GB203. The corresponding time-domain waveform of the test vibration signal is shown in Fig. 8, and it is evident that there is not impulsive component in the signal. Then tiny point corrosions is eroded on the inner race of test bearing to using EDM technology and the fault bearing is shown in Fig. 9. The inner race of test bearing rotates synchronously with the shaft while the outer race of test bearing is fixed on the bench in the test process. The sampling frequency is 25.6 kHz. The parameters and FCFs of the test rolling bearing are shown in Table 1.
Fig. 7The test rig
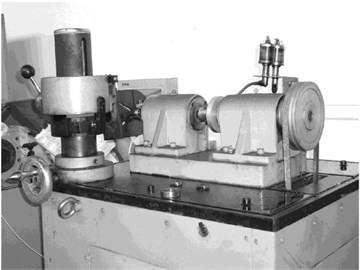
Fig. 8Time-domain waveform of normal rolling bearing signal
The time-domain waveform of bearing’ inner race vibration signal is shown in Fig. 10, and the impulsive characteristic of inner race fault is evident. Apply CSDWVS method on the inner race fault signal and the corresponding CSDWVS analysis result is presented in Fig. 11 based on which the inner race FCF with its harmonics are extracted perfectly. In order to verify the advantage of CSDWVS over WVS, the WVS analysis result is given in Fig. 12, and the inner race FCF could not be extracted due to the interference of rotating frequency with its harmonics.
Table 1Parameters and FCFs of the test rolling bearing
Type | Pitch diameter (mm) | Ball diameter (mm) | Ball number (n) | Contacting angle (angle) | ||
GB203 | 28.5 | 6.747 | 7 | 0 | ||
FCFs | Equation | Results (Hz) | ||||
Rotating frequency | 12 | |||||
Rolling elements FCF | 47.8 | |||||
Inner race FCF | 51.9 | |||||
Outer race FCF | 32.1 | |||||
Cage FCF | 4.6 | |||||
Fig. 9The machined faulty bearing
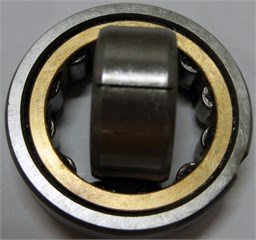
Fig. 10Time-domain waveform of rolling bearing’ signal with inner race fault
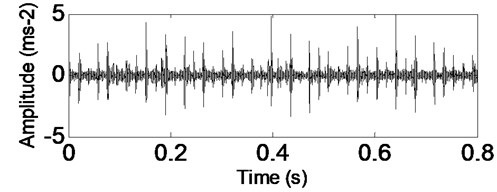
Fig. 11CSDWVS analysis result of the signal shown in Fig. 10
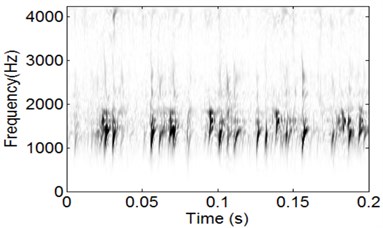
Fig. 12WVS analysis result of the signal shown in Fig. 10
The analysis processes of vibration signal of the test bearing with outer race fault are same as the above stated inner race fault, and the corresponding analysis results are shown in Fig. 13-Fig. 15. Though the WVS could extract the outer race FCF roughly based on Fig. 15, the CSDWVS analysis result is much better based on Fig. 14.
In the section, the application of the proposed on inner race and out race fault of rolling bearing are carried out and the advantage of it over traditional WVS is verified. The reasons of the proposed method are as followings: CSDWVS is able to characterize non-stationary signals. If components of a signal dot share the same localized time center, it will obtain satisfactory results both in reducing interference terms and in improving time frequency resolutions. Besides, CSWVS only uses one dimensional vector operation, which allows it to utilize longer data segment and require less computer memory than the computations of WVD, where signal length is restricted by the computer memory because of the two-dimensional matrix operation in their algorithms.
Fig. 13Time-domain waveform of rolling bearing’ signal with outer race fault
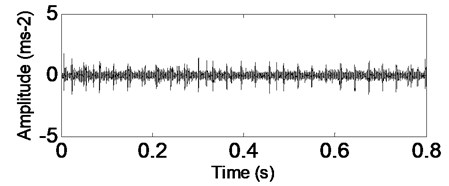
Fig. 14CSDWVS analysis result of the signal shown in Fig. 13
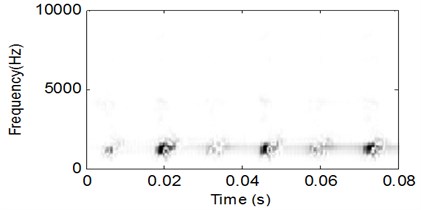
Fig. 15WVS analysis result of the signal shown in Fig. 13
5.2. Gearbox experiment
In the section, the application of the proposed on gear fault vibration signal is carried out. The number ratio of the two meshing gears is 41:37, and the modulus and contact angle of the two meshing gears are 5 mm and 20 degree respectively. The test rig of the gear experiment is shown in Fig. 16, and the accelerator sensor is installed on the gearbox. The sampling frequency is set as 10240 Hz and the length of sampling data is 37888 points.
Firstly, the run state of normal gear is carried out and the corresponding time-domain waveform of the gearbox normal vibration data is shown in Fig. 17 which conforms to the characteristics of gear during normal operation. Then process wear fault on one of the two gears and the machined faulty gear is shown in Fig. 18. The corresponding time-domain waveform of the faulty gearbox vibration data is shown in Fig. 19(a) from which not only the impulsive characteristic arises but also the modulation phenomenon arises. The corresponding frequency-domain waveform of the vibration signal is presented in Fig. 19(b), and the spectral lines are chaotic basing on which gear fault characteristic could not be identified.
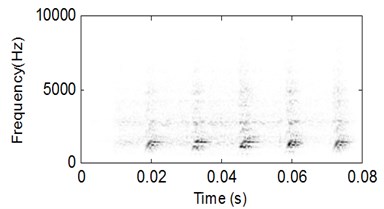
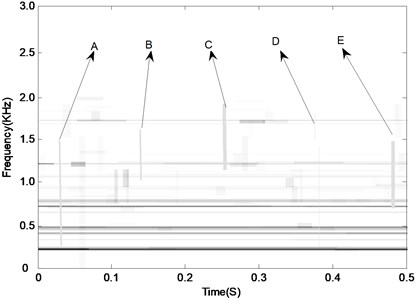
Apply CSDWVS and WVS methods on the signal shown in Fig. 19(a) and their analysis results are given in Fig. 20 and Fig. 21 respectively. The fault characteristic of the gearbox could not be expressed as expressed in Fig. 20 because the occurring frequency of the impulsion could not be obtained. However, the CSDWVS extracts the gear FCF successfully as shown in Fig. 21 because the time interval of the impulsion caused by failure is 0.1 second, and the reciprocal of time interval is exactly the fault frequency. Since the test gear is a helical gear, the contact transition between the teeth is smooth, so it can be inferred that the impact component in the signal is the impact signal generated by the fault. The advantages of the proposed method are further verified.
Fig. 16The test rig of gearbox experiment
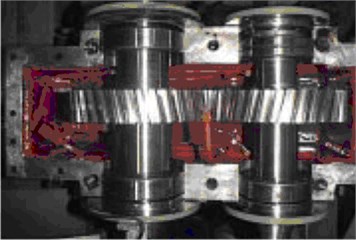
Fig. 17Time-domain waveform of normal gear vibration data
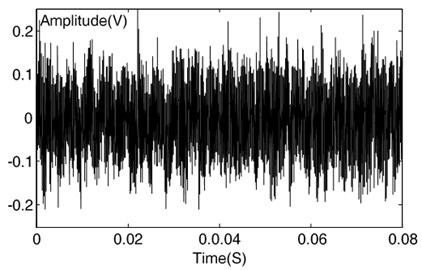
Fig. 18The machined faulty gear
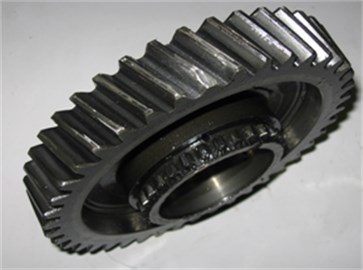
Fig. 19The time domain and frequency domain waveforms of faulty gearbox vibration data
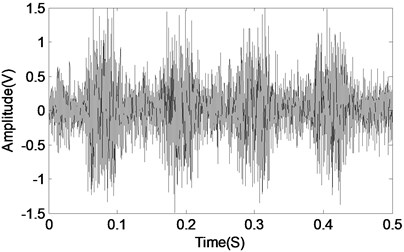
a) The time-domain waveform of gearbox fault vibration data
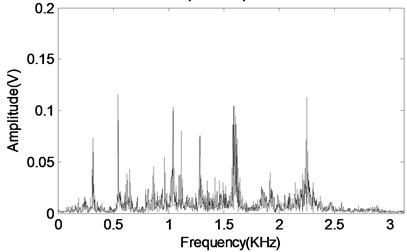
b) The frequency-domain waveform of gearbox fault vibration data
6. Comparison between envelope analysis and the proposed method
Envelope analysis has been widely used in bearing fault diagnosis. It can be used to separate the modulating signal, which typically contains information that indicates the faults, from the carrier signal. For rolling element bearings, some of the characteristic frequencies, which can be used for bearing fault diagnosis, will appear in the separated information of the envelope spectrum.
Fig. 20The WVS analysis result of the signal as shown in Fig. 19(a)
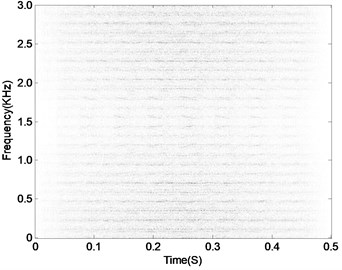
Fig. 21CSDWVS analysis result of the signal as shown in Fig. 19(a)
Envelope analysis can be achieved by digitizing the signal and band-pass filtering it in a frequency region where there is a high signal-to-noise ratio, for example typically around a resonance of the test structure or the accelerometer. The envelope signal can then be obtained by using the Hilbert transform technique:
where is the Hilbert transform of , is the analytic signal of , and is the envelope signal of . Then the envelope spectrum analysis can be obtained by performing the FFT of the envelope signal .
Fig. 22Envelope analysis result of the signal as shown in Fig. 13
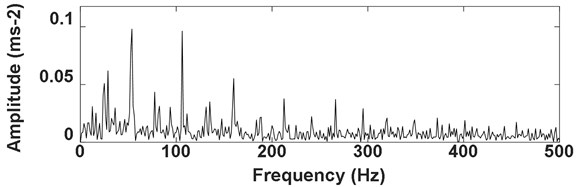
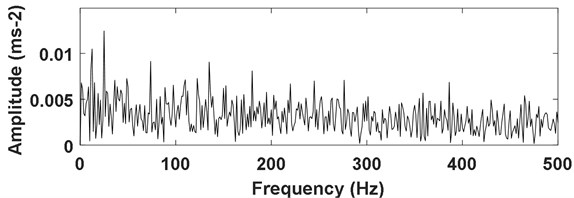
Firstly, the envelope demodulation analysis result of the signal as shown in Fig. 13 is presented in Fig. 22, and the inner race fault characteristic frequency with its harmonic could be extracted. Then apply envelope demodulation analysis on the signal as shown Fig. 19(a) and the corresponding analysis result is shown in Fig. 23 from which the fault characteristic frequency of gear could not be identified. These results verify that the envelope analysis method could extract the rolling fault feature successfully same as the proposed method. However, the envelope analysis method could not extract the gear fault feature due to the complexity of gear fault signal.
Fig. 23Envelope analysis result of the signal as shown in Fig. 19
7. Conclusions
A CSDWVS method basing on second-order cyclostationarity is proposed in the paper by taking advantage of the relationship between second-order cyclostationarity and traditional WVS method. The main strength of CSWVS is its ability to represent the cyclostationary signals while reducing the masking effect of additive stationary noise. Both simulations and experiments show that CSWVS is a noise resistant time frequency analysis technique for extracting bearing and gear fault patterns, when bearing signals are under influences of random noise and gear vibrations.
References
-
White G. D. Introduction to Machine Vibration. DLI Engineering Corporation, 1997.
-
Chen A., Thomas R. Signal processing techniques for rolling element bearing spall size estimation. Mechanical Systems and Signal Processing, Vol. 117, 2019, p. 16-32.
-
Xiao L., Zhang X. H., Lu S. L., Xia T. B. A novel weak-fault detection technique for rolling element bearing based on vibrational resonance. Journal of Sound and Vibration, Vol. 438, 2019, p. 490-505.
-
Abboud D., Antoni J., Eltabach M. Angle\Time cyclostationarity in rolling element baring vibrations. Measurement, Vol. 75, 2015, p. 29-39.
-
Borghesani P., Pennacchi P. Application of cepstrum pre-whitening for the diagnosis of bearing faults under variable speed conditions. Mechanical Systems and Signal Processing, Vol. 36, 2013, p. 370-384.
-
Hartono D., Halim D., Roberts G. W. Gear fault diagnosis using an improved reassigned smoothed pseudo Wigner-Ville distribution. Cogent Engineering, Vol. 5, 2018, p. 1436928.
-
Singru P., Krishnakumar V., Natarajan D., et al. Bearing failure prediction using Wigner-Ville distribution, modified Poincare mapping and fast Fourier transform. Journal of Vibroengineering, Vol. 20, 2018, p. 127-137.
-
Tang G. J., Pang B., He Y. L. Rotating machinery fault diagnosis method based on ITD and Wigner-Ville distribution. China Measurement and Test, Vol. 41, 2015, p. 85-88.
-
Sharma R. R., Pachori R. B. Improved eigenvalue decomposition-based approach for reducing cross-terms in Wigner-Ville distribution. Circuits Systems and Signal Processing, Vol. 37, 2018, p. 3330-3350.
-
Gaikwad C. J, Sircar P. Bispectrum-based technique to remove cross-terms in quadratic systems and Wigner-Ville distribution. Signal, Image and Video Processing, Vol. 12, 2018, p. 703-710.
-
Wu Y. S., Li X. K. Elimination of cross-terms in the Wigner-Ville distribution of multi-component LFM signals. Let Signal Processing, Vol. 11, 2017, p. 657-662.
-
Zhang T. Q, Quan S. R, Qiang X. Z, et al. Time-frequency analysis method based on multi-scale Chirplet sparse decomposition and Wigner-Ville Transform. Journal of Electronics and Information Technology, Vol. 39, 2017, p. 1333-1339.
-
Khan N. A., Sandsten M. Time-frequency image enhancement based on interference suppression in Wigner-Ville distribution. Signal Processing, Vol. 127, 2016, p. 80-85.
-
Pachori R. B., Nishad A. Cross-terms reduction in the Wigner-Ville distribution using tunable-Q wavelet transform. Signal Processing, Vol. 120, 2016, p. 288-304.
-
Cheng F. B., Tang B. P., Zhong Y. M. A method to suppress cross-terms of Wigner-Ville distribution using ASTFT spectrum. Journal of Electronics and Information Technology, Vol. 30, 2008, p. 2299-2302.
-
Zhao Z. H, Wang W. Y. Simulation of method to eliminate cross-term in Wigner distribution based on matching pursuits in time-frequency domain. Journal of Beijing Jiao Tong university, Vol. 34, 2010, p. 81-85.
-
Abboud D., Antoni J., Eltabach M., et al. Deterministic-random separation in nonstationary regime. Journal of Sound and Vibration, Vol. 362, 2016, p. 305-326.
-
Antoni J., Randall R. B. A stochastic model for simulation and diagnostics of rolling element bearings with localized faults. Journal of Vibration and Acoustics-Transactions of the ASME, Vol. 125, 2003, p. 282-289.
-
Antoni J. Cyclic spectral analysis of rolling-element bearing signals: facts and fictions. Journal of Sound and Vibration, Vol. 304, 2007, p. 497-529.
-
Moshrefzadeh A., Fasana A. The Autogram: An effective approach for selecting the optimal demodulation band in rolling element bearings diagnosis. Mechanical Systems and Signal Processing, Vol. 105, 2018, p. 294-318.
-
Elia G. D., Cocconcelli M., Mucchi E., et al. Combining blind separation and cyclostationary techniques for monitoring distributed wear in gearbox rolling bearings. Proceedings of the Institution of Mechanical Engineers Part e-Journal of Process Mechanical Engineering, Vol. 231, 2017, p. 1113-1128.
-
Zakaria F. A., Maiz S., Badaoui M., et al. First-and second-order cyclostationary signal separation using morphological component analysis. Digital Signal Processing, Vol. 58, 2016, p. 134-144.
-
Kebabsa T., Ouelaa N., Antoni J., et al. Experimental study of a turbo-alternator in industrial environment using cyclostationarity analysis. International Journal of Advanced Manufacturing Technology, Vol. 81, 2015, p. 537-552.
-
Antoni J., Bonnardot F., Raad A., et al. Cyclostationary modeling of rotating machine vibration signals. Mechanical Systems and Signal Processing, Vol. 18, 2014, p. 1285-1314.
-
Randall R. B., Antoni J., Chobsaard S. The relationship between spectral correlation and envelope analysis in the diagnostics of bearing faults and other cyclostationary machine signals. Mechanical Systems and Signal Processing, Vol. 15, 2001, p. 945-962.
About this article

The research is supported by the National Natural Science Foundation (approved grant: U1804141) and the Key Science and Technology Research Project of the Henan Province (approved grant: 192102210105).
