Abstract
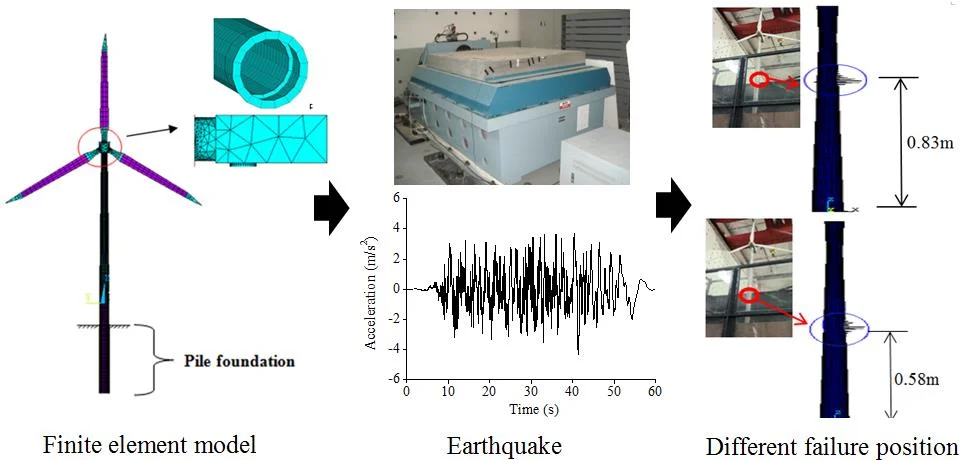
Compared with onshore wind turbine, the offshore wind turbine is more easily destroyed influenced by the complicated conditions at sea. In this study, a refined finite element model of offshore wind turbine in consideration of the soil-structure interaction is built. The dynamic response of the wind turbine tower in different water depths is investigated; then the weak positions of the wind turbine tower under earthquake is determined. We found that the water pressure on one side of the inflow face of pile foundation is the greatest; as the rate of flow increases, the negative water pressure on the contact surface increased more than the positive water pressure. The maximum displacement of the structure influenced by dynamic water pressure is located at the tower top, the maximum equivalent stress strain is located at two-thirds of the tower height, and the maximum bending moment appears at the bottom of the tower. When the water depth increases from 0 m to 5 m, the displacement and bending moment of wind tower structure increased by 29 % and 25 % respectively under the influence of dynamic water pressure; thus the influence of dynamic water pressure on the dynamic response of the structure should be paid attention to. Finally, the shaking table test of the wind turbine is conducted; the test results are compared with the numerical simulation results, and feasibility of the numerical simulation method was verified.
Highlights
- The influence of horizontal displacement on the pressure distribution of the contact surface between the flow field and the structure could be ignored.
- As the water depth increases, the bending moment and displacement increase rapidly.
- The maximum displacement of the structure was located at the tower top, and the maximum equivalent stress and strain were located at the same position.
- The buckling positions of the wind turbine in different water depths are different
1. Introduction
Wind turbine is a typical variable-section, variable-diameter, tall and flexible thin-walled cantilever structure. The heavy top and asymmetry make the structure more vulnerable to seismic action. Compared with onshore wind turbine, the offshore wind turbine is more easily destroyed influenced by the complicated conditions at sea. Due to the characteristics of submarine surface mud layer, the interaction between the foundation and submarine mud layer needs to be considered. In addition, China is in the earthquake-prone zone of the Eurasian continental plate, and the frequency of earthquakes is high; as a result, the problem of seismic resistance could not be ignored. At present, in the seismic resistance design of China's offshore engineering structures, most of the studies only consider the dynamic interaction between foundation and soil, however, the joint actions of foundation and structure are obviously inadequate.
The calculation considering water-structure dynamic interaction has two methods in general: added water mass method and fluid-solid coupling analysis method [1]. Different methods are adopted to calculate dynamic water pressure in different countries; as a result, the conclusions obtained are also inconsistent. Morison et al. [2] proposed to use Morison equation to calculate wave force in 1950. Chen [3] adopted finite difference and finite element methods to study the influence of dynamic water pressure on vertical cylindrical structures under seismic action. Chopra et al. [4] and Liaw et al. [5] proposed an effective method for calculating the added mass of moving water on the tower structure under horizontal seismic action. Chen et al. [6], Zhu et al. [7], and Lai et al. [8] used Morison equation to study the seismic response of deep-water bridge piers in consideration of the interaction between water and structure. Zhang et al. [9] pointed out that there was a large difference between the calculation results of Chinese and Japanese bridge seismic codes in the calculation of the dynamic water pressure of deep-water bridge piers during an earthquake. Liu et al. [10] established a fluid control equation for circular hollow bridge piers based on the radiation wave theory, and derived an analysis formula for the additional dynamic water pressure in the inner water of circular hollow bridge piers. Huang et al.[11, 12] used Morison equation and the radiation wave theory respectively to establish a method for calculating dynamic water pressure, and pointed out that the effect of dynamic water pressure not only changed the dynamic characteristics of bridge piers but also increased the seismic response of bridge piers. Tanabe et al. [13] conducted dynamic analysis of large wind turbine tower under the combined effect of vibration and seismic loads, and found that the bending moment of the tower body under the action of rare earthquakes exceeded the ultimate bending moment. However, wind turbine belongs to a new energy structure developed in recent years; at present, there are many researches on the influence of dynamic water pressure on pier structure under earthquake, while there are less researches on the influence of dynamic water pressure on the seismic dynamic response of wind turbine considering the influence of pile-soil interaction through the three-dimensional refined model.
For this reason, we established a refined three-dimensional finite element model for wind turbine in reliance on a real project structure, and studied the influence of dynamic water pressure on the seismic dynamic response of the wind turbine tower. Finally, we designed an indoor wind turbine model based on the similarity theory, and conducted comparative analysis of the experimental results and numerical simulation results based on shaking table test.
2. Finite element model of the wind turbine
2.1. Establishment of the model
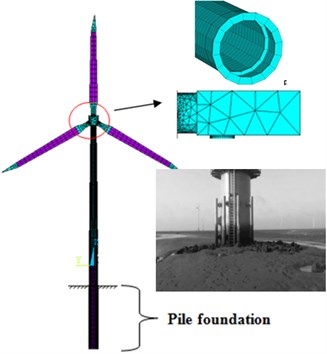
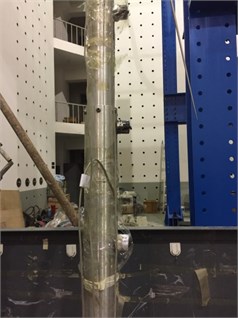
A real offshore wind turbine project was selected as the research object. The refined finite element model of the wind turbine tower was established through ANSYS software. The wind turbine was roughly divided into three parts, namely the upper structure (nacelle and rotor), drum and pile foundation. The pile foundation, drum (including the flanges connecting the sections) and blades are all adopt shell element; the nacelle and hub adopt solid element; the connection between the solid element and the shell element is realized through common nodes. The waters around piles are simulated by using added mass; the interaction between pile foundation and soil was simulated by using spring element. The site category was Class III, and the earthquake fortification intensity was 7 degrees. The height of the hub was 86m and the diameter of the rotor was 115 m. The tower, simulated by using Q345C steel, is a variable-section and variable-wall-thickness cylindrical structure; the outer diameter was 3.07-4.5 m, and the wall thickness was 18mm~50mm. The total weight of the top structure was 1957.16k N. The display resolution is 1024×768; the number of DOF is 6; there are 38330 elements and 61328 nodes. The finite element model of the wind turbine is shown in Fig. 1.
According to the geological exploration data, the average equivalent shear wave velocity of each soil layer within 20 m below the ground was 168 m/s and 167 m/s respectively. The parameters of the soil in each layer were shown in Table 1.
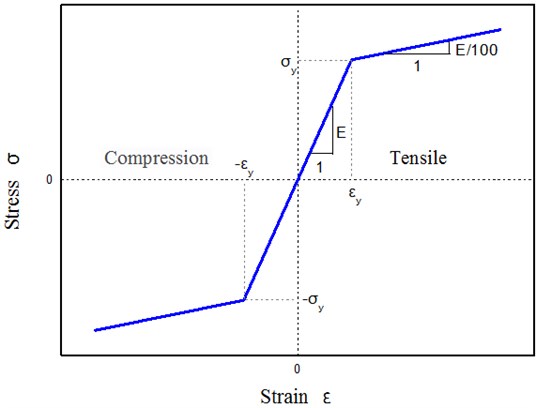
The yield strength of the material 345 MPa, modulus of elasticity 2.06×10¹¹ Pa, and Poisson ratio 0.3. The stress-strain relations of steels adopt the bilinear model recommended in Japanese Standard Specification for Highway Bridges [14], as shown in Fig. 2. This curve simplifies the plastic stage and enhanced stage of the material into a diagonal line. The corresponding elasticity modulus was /100.
Fig. 1Finite element model of wind turbine
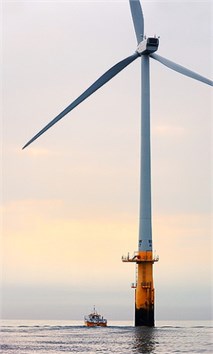
a) On-site wind turbine
b) Nacelle and hub
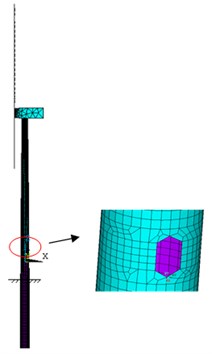
c) Wind turbine door
Table 1Soil layers and design parameters
No | Type | Soil layer thickness (m) | Physical indicators for natural state | Internal friction angle (°) | Cohesion (kPa) | Compression modulus (MPa) | ||
Dry density (g/cm3) | Saturated density (g/cm3) | Void ratio | ||||||
1 | Silty sand | 6.5 | 1.59 | 2.73 | 0.72 | 32.0 | 3.8 | 11.92 |
2 | Silty soil | 1.0 | 1.61 | 2.70 | 0.68 | 30.7 | 9.5 | 11.42 |
3 | Silty soil | 3.0 | 1.53 | 2.70 | 0.77 | 30.6 | 8.3 | 11.26 |
4 | Silty soil | 5.5 | 1.46 | 2.71 | 0.86 | 27.3 | 11.8 | 7.43 |
5 | Silty soil | 4.0 | 1.53 | 2.70 | 0.77 | 30.6 | 8.3 | 11.26 |
6 | Silty sand | 5.5 | 1.54 | 2.69 | 0.75 | 32.6 | 3.7 | 11.85 |
7 | Silty clay | 3.0 | 1.59 | 2.73 | 0.72 | 18.1 | 41.0 | 5.07 |
8 | Silty soil with silty clay | 7.5 | 1.51 | 2.71 | 0.80 | 27.0 | 9.0 | 7.70 |
9 | Silty sand | 4.0 | 1.68 | 2.69 | 0.62 | 32.0 | 5.0 | 13.08 |
Fig. 2Bilinear model for steel stress-strain curve
In the dynamic analysis of the structure, whether to consider the damping of the structure or not has a great influence on the dynamic response of the structure. This article adopts Rayleigh proportional damping to determine the damping of the structure. The damping matrix was linearly composed of the mass damping matrix and the stiffness damping matrix , and determined according to Eq. (1).
where is mass damping coefficient (alpha); is stiffness damping coefficient (beta).
The relation between the damping ratio and frequency of the structure was shown in Eq. (2).
The frequency of the structure was related to the mass and stiffness of the structure. To make the calculation easier, the circular frequency that contributes much to the vibration of the structure may be taken. Therefore, the mass damping coefficient and stiffness damping coefficient can be calculated according to Eq. (3).
where is circular frequency of fundamental frequency; is circular frequency of the mode that contributes much to structure vibration in the observed direction.
The wind turbine was a steel structure, and the damping ratio of the structure was taken as 0.02, i.e. . The mass damping coefficient and stiffness damping coefficient are 0.044 and 0.0089 respectively. Therefore, the damping of the structure was shown in Eq. (4).
2.2. Selection of seismic waves
According to the Code for Seismic Design of Buildings (GB 50011-2010) [15], the peak acceleration used in the time history analysis is shown in Table 2.
Table 2Peak acceleration used in time history analysis (cm/s2)
6 degrees | 7 degrees | 8 degrees | 9 degrees | |
Frequent earthquake | 18 | 35 (55) | 70 (110) | 140 |
Rare earthquake | 125 | 220 (310) | 400 (510) | 620 |
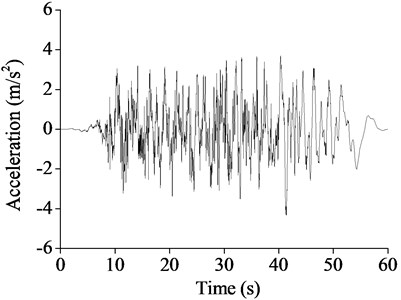
The seismic wave was selected in Japanese seismic code (Table 3), and adjusted according to the peak acceleration values 220 Gal and 400 Gal. The adjusted acceleration and velocity time histories were shown in Fig. 3.
Table 3Seismic wave in Japanese seismic code
Code of seismic wave | Name of seismic wave | Earthquake magnitude | Epicenter distance (km) |
T1-III-1 | Earthquake at the middle of the Sea of Japan in 1983 | 7.7 | 110 |
Fig. 3T1-III-1 seismic wave acceleration and velocity time histories
2.3. Pile-Soil interaction
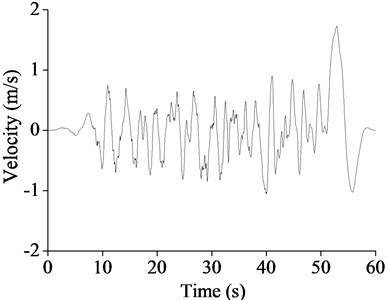
The - curve method was adopted to simulate the soil layers, and the pile-soil calculation model was shown in Figure 4. Horizontal and vertical springs were arranged in the X, Y and Z directions, and the distance between two adjacent vertical springs was 1.0 m.
Fig. 4Pile-soil calculation model
3. Influence laws of current velocity on wind turbine structure
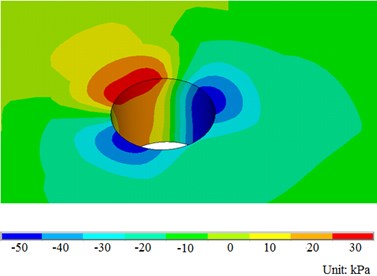
The location of the wind turbine which is near the shore and high beach is an obvious slow-flow area, and the mainstream direction of the tidal current is basically perpendicular to the shoreline. The current is reciprocating flow, and the maximum velocity is 2.0 m/s. Taking the velocity 2.0 m/s of ocean current as an example, the uniform flow field is simulated by applying horizontal velocity along the X direction. Assuming that the pile foundation is fixed, the distribution of structural pressure field and velocity field is calculated as shown in Fig. 5.
As shown in Fig. 5, the existence of pile foundation and submarine ground affects the velocity distribution of uniform velocity flow field, the pressure on one side of the inflow face of pile foundation is the greatest, and the pressure on both sides is the least. The water pressure of the pile foundation near the seabed is greater than that near the sea surface, and this distribution is consistent with the actual situation.
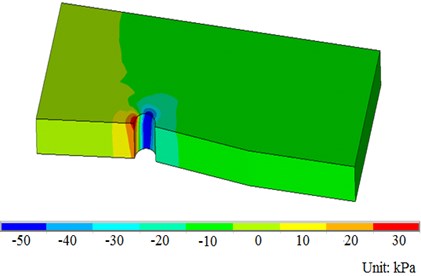
The pressure distribution rule of the different flow velocity fluids on contact surface is shown in Figs. 6 and 7.
Fig. 5Diagram of flow field distribution
a) Pressure distribution around pile foundation
b) Pressure distribution in flow field
Fig. 6Pressure field distribution diagram
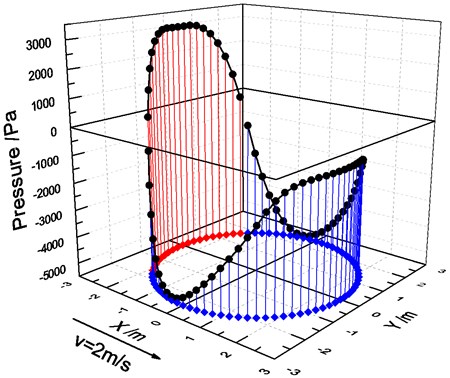
Fig. 7Pressure distribution rules of different flow velocity fluids on contact surface
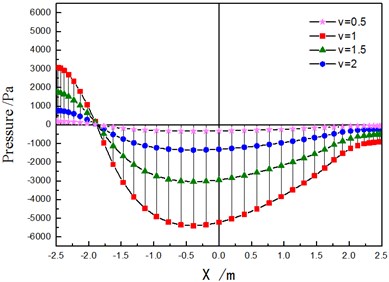
a) The pressure distributing along the diameter
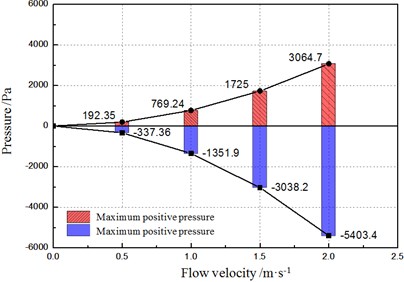
b) Maximum pressure changing with velocity
As shown in Figs. 6 and 7, local area section only in the direction of flow inlet is pressurized (pressure value is positive), and the rest is pulled. As the rate of flow increases, the maximum negative pressure on the contact surface of structure and fluid is greater than that of positive pressure.
Apply horizontal displacement in X direction and minus X direction to the top of pile foundation and calculate the distribution of pressure and velocity in flow field [20]. By comparing with the pile foundation, which is fixed condition, the influence of displacement of the pile foundation on the flow field was analyzed, as shown in Fig. 8.
Fig. 8Influence of displacement of the pile foundation on the flow field
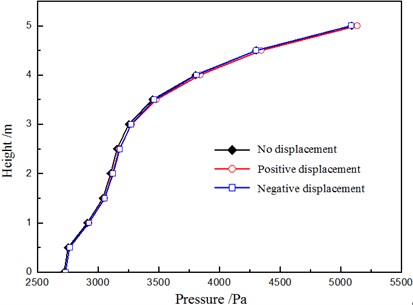
As shown in Figure 8, horizontal displacement of pile foundation has less influence on water pressure distribution of the contact surface, and the difference of the water pressure value is less than 1. Therefore, the influence of horizontal displacement on the pressure distribution of the contact surface between the flow field and the structure could be ignored.
4. Influence laws of dynamic water pressure on dynamic response
Next, we will analyze the influence laws of dynamic water pressure on seismic dynamic response of wind turbine tower, and water acted on structures in the form of additional mass. The seismic wave T1-III-1 was selected as input load, and the peak acceleration was 220 Gal. According to the measured tidal level data of the actual engineering location, the basic hydrological conditions were determined as shown in Table 4.
Table 4Basic hydrological condition
Types | Elevation (m) | Comment |
Mean sea level | 0.06 | |
Seabed surface | –2.0-0.2 | |
Extreme high tide level | 5.13 | Fifty years return period |
Extreme low tide level | –4.12 | |
Design high tide level | 3.02 | = 10 % |
Design low tide level | –3.06 | |
Mean tide level | 2.20 |
As shown in Table 4, the mean tide level is 2.2 m and the extreme high tide level is 5.13 m. Thus, in order to explore the effect of dynamic water pressure on the structure, combining with actual engineering conditions, we selected the water depths 0 m, 2 m and 5 m for the following study.
The variation rules of displacement, acceleration and bending moment values at different height of wind turbine tower were shown in Table 5.
As shown in Table 5, compared with no water condition, the maximum displacement caused by water depth 2.0 m only increased 0.073 m, the maximum acceleration increased 0.22 m/s2, and the maximum bending moment increased 3400 kN·m.
In order to further explore the influence of dynamic water pressure on wind turbine tower, the displacement and bending moment of the wind turbine tower structure in a depth 5 m were analyzed, as shown in Fig. 9.
Table 5Dynamic response of the wind turbine tower in water depths 0 m and 2 m
Height (m) | Displacement (m) | Acceleration (m/s2) | Bending moment (kN·m) | |||
No water | Water depth 2 m | No water | Water depth 2 m | No water | Water depth 2 m | |
75 | 1.278 | 1.351 | 6.904 | 7.126 | 7870 | 8509 |
65 | 1.049 | 1.051 | 5.702 | 5.718 | 19420 | 19490 |
55 | 0.793 | 0.794 | 5.243 | 5.297 | 31070 | 31170 |
45 | 0.588 | 0.589 | 6.013 | 6.109 | 42870 | 42990 |
35 | 0.399 | 0.400 | 5.925 | 6.042 | 53650 | 53770 |
25 | 0.254 | 0.254 | 4.944 | 5.038 | 64650 | 64760 |
15 | 0.151 | 0.151 | 3.643 | 3.741 | 77800 | 77890 |
0 | 0.050 | 0.050 | 1.619 | 1.689 | 93439 | 100400 |
–15 | 0.004 | 0.004 | 0.202 | 0.224 | 119200 | 122600 |
–45 | 0 | 0 | 0 | 0 | 67 | 68 |
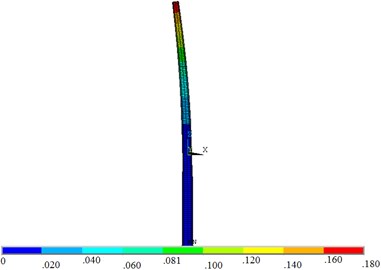
Fig. 9Displacement and bending moment of the wind turbine tower structure in different water depths
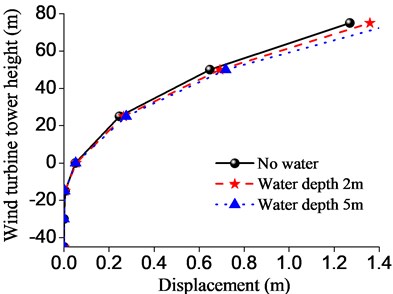
a) Displacement
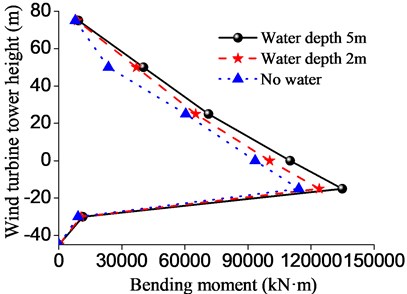
b) Bending moment
As shown in Figure 9, when the water depth is 5.0 m, the maximum displacement of the wind turbine tower top is 1.48 m, increased by 0.12 m than that of water depth 2.0 m, and increased by 0.21 m than that of water depth 0m, however, the maximum displacement does not exceed the limit of the wind turbine tower. At a soil depth of about 15.0 m, when the water depth is 2 m and 5 m, the maximum bending moment values of the wind turbine tower were respectively 122600 kN·m and 123900 kN·m, increased by 3 % and 4 % than that of water depth 0 m respectively. As the foundation burial depth increases, the bending moment and displacement will be reduced rapidly. When the water depth of the wind turbine tower increased from 0 m to 5 m, the displacement and bending moment of the wind turbine tower increased 29 % and 25 % under earthquake. The reason is that when the dynamic water pressure is considered in the form of additional mass, the mass of water leads to the increase of partial quality of pile foundation. Thus, when the water depth increases, the dynamic water pressure has obvious influence on the dynamic response of the structure, and attention should be paid to engineering protection.
When the water depth is 5.0 m, the dynamic water pressure has the greatest influence on the wind turbine tower. In order to determine the position where the maximum displacement, equivalent stress and the maximum equivalent strain of the wind turbine tower appear, the maximum displacement, equivalent stress and the maximum equivalent strain contours were shown in Fig. 10.
As shown in Fig. 10, the maximum displacement of the structure was located at the top of the tower, and the maximum equivalent stress and strain were located at the same position in the middle of the tower, which was about two-thirds of the height of the tower height. Therefore, some measures should be taken in the structure design of wind turbine tower according to the position where the maximum value appears.
Fig. 10Contours of the wind turbine tower
a) Displacement
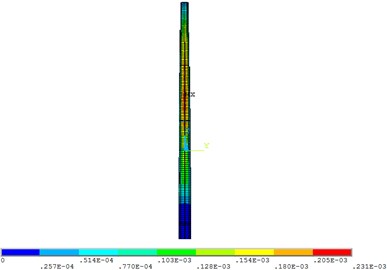
b) Equivalent strain
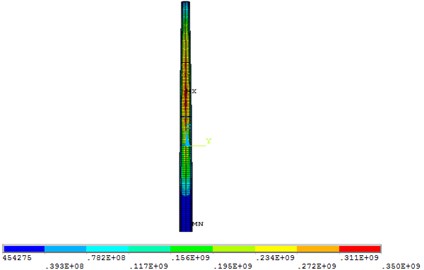
c) Equivalent stress
5. Shaking table test of wind turbine
5.1. Test equipment
Based on the actual wind turbine tower structure and the numerical simulation results of the structure, a reduced indoor wind turbine model was taken as the research object, and the numerical simulation results were verified by the indoor shaking table test. The main technical indicators of the shaking table test equipment include rated working frequency (40 Hz), the maximum acceleration (20 m/s2), the maximum test load (5000 kg) and dimensions of the shaking table (1.5×1.5 m), as shown in Fig. 11.
Fig. 11ES-15 hydraulic shaking table
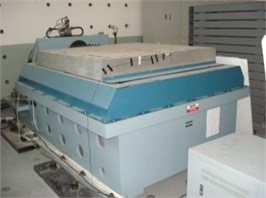
a) Shaking table

b) Controller of shaking table
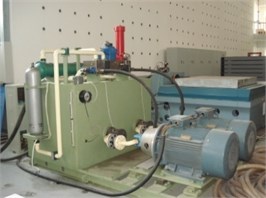
c) Hydraulic oil pump
5.2. Modeling
Considering the influence of soil and water on the dynamic response of the structure, we prepared a steel structure model box of 2.0×1.0×1.5 m. The bottom of the model box could be connected to the shaking table by bolts. The side surface of the model box was transparent (PMMA panel) to better observe the model and vibration response process. According to the test conditions, the geometric similarity coefficient of the structure = 1/50 was determined. The overall height of the model was about 2.5 m (including drum and pile foundation), as shown in Fig. 12. 2a12 aluminum alloy, which was lighter, was selected as the material of the tower. Its modulus of elasticity is 73 MPa, and density is 2780 kg/m3. The similarity ratio relevant with this test model was shown in Table 6.
Fig. 12Test model
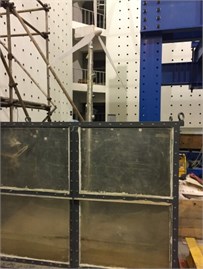
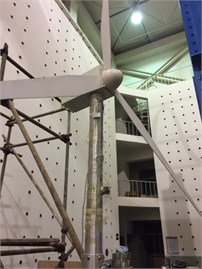
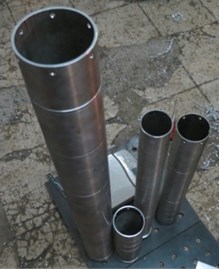
Table 6Similarity ratio of the wind turbine model
Item of similarity | Similarity ratio | |
Steel | Aluminum alloy | |
Geometric dimension | 1/50 | 1/50 |
Density | 1 | 2,780/7,850 |
Modulus of elasticity | 1 | 73/206 |
Stiffness | 1/504 | 1/504 |
Horizontal acceleration | 50 | 50 |
Gravity acceleration | 1 | 1 |
Input of ground motion duration | 1/50 | 1/50 |
Input of ground motion peak | 50 | 50 |
Natural vibration frequency | 50 | 50 |
Natural vibration cycle | 1/50 | 1/50 |
Displacement response | 1/50 | 1/50 |
Acceleration response | 50 | 50 |
Velocity response | 1 | 1 |
Bending stress | 1 | 73/206 |
Strain | 1 | 1 |
Fig. 13Schematic diagram of acceleration sensor layout
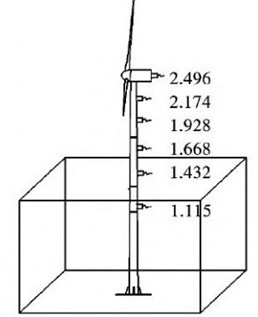
Acceleration sensors were arranged at different heights of the structure to measure the accelerations, as shown in Fig. 13.
5.3. Test results
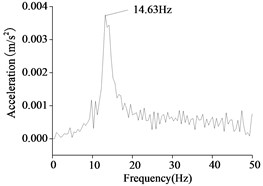
The first order natural frequency is obtained by frequency sweep test in water depths 0 m, 2 m and 5 m, as shown in Fig. 14.
Fig. 14Natural frequencies in different depths
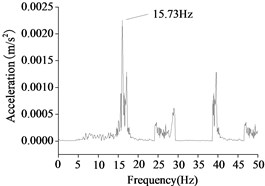
a) Water depth 0 m
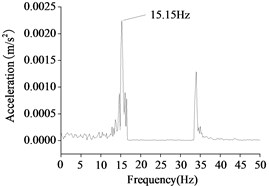
b) Water depth 2 m
c) Water depth 5 m
As shown in Figure 14, the natural vibration frequency decreases gradually with the increasing of water depth. The natural frequency of the wind turbine could be obtained by the frequency sweep of the shaking table test. If the excitation frequency of the shaking table test is close to the natural frequency of the structure, the structure will produce resonance even with a small excitation. There are four times resonances of the wind turbine in water depth 0 m, and the first resonance is the first frequency which is 15.73 Hz. There are two times resonances of the wind turbine in water depth 2 m, and the first frequency which is 15.15 Hz. There are one time resonance of the wind turbine in water depth 5 m, and the first frequency which is 14.63 Hz. By similarity coefficient transformation, we found that the maximum deviation of the first frequencies between the experimental results and the numerical results are 10 %.
Figure 15 presented the buckling failure position of the test model in different water depths under earthquake when the seismic intensity is level 9.
Fig. 15Buckling failure position of the test model
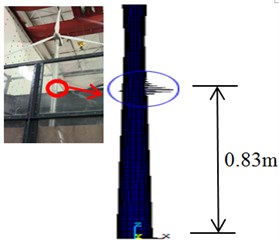
a) Water depth 0 m
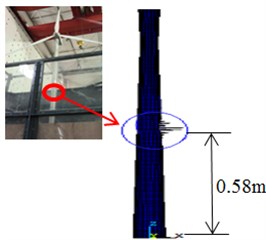
b) Water depth 2 m
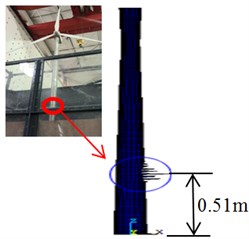
c) Water depth 5 m
As shown in Fig. 15, the buckling positions of the wind turbine in different water depths are different, and the height of the buckling position decreases with the increasing of water depth height. The destruction of the wind turbine appears at the height of 0.83 m when the water depth is 0 m, the destruction of the wind turbine appears at the height of 0.58 m when the water depth is 2 m, and the destruction of the wind turbine appears at the height of 0.51 m when the water depth is 5 m. Consequently, the buckling failure position of the test model is clear in different water depths, and it avoids blindness of designers in structure designing and optimal results can be obtained efficiently.
The peak accelerations (positive and negative) along the height direction of the wind turbine tower were measured and compared with the numerical simulation results, as shown in Fig. 16.
Fig. 16Comparison between numerical simulation results and test results
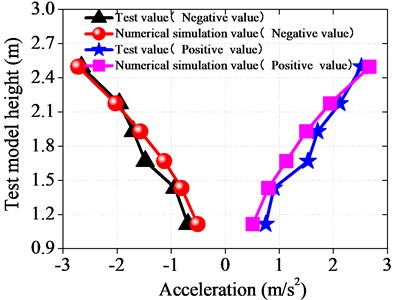
As shown in Fig. 16, the test results and numerical simulation results agreed well with each other in trend. As the height increased, the peak value of earthquake acceleration along the height direction of the wind turbine tower showed linear increase. The difference between the test monitoring value and the numerical simulation value at the same monitoring point was not large, mostly not more than 20 % within the allowable range of error, so the above numerical simulation data was credible. There are several factors that may cause errors. First, the monitoring instruments had measurement error; secondly, there will be attenuation of the connecting wire signal; thirdly, the model is simplified in numerical simulation. Thus, there are differences between the experimental test and the numerical simulation conditions. However, the errors are within the acceptable range.
6. Conclusions
1) The water pressure on one side of the inflow face of pile foundation is the greatest; as the rate of flow increases, the negative water pressure on the contact surface increased more than the positive water pressure. The influence of horizontal displacement on the pressure distribution of the contact surface between the flow field and the structure could be ignored.
2) As the water depth increases, the bending moment and displacement increase rapidly. When the water depth of the wind turbine tower increased from 0m to 5m, the displacement and bending moment of the wind turbine tower increased 29% and 25% under earthquake. Thus, when the water depth increases, the dynamic water pressure has obvious influence on the dynamic response of the structure, and attention should be paid to engineering design.
3) The maximum displacement of the structure was located at the tower top, and the maximum equivalent stress and strain were located at the same position, which was about two-thirds of the height of the tower. Therefore, some measures should be taken in the structure design of wind turbine tower according to the position where the maximum value appears.
4) The shaking table test of the wind turbine was conducted and the acceleration test values along the height direction of the wind turbine tower were compared with the numerical simulation values. The peak acceleration values show a linear increase and the test values agree well with the numerical simulation values, which verifies the correctness of the established model and the numerical simulation method.
References
-
Olson L. G., Bathe K. J. A study of displacement based fluid FE for calculating frequencies of fluid and fluid-structure systems. Nuclear Engineering and Design, Vol. 76, 1983, p. 137-151.
-
Morison J. R., O’Brien M. P., Johnson J. W., Schaaf S. A. The force exerted by surface wave on piles. Petroleum Transactions, AIME, Vol. 1950, 189, p. 149-154.
-
Chen Bang-Fuch The significance of earthquake-induced dynamic forces in coastal structures design. Ocean Engineering, Vol. 22, Issue 4, 1995, p. 301-315.
-
Chopra A. K., Goyal A. Simplified earthquake analysis of intake-outlet towers. Journal of Structural Engineering, Vol. 117, Issue 3, 1991, p. 767-788.
-
Liaw C. Y., Chopra A. K. Dynamic of towers surrounded by water. Earthquake Engineering and Structural Dynamics, Vol. 3, 1974, p. 33-49.
-
Chen Guoxing, Bai Degui, Wang Zhihua Seismic response analysis of large scale bridge pier supported by pile foundation considering the effect of wave and current action. Earthquake Engineering and Engineering Vibration, Vol. 28, Issue 10, 2008, p. 171-177.
-
Gao Xuekui, Zhu Xi Hydrodynamic effect on seismic response of bridge pier in deep water. Journal of Beijing Jiaotong University, Vol. 30, Issue 2, 2006, p. 56-64.
-
Lai Wei, Wang Junjie, Hu Shide Earthquake induced hydrodynamic pressure on bridge pier. Journal of Tongji University, Vol. 32, Issue 1, 2004, p. 1-5.
-
Zhang Guoming, Song Bo Effect of hydrodynamic pressure on performance -based design of a deepwater bridge. Journal of University of Science and Technology Beijing, Vol. 31, Issue 9, 2009, p. 1087-1090.
-
Liu Zhenyu, Li Qiao, Zhao Chanhui, Zhuang Weilin Earthquake-induced added hydrodynamic pressure on circular hollow piers in deep water. Journal of Southwest Jiaotong University, Vol. 2, Issue 4, 2008, p. 200-205.
-
Huang Xin, Li Zhongxian Influence of hydrodynamic pressure on bridge piers in deep water. Civil Engineering Journal, Vol. 44, Issue 1, 2011, p. 65-68.
-
Huang Xin, Li Zhongxian Nonlinear seismic response analysis of bridge pier in deep water under hydrodynamic pressure influence. Technology for Earthquake Disaster Prevention, Vol. 5, Issue 3, 2010, p. 352-357.
-
Tanabe T., Iida Y., Masuda H., et al. Afundamental study on dynamic characteristics and the seismic design of wind turbine generator systems. NKK Technical Report-Japanese Edition, 2002, p. 64-69.
-
Specifications for Highway Bridges.·Part V: Seismic Design. 1st Ed. Japan Road Association, 2002.
-
GB 50011-2010. Code for Seismic Design of Buildings, 2015.
-
Mou B., He B. J., Zhao D. X., Chau K. W. Numerical simulation of the effects of building dimensional variation on wind pressure distribution. Engineering Applications of Computational Fluid Mechanics, Vol. 11, Issue 1, 2017, p. 293-309.
About this article

This work is financially supported by the National Key R&D Program of China (2017YFC1500404), National Natural Science Foundation of China (Grant No. 51708516), the Young Elite Scientists Sponsorship Program by CAST (2018QNRC001), and the Fundamental Research Funds for the Central Universities (FRF-BD-19-004A).
