Abstract
The spectrum correlation (SC) is an effective fault feature extraction method for rolling bearing which is based on second order cyclic statistic. However, the effectiveness of SC will be compromised greatly when the rolling bearing fault feature signal is interfered by noise. To solve the problem, the SC method is improved and the improved spectrum correlation (ISC) method is proposed in the paper, and the noise-resistance virtue of ISC compared with SC is verified through the accelerated fatigue and compound fault test of rolling element bearing. Besides, the vibration signal of fault rolling bearing takes on modulation phenomenon, and extracting the fault characteristic frequency (FCF) or cyclic modulation frequency (CMF) is enough for the purpose of fault diagnosis, and the modulation frequency is neglected usually. However, the extraction result of ISC is not intuitive enough because it extracts the FCF and modulation frequency with its harmonic synchronously. To improve the intuitive feature extraction effect of ISC, the ISC method is improved further in the paper and the integrated improved spectrum correlation (IISC) is proposed which would only extract the FCF or CMF, so much clear and better extraction effectiveness could be obtained by IISC method, and the effectiveness and better fault extraction results by applying IISC method on vibration data of rolling bearing accelerated fatigue and compound fault test are also presented.
Highlights
- The disadvantage of spectrum correlation (SC) is improved when the vibration signal of rolling bearing is buried by strong background noise
- The improve spectrum correlation naming ISC is proposed in the paper which has the virtue of noise-resistance
- The ISC is further improved and the integrated ISC naming IISC is proposed in the paper which has the virtue of much more intuitive
1. Introduction
The failure of rolling element bearing represents a high percentage of breakdowns in rotating machinery [1], and it is meaningful to study effective fault diagnosis method of it in ensuring the reliable running of machinery. In recent years, amounts of new methods relating to fault diagnosis of rolling bearing or new methods relating to improve the calculation speed of feature extraction of rolling bearing has been arising. A new fault diagnosis method of rolling bearing based on principal component analysis and broad learning system was proposed in paper [2]. In paper [3], the ensemble empirical mode decomposition and multi-scale fuzzy entropy were combined and used in feature extracting of motor bearing, and satisfactory results were obtained. A high-order differential mathematical morphology gradient spectrum entropy was proposed and used in rolling bearing fault damage degree identification [4]. Among the various kinds of methods, vibration analysis has been established as the most common and practical method for detecting rolling bearing defects [5], and it is verified that vibration parameters of rolling bearing are periodically time-varying, especially for those under failure situation, which implies second-order cyclostationarity [6-8]. Amount of literatures basing on the theory of cyclostationarity have been arisen and used in fault diagnosis of rotating machinery. A novel blind deconvolution method based on cyclostationarity and solved by means of an iterative eigenvalue decomposition algorithm was proposed in paper [9], and the superior capability of the proposed method to recover impulsive cyclostationary sources with respect to other blind deconvolution methods was revealed. A concise survey of the literature on cyclostationarity of the past 10 years was presented in paper [10]. Besides, the new trends and applications of cyclostationarity was also given in paper [10]. The probabilistic principal component analysis denoising and cyclic bispectrum are combined in fault diagnosis of rolling element bearing [11], and the effectiveness of the combined method was demonstrated by numerical simulation and experimental investigation of rolling element bearing with an outer race fault.
The SC basing on the second-order cyclostationarity is an effective time-frequency method, and it could reflect the time and frequency domain fault features simultaneously. The SC was applied in diagnosis of bearing faults in complex machinery such as aircraft engines [12], and better results were obtained. An improved SC method naming cyclic correntropy was proposed in paper [13] to deal with cyclostationary signals under impulsive noise environment based on kernel methods, and the effective application of the proposed method in frequency estimation was presented. However, the analysis results of SC would not be ideal when the vibration feature signal is interfered by strong background noise [14]. To solve the problem, this paper proposes an improved SC method naming as ISC which has virtue of noise-resistance over SC method. However, the extraction result of ISC is not intuitive enough because it extracts the FCF and modulation frequency with its harmonic synchronously. So the ISC method is further improved and the IISC method is proposed in the paper which has the advantage of more intuitive feature extraction results compared with ISC, because the IISC is only to extract the FCF or CMF and ignore the modulation frequency with its harmonics.
The organizational structure of the paper is as follows. The theories of SC, ISC and IISC are presented in Section 2. Section 3 is the rolling bearing accelerated fatigue experiment verifying the noise-resistance of ISC over SC. Besides, the intuitiveness of IISC is also presented in Section 3. Section 4 is the simulation showing the effectiveness and feasibility of the proposed ISC and IISC methods in diagnosis of bearing compound faults, and the corresponding experiment verification is given in Section 5. Discussion and conclusion are presented in Section 6 and 7 respectively.
2. The theory of SC, ISC and IISC
2.1. SC
If the time-domain nth-order moment of any random signal remains unchanged according to time , then the signal is taken as nth order stationary. Similarly, if the n-order matrix of a random signal shows periodicity with respect to time , then the signal is defined as owning the property of cyclostationarity at th-order, and the cyclic frequency is the derivative of the period [15].
Definition 1: If the first order moment of signal satisfies the relationship as shown in Eq. (1), then the signal is defined as first-order cyclostationarity:
where represents the solving mean symbol.
Definition 2: Similar as definition 1, the autocorrelation function of the second-order cyclostationarity signal for any time should satisfy the relationship as shown in Eq. (2):
In Eq. (1) and (2), and represent the cyclic period and frequency respectively, and represents the autocorrelation symbol.
Replace Eq. (2) using Fourier series as following:
where represents Fourier coefficients.
Definition of SC: Apply Fourier transform on the cyclic autocorrelation function of any signal and the SC is obtained which could be represented by Eq. (4):
where represents spectral frequency.
Accordingly, the spectral coherence function between two different frequencies of any signal could be calculated using Eq. (5):
In the above equation, the symbol represents time-averaging operator and its concrete calculation equation is as following:
The absolute values of range from 0 to 1, that is:
The linear interdependence between two different spectral frequencies at and is proportional to value of . There must be existing non-zero value as to the cyclostationarity signal, and one of the cyclic frequencies is the interval between the two correlated components.
2.2. ISC
Suppose one sinusoidal signal is modulated by another sinusoidal signal whose expression is shown in Eq. (8), where and represents the frequencies of modulated signal and modulation signal:
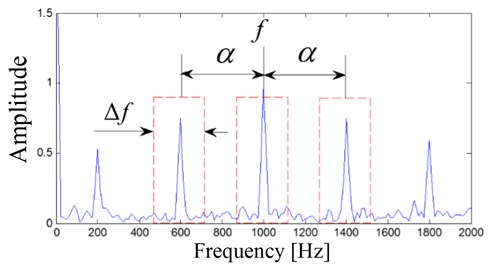
where represents the random white noise. The FFT spectral analysis result of the signal shown in Eq. (8) is presented in Fig. 1 where represents carrier frequency, and the frequencies of the modulation signal locate symmetrically from with the interval of cyclic frequency . Commonly, an ideal side band filter as shown in Fig. 1 (red dotted line) is constructed for filtering analysis of modulated and modulation signals.
Normally, the signal shown in Eq. (9) with a little noise could be gained by using the above filter:
where the filtered signal is represented by distributing in the frequency domain . The SC is calculated and used as an index to reflect the relationship among the three spectral components, and the calculation expression of SC is shown in Eq. (10):
where the complex envelope of filtered signal is represented by which could be calculated by using Eq. (11):
Fig. 1Diagram of band-pass filter
The Eq. (12) is used to calculate the relationship of and :
The Eq. (13) is used to substitute the SC as shown in Eq. (10) based on Eqs. (10)-(12):
To sum up, the SC could also be summarized as Eq. (14):
The SC between and could be calculated by using Eq. (15) based on the above equations and Fig. 1:
Analogically, the SC between and can be calculated as following:
The Eqs. (15) and (16) are multiplied and the ISC is obtained to evaluate the relationships among the three spectral components spaced by the cyclic frequency :
where represents the inner product of SC.
2.3. IISC
As can be seen from Eq. (17), ISC is a function of modulation frequency and modulated frequency . Normally, in the process of rolling bearing fault diagnosis, it is enough to extract the modulated frequency and ignore the modulated frequency with its harmonic components, so the ISC method is further improved, and IISC method is proposed here:
3. Rolling bearing accelerated fatigue experiment
From the installation to its full failure is a complex process, and there is safe and economical meaning to study the feature extraction method of rolling bearing early weak fault. The study object comes from the ABLT-1A bearing life-cycle accelerated test rig of Hangzhou bearing experimental center, and the test rig is shown in Fig. 2. Two test bearings (B12 and B14) are selected for analysis and the experiment details could be referred to literature [16]. The parameters and FCFs of the test bearings are shown in Table 1 and Table 2. The two bearings both occur pitting fault on the inner races and one of which is presents in Fig. 3.
Fig. 2Test rig
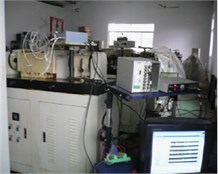
Fig. 3Inner race fault
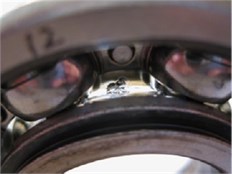
Table 1The parameters of the test bearing
Type | Ball number | Ball diameter (mm) | Pitch diameter (mm) | Contact angle | Motor speed (rmp) | Load (kN) |
6307 | 8 | 13.494 | 58.5 | 0 | 3000 | 12.744 |
Table 2The fault characteristic frequencies of the test bearing
50 | 19 | 102 | 246 | 153 |
The vibration data of B12 is analyzed firstly and the RMS over its whole life is shown in literatures [17, 18]. In the paper, the kurtosis of over the test bearings’ whole life is given, and the reason is that the kurtosis index is more sensitive than RMS to impulse signal when fault arises in rolling bearing. The kurtosis index of the B12 test bearing over its whole life is shown in Fig. 4 from which the kurtosis value changes suddenly at 2306th minute, and it means that complete failure of B12 occurs at 2306th minutes. Same as literature [7], the vibration data at 2297th minute is taken as the early weak fault stage and corresponding time-domain waveform of the vibration data at 2297th minute is shown in Fig. 5(a). Envelope demodulation (ED) is the common used method for analyzing rolling bearing vibration signal, and the corresponding envelope demodulation spectrum of the signal shown in Fig. 5(a) is shown in Fig. 5(b). However, the spectral lines are chaotic and any bearing fault feature could not be obtained based on Fig. 5(b). It is verified that the ED method would not work effectively on fault diagnosis of bearing’ early weak fault.
Fig. 4Kurtosis index of experimental bearing life cycle
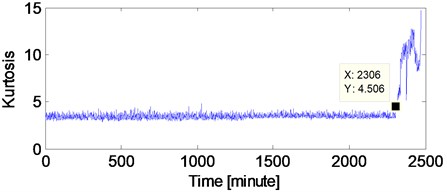
Fig. 5The time-domain waveform of the B12 vibration data at 2297th minute with the corresponding envelope demodulation spectrum
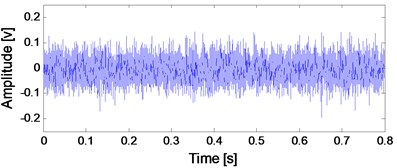
a) Time-domain waveform of the B12 vibration data at 2297th minute
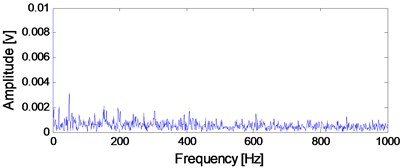
b) Envelope demodulation spectrum of the signal shown in Fig. 5(a)
Fig. 6SC analysis result of the signal shown in Fig. 5(a)
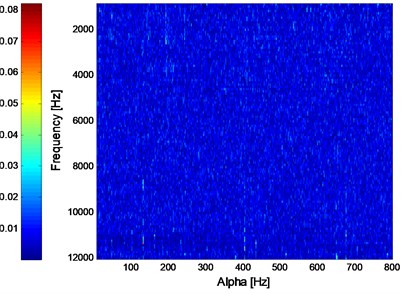
Fig. 7ISC analysis result of the signal shown in Fig. 5(a)
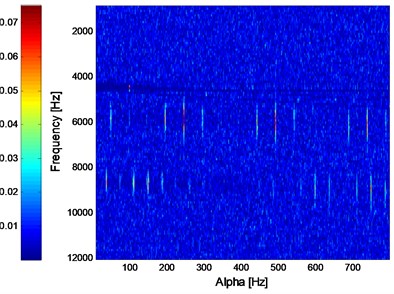
Apply SC and ISC on the signal as shown in Fig. 5(a) and the analysis results are presented in Fig. 6 and Fig. 7 respectively. It could be observed that the inner race FCF of B12 with its harmonic could not be identified in Fig. 6, so it is verified that SC would not work effectively when the fault feature of rolling bearing vibration signal is interfered by strong background noise. Apply ISC on the signal shown in Fig. 5(a) and the analysis result is shown in Fig. 7, and it could be observed in Fig. 7 that not only the inner race FCF of B12 with its harmonic could be extracted, but also the natural frequency (roughly 6000 Hz) of the system is extracted. So the noise-resistance advantage of ISC over SC is verified.
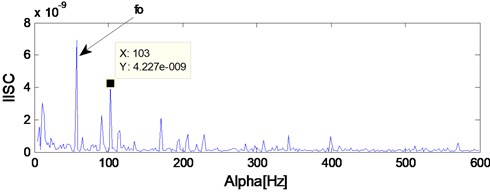
The IISC analysis result of the signal shown in Fig. 5(a) is shown in Fig. 8. It is evident that the modulated frequency (Inner race FCF) and the modulation frequency with its harmonic (Rotating frequency) are both extracted as being presented in Fig. 6 and Fig. 7. The intuitive advantage of IISC over ISC could not be expressed in this case, and the intuitive advantage of IISC is very useful in case of compound fault arising in rolling bearing which is verified in the following sections.
Fig. 8IISC analysis result of the signal shown in Fig. 5(a)
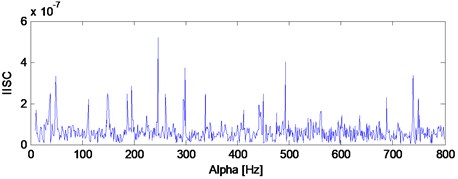
The analysis process of the vibration data of B14 is same as B12 and the kurtosis index over its whole life is shown in Fig. 9. Same as literature [18], the vibration data at 970th minute is taken as the early weak fault stage of B14, and its corresponding time-domain waveform with the ED analysis result are shown in Fig. 10(a) and Fig. 10(b) respectively. The SC, ISC and IISC analysis results of the signal shown in Fig. 10(a) are presented in Fig. 11, Fig. 12 and Fig. 13 respectively. Both of the SC and ISC methods could not extract the inner race FCF of rolling bearing clearly based on Fig. 11 and Fig. 12. However, the inner race FCF (245 Hz) of rolling bearing still could be identified in Fig. 13 and the intuitive advantage of IISC over ISC could be expressed in this case. It should be noted here that the deviation between 245 Hz and theoretical FCF is due to the installation accuracy of rolling bearings and other reasons.
Fig. 9Kurtosis index of the B14 test bearing over its whole life
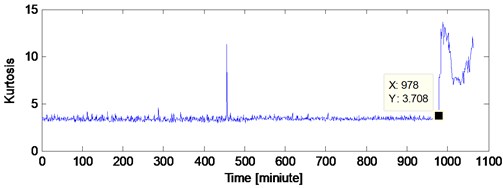
Fig. 10Time-domain waveform of the B14 vibration data at 970th minute with the corresponding envelope demodulation spectrum
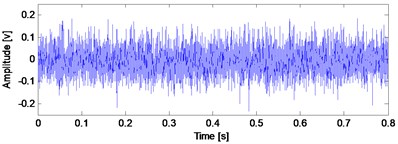
a) Time-domain waveform of the B14 vibration data at 970th minute
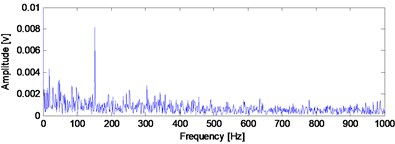
b) Envelope demodulation spectrum of the signal shown in Fig. 10(a)
4. Simulation of rolling bearing compound fault
Use the Eq. (19) to simulate rolling bearing inner race or outer race fault [16]. Set rotating frequency 12 Hz, outer race FCF 57 Hz, inner race FCF 103 Hz, and sampling frequency 16384 Hz. in Eq. (19) represents the slight sliding between the rolling element and the raceway which is assumed to subject to normal distribution, and its standard deviation value is 0.5 % of the rotating frequency. in Eq. (19) represents the added white noise.
Fig. 11SC analysis result of the signal shown in Fig. 10(a)
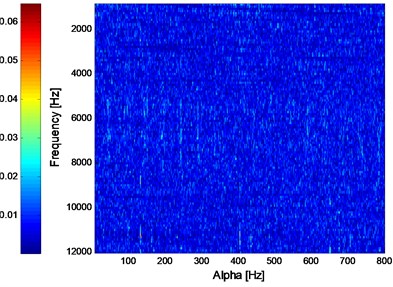
Fig. 12ISC analysis result of the signal shown in Fig. 10(a)
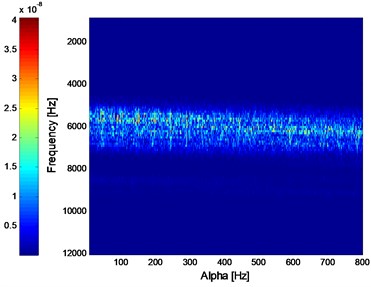
Fig. 13IISC analysis result of the signal shown in Fig. 10(a)
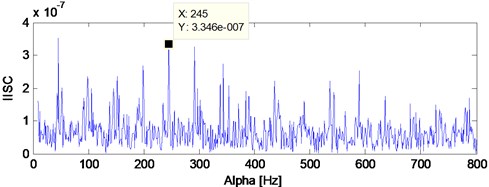
Fig. 14Rolling bearing compound fault simulation signal: a) outer race fault simulation; b) inner race fault simulation; c) noise; d) combined signal
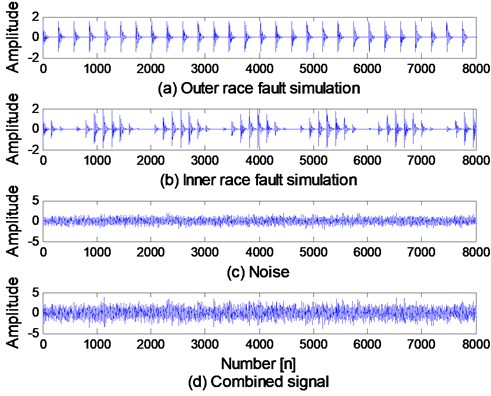
The time-domain waveforms of bearing inner race and outer race fault simulation signal are shown in Fig. 14(a) and (b), and the added noise is shown in Fig. 14(c). The combined signal of the three signals shown in Fig. 14(a), (b) and (c) is presented in Fig. 14(d) to simulate the rolling bearing compound fault:
Apply ED analysis on the signal shown in Fig. 14(d) and the result is shown in Fig. 15. It is evident that the ED method would not work effective on the rolling bearing compound fault. The SC analysis result of the signal shown in Fig. 14(d) is given in Fig. 16 from which the compound fault feature of rolling bearing could not be obtained. The ISC result of the signal shown in Fig. 14(d) is shown in Fig. 17 from which the compound fault feature of rolling bearing could be obtained roughly. However, the effect is not good and intuitive enough. Apply IISC on the rolling bearing compound fault simulation signal and the result is shown in Fig. 18 from which intuitive and satisfactory extraction result is obtained.
Fig. 15Envelope demodulation spectrum of the signal shown in Fig. 14(d)
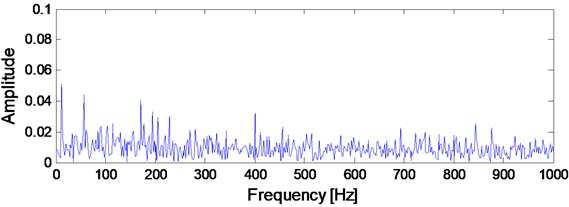
Fig. 16SC analysis result of the signal shown in Fig. 14(d)
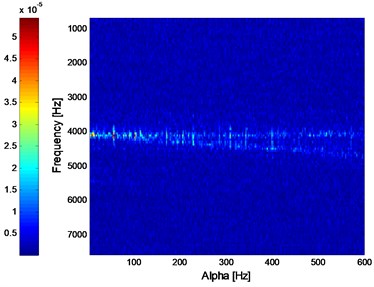
Fig. 17ISC analysis result of the signal shown in Fig. 14(d)
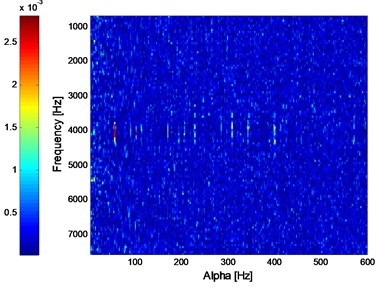
Fig. 18IISC analysis result of the signal shown in Fig. 14(d)
5. Experiment of rolling bearing compound fault
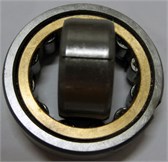
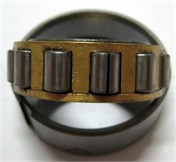
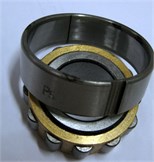
In the section, the UN205 rolling bearing is used as experimental object and the parameters of the experimental bearing are shown in Table.3. The calculated inner race FCF, outer race FCF and rolling element FCF are as following: = 95.38 Hz, = 64.41 Hz and = 5.38 Hz. The test rig of bearing compound fault experiment is shown in Fig. 19. The inner race of testing is rotating with the axis and the outer race is fixed in the test process. Machine cutting fault on the inner race, outer race and rolling element simultaneously to simulate rolling bearing compound fault and the machined fault is presented in Fig. 20.
Fig. 19Test rig of bearing compound fault experiment
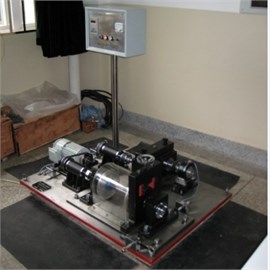
Fig. 20Rolling bearing compound fault with the machined fault on inner race, rolling element and outer race
a) Inner race fault
b) Rolling element fault
c) Outer race fault
The time-domain waveform of rolling bearing compound fault signal is given in Fig. 21 and the corresponding ED analysis result is presented in Fig. 22. Only the inner race FCF could be obtained based on Fig. 22, and the outer race FCF or rolling element FCF could not be obtained. It is verified that the ED method is not effective enough to extract the rolling bearing FCFs when compound fault arises in rolling element bearing.
Fig. 21Time-domain waveform of rolling bearing compound fault signal
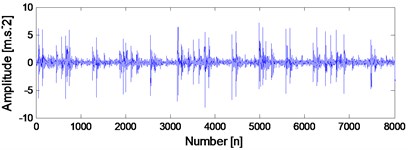
Fig. 22Envelope demodulation spectrum of the signal shown in Fig. 21
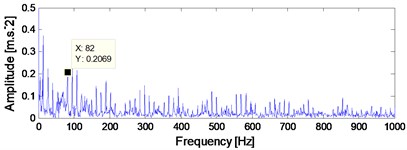
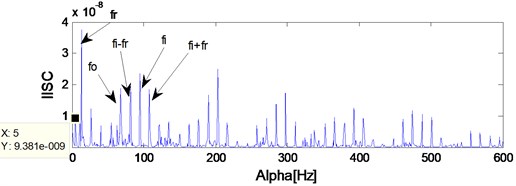
Fig. 23 and Fig. 24 are the SC and ISC analysis results of the signal shown in Fig. 21, and the noise-resistance virtues of ISC over SC could be verified further by comparing Fig. 23 and Fig. 24. However, the result is intuitive enough in Fig. 24, and the IISC analysis result of the signal shown in Fig. 21 is shown in Fig. 25 from which the inner race FCF, outer race FCF and rolling element FCF are extracted simultaneously. Besides, the harmonics of inner race FCF, outer race FCF and rolling element FCF are also extracted in Fig. 25.
Fig. 23SC analysis result of the signal shown in Fig. 21
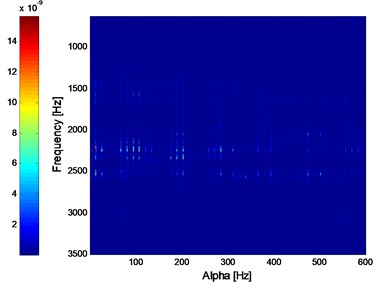
Fig. 24ISC analysis result of the signal shown in Fig. 21
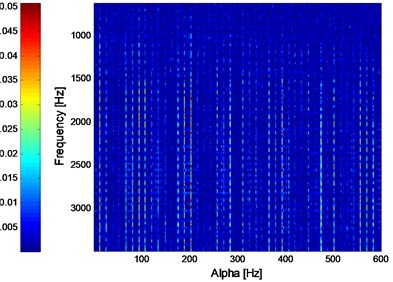
Fig. 25IISC analysis result of the signal shown in Fig. 21
6. Conclusions
In the paper, an improved spectrum correlation time-frequency analysis method naming ISC is studied and used in fault diagnosis of rolling element. The ISC has the noise-resistance advantage over SC through experiment verification. Furthermore, the ISC is improved and the IISC method is proposed in the paper to get the much more intuitive extraction effect. The reasons are as following: Firstly, the IISC method only extracts the modulated frequency and the modulation frequency with its harmonic are neglected which is in line with actual needs of rolling bearing fault diagnosis. Secondly, the IIS has stronger anti-noise ability because of energy summation and concentration by comparing Eq. (18) with Eq. (17).
Besides, the following conclusions could be obtained based on the relative studies in the paper. Firstly, the ED method would be effective when early weak fault or compound fault arises in rolling bearing due to the strong background noise interference or the compound structure of the signal itself. Secondly, the SC could not extract the early weak fault feature of compound fault feature. The proposed method ISC has the much more noise-resistance over SC. However, the extraction result using ISC would not be intuitive when compound fault arises in rolling element, and the proposed IISC solves the problem to some extent.
The studies of the paper offer some reference significance to solve the fault diagnosis problem of rolling bearing’ early weak fault and compound fault.
References
-
White G. D. Introduction to Machine Vibration. DLI Engineering Corporation, 1997.
-
Zhao H. M., Zheng J. J., Xu J. J., et al. Fault diagnosis method based on principal component analysis and broad learning system. IEEE Access, Vol. 7, 2019, p. 99263-99272.
-
Zhao H. M., Meng S., Deng W., et al. A new feature extraction method based on EEMD and multi-scale fuzzy entropy for motor bearing. Entropy, Vol. 19, Issue 1, 2017, p. 14.
-
Zhao H. M., Yao R., Xu L., et al. Study on a novel fault damage degree identification method using high-order differential mathematical morphology gradient spectrum entropy. Entropy, Vol. 20, Issue 9, 2018, p. 682.
-
Tandon N., Choudhury A. A review of vibration and acoustic measurement methods for the detection of defects in rolling element bearings. Tribology International, Vol. 32, 1999, p. 469-480.
-
Antoni J. Cyclic spectral analysis of rolling-element bearing signals: Facts and fictions. Journal of Sound and Vibration, Vol. 304, Issues 3-5, 2007, p. 497-529.
-
Antoni J., Bonnardot F., Raad A., et al. Cyclostationary modeling of rotating machine vibration signals. Mechanical Systems and Signal Processing, Vol. 18, Issue 6, 2004, p. 1285-1314.
-
Zhu Z. K., Feng Z. H., Kong F. R. Cyclostationarity analysis for gearbox condition monitoring: approaches and effectiveness. Mechanical Systems and Signal Processing, Vol. 19, Issue 3, 2005, p. 467-482.
-
Buzzoni M., Antoni J., D’elia G., et al. Blind deconvolution based on cyclostationarity maximization and its application to fault identification. Journal of Sound and Vibration, Vol. 432, 2018, p. 569-601.
-
Napolitano A. Cyclostationarity: new trends and applications. Signal Processing, Vol. 120, 2016, p. 385-408.
-
Jiang B. Z., Xiang J. W., Wang Y. X., et al. Rolling bearing fault diagnosis approach using probabilistic principal component analysis denoising and cyclic bispectrum. Journal of Vibration and Control, Vol. 22, Issue 10, 2017, p. 2420-2433.
-
Mahvash A., Lakis A. A. Application of cyclic spectral analysis in diagnosis of bearing faults in complex machinery. Tribology Transactions, Vol. 58, Issue 6, 2015, p. 1151-1158.
-
Luan S. Y., Qiu T. S., Zhu Y. J., et al. Cyclic correntropy and its spectrum in frequency estimation in the presence of impulsive noise. Signal Processing, Vol. 120, 2016, p. 503-508.
-
Kankar P. K., Sharma S. C., Harsha S. P. Fault diagnosis of rolling bearing using cyclic autocorrelation and wavelet transform. Neurocomputing, Vol. 110, 2013, p. 9-17.
-
Capdessus C. Cyclostationary processes: Application in gear fault early diagnosis. Mechanical System and Signal Processing, Vol. 14, 2000, p. 371-385.
-
Wang H. C., Chen J., Dong G. M. Feature extraction of rolling bearing’ early weak fault based on EEMD and tunable Q-factor wavelet transform. Mechanical System and Signal Processing, Vol. 48, 2014, p. 103-119.
-
Wang Z. Y., Chen J. J., Dong G. M., et al. Constrained independent component analysis and its application to machine fault diagnosis. Mechanical Systems and Signal Processing, Vol. 25, 2011, p. 2501-2512.
-
Ming Y., Chen J., Dong G. M. Weak fault feature extraction of rolling bearing based on cyclic Wiener filter and envelope spectrum. Mechanical System and Signal Processing, Vol. 25, 2011, p. 1773-1785.
About this article

The research is supported by the National Natural Science Foundation (approved Grant No. U1804141) and the Key Science and Technology Research Project of the Henan Province (approved Grant No. 192102210105).
