Abstract
The presented contribution deals with evaluation of wind loads on various layouts of plastic and steel mesh fabric. To obtain real wind effects and loads, the experimental measurement in the Boundary Layer Wind Tunnel (BLWT) in Bratislava has been prepared. The goal of an investigation is the determination of wind loads on permeable materials – plastic and steel fabric, using wind load reduction factor . The mean wind pressure on the permeable material is obtained by multiplying the wind pressure to the impermeable surface by the reduction factor k depending on the Reynolds number. The experimentally determined reduction factor can be applied for design of the safety mesh fabric. Wind loads were obtained from measurement of wind velocity by Hot-Wire anemometry (HWA).
1. Introduction
Wind effects and wind loads on the structures are given by EN 1991-1-4 [1] and by the National Annex EN 1991-1-4/NA for particular country, taking into account the meteorological conditions of the respective country and the locality where the objects are located. It takes into account a specific windy situation in every territory. The resulting wind load values are affected by the following factors:
1) wind conditions of a particular location,
2) roughness of the terrain,
3) aerodynamic characteristics of the shape of the object,
4) sizes and shapes of surrounding objects.
Wind actions on structures or structural elements are determined by wind pressure on surfaces. Wind pressure acting on the external surfaces depends on pressure coefficient for external pressure or resulting pressure coefficients. For general shapes of structures it is possible to find the values in Section 7 EN 1991-1-4 [1].
Wind pressure coefficients for atypical shapes and materials depend on solidity ratio . Porous walls, parapets with solidity ratio ≤ 0.8 are not mentioned in the standard. The wind pressure distribution on these structures can be obtained by experimental measurements in the wind tunnel.
2. Natural wind – basic characteristics
Basic parameter for determination of wind load on a structure is the basic wind velocity which is defined as:
where is the basic wind velocity in m/s, is directional factor [–], is seasonal factor [–], is basic fundamental value of wind velocity.
Next parameter is the mean wind velocity. It shows how the average wind speed is increasing at a height above the terrain to the value we call a gradient velocity, and where the flow is no longer influenced by air friction with the Earth’s surface. Eurocode 1991-1-4 [1] and the National annex accept a wind speed distribution model of up to 200 m height, and this reflects the logarithmic function according to Eq. (2) depending on the type of terrain:
where is the mean wind velocity in m/s, is the roughness factor [–], is the orography factor [–].
Mean wind pressure at height is then defined as:
where is the mean wind pressure in Pa, is the density of air in kg/m3.
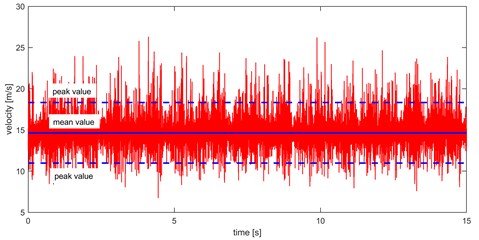
The next important parameter for evaluation of wind loads is the peak velocity pressure. It contains mean wind velocity and fluctuating part of wind velocity – turbulence. This is influenced by the atmospheric conditions in the given locality, height above terrain and local influences, e.g. roughness and orography, season and wind direction. The peak velocity pressure is calculated as the pressure in conditions of the mean wind speed and short-term velocity fluctuations see Eq. (4) and Fig. 1. It is defined as:
where is the peak velocity pressure in Pa, is the turbulence intensity in % or [–].
Fig. 1Time series of wind speed at the center point of the solved area
3. Wind tunnel experiment
Experimental measurements were conducted in accordance with the recommendations of ASCE (American Society of Civil Engineers), Manual No. 67 ASCE 1999 [2] for wind tunnel studies. The experimental investigations were performed in Boundary Layer Wind Tunnel (BLWT). For this type of measurement, it was necessary to ensure the uniform flow with low turbulence intensity. For that reason, flat surface was used as is illustrated in Fig. 3. Approaching flow was with turbulence intensity below 7.3 % and reference velocity depended on the boundary conditions. It varied from 6.58 to 17.87 m/s. 3 reference velocities were used.
3.1. Description of the BLWT and measuring devices
BLWT in Bratislava was designed with open circuit scheme (see Fig. 2) and two test sections. All the tests were conducted in working rear section 2.6 m wide, 1.6 m high and with 15 m long BL simulation of flat terrain. The operating wind speed range is 0.2-32 m/s [3].
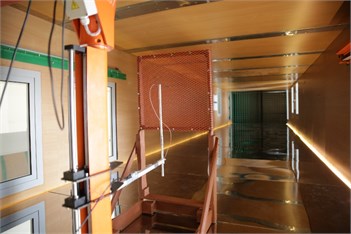
The following measurement devices were used during the basic and additional tests made in tunnel. Wind speed was measured using a CTA probe (Constant Temperature Anemometry) anemometer – miniCTA 54T42 (Fig. 3) on models at 5×5 mm mesh points. Two Prandtl tubes are placed in BLWT tunnel. One is placed in Front operation section and the other in Rear operation section. Both probes are fixed. Values measured by Prandtl tubes were used as control values during the tests and for calibration of Hot-Wire probe. Measurements were fully automated, i.e. values of temperature, barometric pressure, and values of wind velocities were automatically recorded and analyzed in self-developed programs created by software LabVIEW (National Instruments).
Fig. 2General view of BLWT in Bratislava
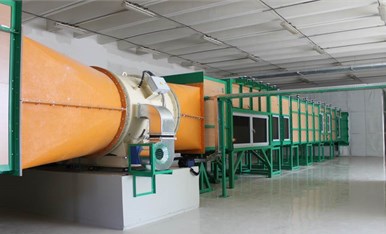
Fig. 3HWA MiniCTA Type 54T42 mounted on traverse system
3.2. Methodology of an experiment
Two types of mesh fabric, plastic and steel were chosen for wind analysis of reduction factor. Plastic mesh had net 4×4 mm and enhanced with crossing fibers. Steel mesh was designed with rhomboid 20×12 mm. Measured area was 50×50 mm in the middle of the cross section of the tunnel at height 0.8 m and terrain was being flat with intensity of turbulence less than 7.3 %. Following principles of measurements were applied: at first it was measured the velocity field with 3 reference velocities without the mesh fabric and then with the mesh. The test area on the model was chosen so that the wind ahead of the model was uniformly distributed and also that the wind pressure was not affected by the model frame. The scanning time of each point was 20 seconds to determine the average mean wind speed and the standard deviation at each point. Sampling frequency was 3000 Hz. Configuration of measuring mesh fabrics is illustrated in Fig. 4.
Fig. 4Experimental configurations: a) plastic mesh, b) steel mesh
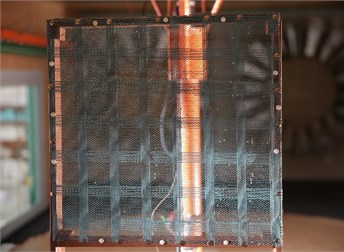
a)
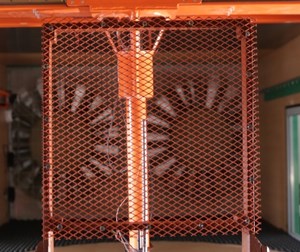
b)
4. Wind load reduction factor on the mesh fabric
The wind load reduction factor was determined for individual permeable materials as the mean wind pressure obtained by experimental measurements on the models divided by the mean wind pressure on full wall:
where is the reduction factor [–], is the mean wind pressure on measured area behind perforated model, is the mean wind pressure on full wall according to Eq. (3).
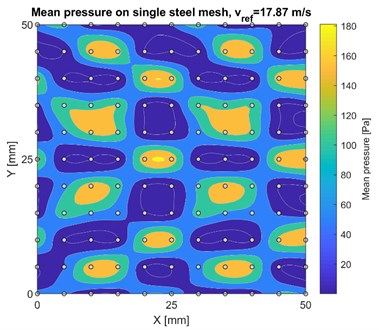
The resulting mean wind pressure values obtained from the measured experimental area on various permeable models are plotted in Figs. 5-7. Due to limit of pages only results for maximum wind speed were presented.
5. Results
The results were processed by script and plotted with contour maps. On the maps it is plotted the mean wind pressure and measuring points of the mesh. It can be seen, that results copy the positions of permeable and impermeable areas.
Fig. 5Mean wind pressure distribution on full wall
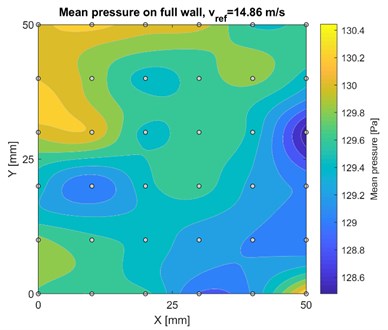
Fig. 6Mean wind pressure distribution on single plastic mesh fabric
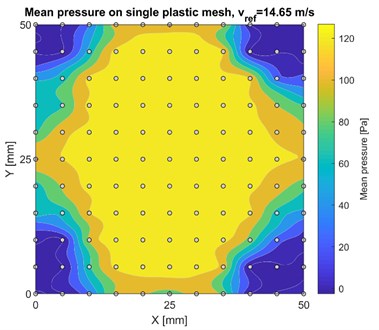
Fig. 7Mean wind pressure distribution on single steel mesh fabric
6. Conclusions
On the basis of the experimental measurements evaluated and given that the materials will be used on high-rise buildings where higher wind speeds are assumed, we recommend the following values of the reduction coefficients of mean wind load:
• For simple plastic mesh 0.68,
• For simple steel mesh 0.35,
Reducing the wind load is only possible on surfaces of materials with openings. Full wind load values are considered for frame and stiffeners. Reduction factor is used for mean wind pressure. The resulting peak wind pressure values are obtained from Eq. (4), where the wind turbulent effects of the given height and terrain are considered. If the openings are closed, for example, with ice coating or building material which, together with the rain, may partially block the openings, the reduction factor must not be used. This problem might occur mainly with plastic mesh. In this case, the factor 1.
References
-
EN 1991-1-4: Eurocode 1: 2007. Action on Structures – Part 1-4: General Actions – Wind Actions, 2007.
-
ASCE Manuals and Reports on Engineering Practice, No. 67, Wind Tunnel Studies of Buildings and Structures. Library of Congress Catalog Card No. 98-44103, USA, 1999.
-
Hubová O., Lobotka P. The Natural Simulations in the BLWT STU Wind Tunnel. In Proceedings of ATF 3rd Conference on Building Physics and Applied Technology in Architecture and Building Structurese E, Austria, Vienna, 2014, p. 78-84.
About this article

