Abstract
Recent regulations for emission control from combustion engines have led to focus on various methods to monitor control and the combustion process. The presented work explores the potential relationship between various combustion events monitored using in-cylinder pressure transducer and the resulting block vibration measured using accelerometers. Various features of combustion development process were derived from the vibration data acquired. The methodology was analyzed using a single cylinder diesel engine. The heat release data was able to detect and extracted various indicators of the combustion process like start of combustion and half of injected fuel positions. Higher correlation was observed for the data computed using heat release curve obtained from the in-cylinder pressure measurements and those obtained using the accelerometer signals. The proposed methodology can be used to optimize the fuel injection timing in order to reduce emissions from engines to comply with various regulations. The practical importance of presented work demonstrates use of monitoring of block vibration signals as a mean of non-intrusive methods of diagnosis of engine for its effective condition monitoring.
Highlights
- Various phases of combustion process in diesel engine cycle are analyzed.
- Conventional diesel engine spray formation discussed.
- Soot and NOx formation trade-off in Diesel engines discussed.
- Fuel injection parameters changes to analyze effects on block acceleration signals.
- Accelerometer mounted in vertical and horizontal orientations.
- Use of block acceleration signals to extract features of combustion process.
1. Introduction
Lee et al. [1] investigated the correlation between the maximum heat release rate and the engine vibration. Jung et al. [2] developed a closed‐loop control method for the combustion process monitoring that was based on the engine vibration signals. The presented work develops a methodology for monitoring of combustion process in diesel engines by using accelerometer signals. The main steps of the methodology are as follows:
• Selection of the proper position for the accelerometer;
• Coherence analysis of signals;
• Extraction of vibration components mainly related to the combustion;
• Characterization of various indictors related to combustion.
2. Background of research
Diesel engines may be further classified into following two major types:
1) Direct injection (DI) engines;
2) Indirect injection (IDI) engines.
In case of DI engines, the fuel is directly injected inside combustion chamber and as a consequence of it; lesser time is available for formation of fuel and air mixture. Hence a heterogeneous mixture consisting of both rich as well as lean parts is formed inside the combustion chamber.
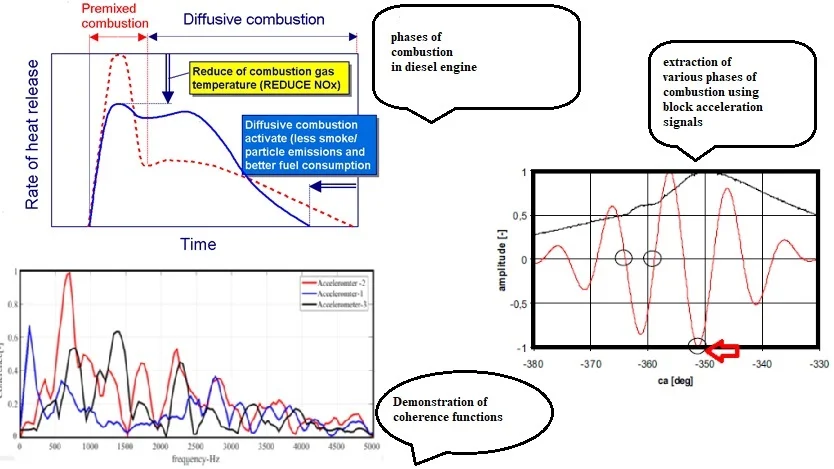
Fig. 1 shows various phases of combustion as observed during course of operation of a typical diesel engine. The injection of fuel inside combustion chamber begins a few degrees before top dead center TDC position depending on the various injection conditions of engine. As soon as the cold jet of fuel penetrates the chamber, it mixes up with hot compressed air already present inside. The droplets thus formed vaporize, forming layers of fuel-air mixture around the periphery of jet. As the temperature rises to about 750 K, the first break down of Cethana fuel takes place. Further propagation of various chemical reactions produces exhaust gases in form of NOX and PM, as well as water vapors [3].
Fig. 1Typical diesel rates of fuel injection and heat release direct on further better optimization [3]
![Typical diesel rates of fuel injection and heat release direct on further better optimization [3]](https://static-01.extrica.com/articles/20516/20516-img1.jpg)
The reduction of the fuel amounts that burn in the premixed combustion results in lower maximal temperature values in cylinder, which reflects in reduce of NOx emissions. The higher amount of fuel that burns during the diffusive part of combustion generates a higher temperature values during a second part of combustion and expansion, which reflects in lower particle and smoke emissions. The shortening of overall combustion period and this displacement toward optimized position with respect to TDC, was realized the reduction of fuel consumption, particle and smoke emissions.
Then, here demonstrated directives ought with feedback copy through multiple-injection strategies in directives for the optimized injection rate. Together, the application of variable compression ratio is obligatory.
Resulting rise in temperatures causes a complete combustion of fuel-air mixture formed. This sudden period of combustion further leads to rise in the heat release rate as well as high pressure gradient (/). This further enhances temperatures in the pre-mixed zone leading to conditions favorable for production of NOX. As, the premixed phase consumes all mixture formed, oxygen available for combustion is consumed around the inner regions wherein the temperatures in ranges of (1600-1700) K are reached [3]. Now various partial burnt particles diffuse towards outer layers and begin to burn within a thin region of reaction formed around the periphery of spray which leads to formation of a diffusion flame. This phase of combustion is known as diffusion controlled combustion and is depicted by region 2 and 3 in Fig. 2. Higher temperatures along with lack of oxygen provide an ideal condition for the formation of soot.
Fig. 2Conventional diesel engine spray formation [3]
![Conventional diesel engine spray formation [3]](https://static-01.extrica.com/articles/20516/20516-img2.jpg)
a)
![Conventional diesel engine spray formation [3]](https://static-01.extrica.com/articles/20516/20516-img3.jpg)
b)
The diffusion flame thus formed then uses rest of oxygen available from surrounding environment resulting in high temperatures of order 2700 K which consumes all the soot formed. At outer zone of flame there is enough oxygen content for formation of NOX as shown in Fig. 2. Fig. 3 shows the rate of soot formation as a function of crank angle. Most of soot that is formed during earlier stages is later consumed and hence final exhaust emissions may have only a fraction of initial soot emissions.
Fig. 3Rate of soot formation in experimental diesel engine for different pressure and crank angles [3]
![Rate of soot formation in experimental diesel engine for different pressure and crank angles [3]](https://static-01.extrica.com/articles/20516/20516-img4.jpg)
As seen from Fig. 4, the diffusion controlled combustion can be divided into further three phases. During the second phase, the burning rate is dependent on rate of mixing of fuel fragments formed and air, and hence rate of reaction is faster. During the third phase, oxidation of remaining un burnt particles and soot takes place, however due to decreased temperature of end gas formed during the expansion stroke as well as lesser oxygen content available, slower reaction rates are observed.
Process of NOX and soot formation in combustion engines shows an opposite trend as shown in Fig. 4. In order to reduce the NOx formation rate, it is necessary that local temperatures must not rise beyond 2000 K [3]. A possible way to do so is to inject fuel late inside combustion chamber which further shifts the combustion phase towards expansion phase resulting in significant reduction of chamber temperatures. However, rate of consumption of fuel and soot formation increases due to late combustion.
Fig. 4Soot and NOX formation trade-off in diesel engines [3]
![Soot and NOX formation trade-off in diesel engines [3]](https://static-01.extrica.com/articles/20516/20516-img5.jpg)
Hence modern systems utilize multiple injection strategies in order to control both NOX as well as soot formation rate [4-7].
There injection of fuel is carried out in three phases, namely pre-injection period, main-injection period and after injection period. There is a delay period between instant at which fuel is injected inside the combustion chamber and actual start of ignition process. Greater this delay period, more is the temperature achieved during course of combustion and hence better conditions exist for NOX formation. In order to shorten this delay period, a small amount of fuel is pre-injected before main injection takes place during the phase of pre-mixed combustion. It is advantageous to vary the injected fuel mass with time in order to reduce the specific consumption of fuel. This is achieved by rate shaping as seen in Fig. 5. Rate shaping curve may be rectangular, step or boot type in shape. Torque and power produced in engine mainly depends on the duration of main injection period. Post-injection of fuel is done in order to reduce the soot emissions and in some cases may be useful for exhaust gas recirculation treatment [8]. It has been reported that post injection may reduce the rate of soot formation by about 70 % without increasing the fuel consumption [9].
Fig. 5Multiple injection process adopted for modern diesel engines [3]
![Multiple injection process adopted for modern diesel engines [3]](https://static-01.extrica.com/articles/20516/20516-img6.jpg)
3. Experimental setup
Experiments were conducted on the test rig with HATZ make single cylinder diesel presented in Table 1.
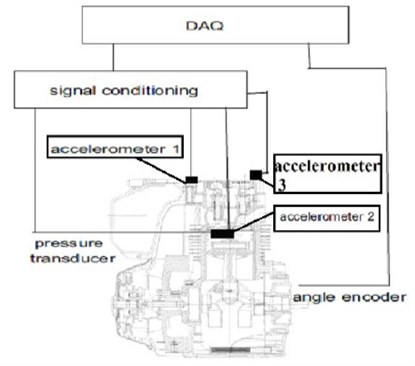
The block vibrations were measured by means of a Wilcox type mono axial accelerometer which was mounted in vertical and horizontal orientations on engine block as show in Fig. 6.
Table 1Experimental engine specification
Engine maker | HATZ |
Maximum engine speed | 3600 rpm |
Maximum power | 3.3-7 Kw |
Engine compression ratio | 4.5:1 |
Maximum engine torque | 22.5 N-m |
Fig. 6Accelerometer position on the experimental engine
During the tests the injection parameters were varied with different injection timings and durations as seen in Table 2. Various fuel injection parameters are shown in Table 3.
Table 2Experimental conditions
Case | Engine speed, rpm | Engine load, % |
1 | 2000 | 80 |
2 | 2000 | 100 |
3 | 2000 | Motored |
4 | 3000 | 80 |
5 | 3000 | 100 |
Table 3Fuel injection conditions
Case | (°BTDC) | (°BTDC) | (mm3/stroke) | (mm3/stroke) |
1 | 6.2 | 19.3 | 15.4 | 1 |
2 | 8 | 20 | 16.7 | 1 |
3 | – | – | – | – |
4 | 9 | 18.4 | 17.814.6 | 1 |
5 | 5.5 | 22.2 | – | 1 |
4. Results and discussions
During the first step of activity, accelerometers were mounted on the test engine at three different locations (marked as accelerometer 1, accelerometer 2 and accelerometer 3) with an aim to select a suitable location which can best diagnose the combustion process as shown in Fig. 6. The aim was to select a location that was most sensitive towards combustion process and least sensitive towards other sources of noise like valve operational noise, flow noise, pump noise etc. [10]. More detailed analysis has been discussed in [11, 12].
The coherence (sometimes called magnitude-squared coherence) between two signals and is a real-valued function that is defined as:
where is the Cross-spectral density between and , and and the auto spectral density of and respectively. The magnitude of the spectral density is denoted as .
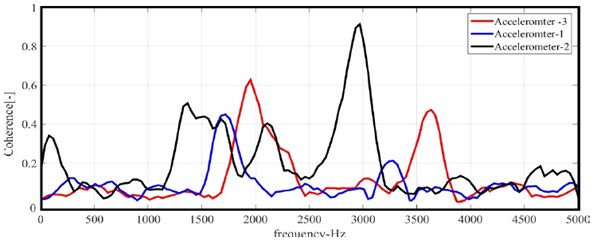
Coherence functions between accelerometer data and in cylinder pressure development were plotted in order to investigate relationship as shown in Fig. 7-11. This function is defined as ratio of cross (PSD) between in-cylinder pressure block vibration signals () to product of auto PSD of in cylinder pressure developed () and auto PSD of block vibration signals (). The coherence functions were obtained by considering the accelerometer in vertical position (as depicted by accelerometer at position no 2) and horizontal positions (as depicted by accelerometer at position number 1, 3). This function was computed on basis of 30 cycles averaging with an aim to get accurate ranges in which the random data was attenuated using the Hamming window of length (1/6)th of an engine cycle. The plots show that the accelerometer signals acquired in horizontal positions were less coherent towards in cylinder pressure development as compared with those acquired at vertical position. This may be due to corruption of horizontal signals by other sources of noise like piston slap.
Fig. 7Coherence function (Case 1)
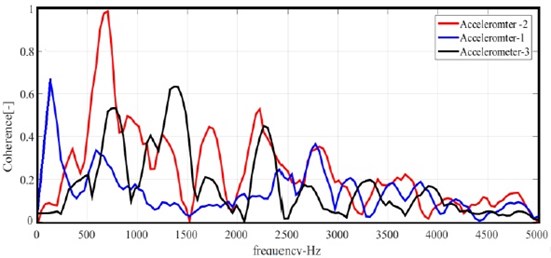
Fig. 8Coherence function (Case 2)
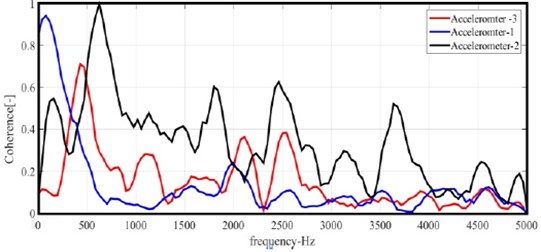
From the plots it is clear that engine fundamental firing frequency and its integral multiples show high values of coherence close to unity. This implies that harmonics of this frequency propagate through engine block and were recorded by accelerometers in both orientations. Regardless of locations of accelerometers and other operational conditions, higher values of coherence function were observed in a common frequency range of (0.5-3.8) kHz. This indicates that a strong relationship between the spectral components of in cylinder pressure and resulting block vibrations in this range.
Fig. 9Coherence function (Case 3)
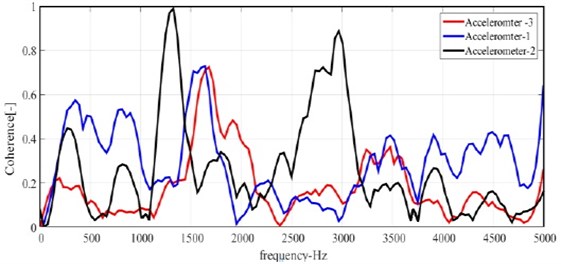
Fig. 10Coherence function (Case 4)
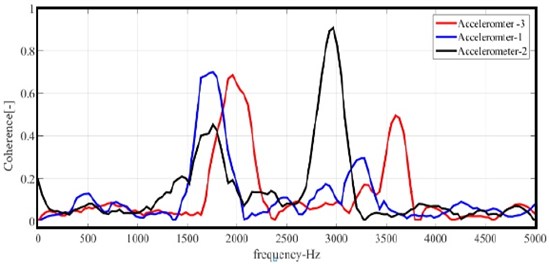
Fig. 11Coherence function (Case 5)
However, higher values of Coherence function does not mean that selected frequency band were dominated by combustion process. Hence, analysis was carried out by filtering the vertical accelerometer signals in frequency range dominated by combustion process so as to isolate various harmonic components useful for identification of various combustion parameters. Fig. 12-16 shows plots related to combustion pressure for various testing conditions in case of a single cylinder of engine and filtered vertical accelerometer signals. Higher pressure rise rate due to initial mixing of fuel and air contributes towards engine block vibrations. The accelerometer signals were found to be sensitive towards initial rapid rise of pressure gradient irrespective of fuel injection parameters. Contributions of motion based towards the vibration signature were less visible due to development of combustion process.
Fig. 12In cylinder pressure [----] and accelerometer signals [----] (Case 1)
![In cylinder pressure [----] and accelerometer signals [----] (Case 1)](https://static-01.extrica.com/articles/20516/20516-img13.jpg)
Fig. 13In cylinder pressure [----] and accelerometer signals [----] (Case 2)
![In cylinder pressure [----] and accelerometer signals [----] (Case 2)](https://static-01.extrica.com/articles/20516/20516-img14.jpg)
Fig. 14In cylinder pressure [black] and accelerometer signals [red] (Case 3)
![In cylinder pressure [black] and accelerometer signals [red] (Case 3)](https://static-01.extrica.com/articles/20516/20516-img15.jpg)
Fig. 15In cylinder pressure [black] and accelerometer signals [red] (Case 4)
![In cylinder pressure [black] and accelerometer signals [red] (Case 4)](https://static-01.extrica.com/articles/20516/20516-img16.jpg)
Fig. 16In cylinder pressure [black] and accelerometer signals [red] (Case 5)
![In cylinder pressure [black] and accelerometer signals [red] (Case 5)](https://static-01.extrica.com/articles/20516/20516-img17.jpg)
Aimed at further analysis the normalized values of filtered accelerometer signals were superimposed with corresponding non-filtered in-cylinder pressure curves as depicted in Fig. 17-21 in order to detect the crank angles in which premixed and diffusion phases of combustion were predominant. Normalization was done by division with corresponding maximum values.
It has been previously demonstrated that accelerometer data was able to locate the start of the combustion process [13]. Moreover, the vibration traces allow detecting the crank angles in which the diffusive phase dominates over the pre-mixed one. In the figures circles have been used to indicate in vibration data the crank angles where onset of various phases of combustion takes place. The first which is marked by vibration curve, crossing zero value with a simultaneous sudden rise of in-cylinder pressure denoting the start of pre-mixed phase of combustion [14]. The diffusive phase of combustion begins with the end of the negative oscillations in the vibration data corresponding to vibration values crossing the next zero markings [15]. Further circled arrows were used to indicate in filtered accelerometer data the crank angle positions corresponding to minimum value following the maximum one [16]. Regarding motored case when no fuel injection takes place, only crank angle corresponding to minimum value of filtered acceleration signal has been marked. The results showed minimum sensitivity towards variations in fuel injection timings and amount of fuel injected. The crank angles corresponding to the minima of filtered vibration data (as denoted by circled arrows) and maxima of in cylinder pressure data were thus calculated. A coefficient of proportionality which is defined by the ratio of these values is seen in Fig. 22.
Fig. 17In cylinder pressure plots [black], filtered accelerometer 2 signal [red] (Case 1)
![In cylinder pressure plots [black], filtered accelerometer 2 signal [red] (Case 1)](https://static-01.extrica.com/articles/20516/20516-img18.jpg)
Fig. 18In cylinder pressure plots [black], filtered accelerometer 2 signal [red] (Case 2)
![In cylinder pressure plots [black], filtered accelerometer 2 signal [red] (Case 2)](https://static-01.extrica.com/articles/20516/20516-img19.jpg)
Fig. 19In cylinder pressure plots [black], Filtered accelerometer 2 signal [red] (Case 3)
![In cylinder pressure plots [black], Filtered accelerometer 2 signal [red] (Case 3)](https://static-01.extrica.com/articles/20516/20516-img20.jpg)
Fig. 20In cylinder pressure plots [black], filtered accelerometer 2 signal [red] (Case 4)
![In cylinder pressure plots [black], filtered accelerometer 2 signal [red] (Case 4)](https://static-01.extrica.com/articles/20516/20516-img21.jpg)
Fig. 21In cylinder pressure plots [black], filtered accelerometer 2 signal [red] (Case 5)
![In cylinder pressure plots [black], filtered accelerometer 2 signal [red] (Case 5)](https://static-01.extrica.com/articles/20516/20516-img22.jpg)
Further analysis of rate of heat release rate (ROHR) was done which is given by Eq. (1) [16]:
where – denotes the in cylinder volume; – represents the cylinder pressure; – specific heat ratio.
Fig. 22Correlation between normalized values, [-----] – interpolation line
![Correlation between normalized values, [-----] – interpolation line](https://static-01.extrica.com/articles/20516/20516-img23.jpg)
The cumulative heat release rate (CHRR) is given by integration of Eq. (1). Normalized values of filtered accelerometer in vertical position were superimposed with CHRR curves to observe any possible relationship for full load conditions. It can be seen from Fig. 23, 24 that the marked circles correspond to initial and main combustion period of engine cycle. The marked arrow which denotes the minimum value of filtered acceleration signals (which is related to peak in cylinder pressure) does not correspond to peak CHHR in crank angle domain. This point in accelerometer curve is of interest in the combustion process monitoring, as it is related to crank angle position at which about half of injected fuel is burnt (MFB50) [17-31].
Fig. 23CHHR [black] and filtered accelerometer curve [red] (Case 2)
![CHHR [black] and filtered accelerometer curve [red] (Case 2)](https://static-01.extrica.com/articles/20516/20516-img24.jpg)
Fig. 24CHRR [black] and filtered accelerometer curve [red] (Case5)
![CHRR [black] and filtered accelerometer curve [red] (Case5)](https://static-01.extrica.com/articles/20516/20516-img25.jpg)
5. Conclusions
In the present work a novel methodology has been developed and validated, with an aimed of extracting various features of combustion process from the signal of an accelerometer placed on a selected location of the engine block. Experimentation was performed on a gasoline engine. The analysis of the signals highlighted that exists a particular frequency band in which in‐cylinder pressure and engine block vibration signals have high correlations. This band was found to be independent of operational conditions of engine. The accelerometer signals filtered in the relevant frequency band had minimum contributions due to all other sources except combustion process. The angular position of SOC and MFB50 was thus computed and compared with those found from heat release curve. The presented work highlights the necessity of feedback signal algorithm in order to correct the injection timings and thus forms an important aspect of emission regulation using nonintrusive condition monitoring.
References
-
Yang Z., Stobart R., Winward E. Online adjustment of start of injection and fuel rail pressure based on combustion process parameters of diesel engine. SAE Technical Paper 2013-01-0315, 2013, https://doi.org/10.4271/2013-01-0315.
-
Lujàn J. M., Bermudez V., Guardiola C., Abbad A. A methodology for combustion detection in diesel engines through in‐cylinder pressure derivate signal. Mechanical Systems and Signal Processing, Vol. 24, Issue 7, 2010, p. 2261-2275.
-
Lee S., Lee J., Lee S., Kim D., Lee Y., Yu S., Choi H. Study on reduction of diesel engine out emission through closed loop control based on the in‐cylinder pressure with EGR model. SAE Technical Paper 2013-01-0322, 2013, https://doi.org/10.4271/2013-01-0322.
-
Ponti F., Ravaglioli V., Serra G., Stola F. Instantaneous engine speed measurement and processing for MFB50 evaluation. SAE International Journal of Engines, Vol. 2, Issue 2, 2010, p. 235-244.
-
Moro D., Cavina N., Ponti F. In‐cylinder pressure reconstruction based on instantaneous engine speed signal. Journal of Engineering for Gas Turbines and Power, Vol. 124, 2002, p. 220-225.
-
Taglialatela F., Lavorgna M., Mancaruso E., Vaglieco B. M. Determination of combustion parameters using engine crankshaft speed. Mechanical Systems and Signal Processing, Vol. 38, Issues 2-20, 2013, p. 628-633.
-
Desbazeille M., Randall R. B., Guillet F., El Badaoui M., Hoisnard C. Model‐based diagnosis of large diesel engines based on angular speed variations of the crankshaft. Mechanical Systems and Signal Processing, Vol. 24, Issue 5, 2010, p. 1529-1541.
-
Gu F., Li W., Ball A. D., Leung A. Y. T. The condition monitoring of diesel engines using acoustic measurements part 1: acoustic characteristics of the engine and representation of the acoustic signals. SAE Technical Paper 2000-01-0730, 2000, https://doi.org/10.4271/2000-01-0730.
-
Narayan S., Gupta Aman, Sharma Shubham Combustion Engines: An Introduction to Their Design, Performance, and Selection. Wiley, 2016.
-
Polonowski C., Mathur V., Naber J., Blough J. Accelerometer based sensing of combustion in a high speed HPCR diesel engine. SAE Technical Paper 2007-01-0972, 2007, https://doi.org/10.4271/2007-01-0972.
-
Lee S., Lee Y., Lee S., Song H. Study on the correlation between the heat release rate and vibrations from a diesel engine block. SAE Technical Paper 2015-01-1673, 2015, https://doi.org/10.4271/2015-01-1673.
-
Jung I., Jin J., Won K., Yang S., Kyoungdoug M., Hoimyung C. Closed‐loop control for diesel combustion noise using engine vibration signals. SAE Technical Paper 2015-01-2297, 2015, https://doi.org/10.4271/2015-01-2297.
-
Milojević S. Analyzing the Impact of Variable Compression Ratio on Combustion Process in Diesel Engines. Master Thesis, University of Kragujevac, Faculty of Mechanical Engineering, 2005.
-
Flynn P., Durrett R., Hunter G., Loye A., Akinyem O., Dec J., Westbrook C. Diesel combustion: an integrated view combining laser diagnosis chemical kinetics and empirical validation. SAE Technical Paper 1999-01-0509, 1999, https://doi.org/10.4271/1999-01-0509.
-
Hammer J., Durnholz M., Dohle U. Entwicklungstrends bei Einspritzsystemen fur PKW-Diesel motoren. Dieselmotorentechnik, 2004, p. 36-52.
-
Ricaud J., Lavoisier F. Optimizing the multiple injection settings on an HSDI diesel engine. Thermo- and Fluid Dynamic Processes in Diesel Engines, 2004, p. 199-234.
-
Drake M., Ratcliffe J., Blint R., Carter C., Laurendeau N. Measurements and modelling of flame front NOx formation and super Equilibrium radical concentrations in laminar high pressure premixed flames. Symposium (International) on Combustion, Vol. 23, Issue 1, 1991, p. 387-395.
-
Duret P., Gatellier B., Miche M., Montreiro L., Zima P., Marotaux D., Blundell D., Gase M., Zhao H., Perozzi M., Araneo L. Innovative diesel HCCI combustion process for passenger cars: European Space light project. Journal of Fuels and Lubricants, Vol. 113, 2004, p. 987-1001.
-
Arnone L., Manelli S., Chiatti G., Chiavola O. In cylinder pressure analysis through accelerometer signal processing for diesel engine combustion optimization. SAE Technical Paper 2009-01-2079, 2009, https://doi.org/10.4271/2009-01-2079.
-
Chiavola O., Chiatti G., Recco E. Accelerometer measurements to optimize injection strategy. SAE Technical Paper 2012-01-1341, 2012, https://doi.org/10.4271/2012-01-1341.
-
Chiatti G., Recco E., Chiavola O. Vibration processing to optimize pressure development in CR diesel engine. SAE Technical Paper 2011-01-1560, 2011, https://doi.org/10.4271/2011-01-1560.
-
Arnone L., Manelli S., Chiatti G., Chiavola O. Engine block vibration measures for time detection of diesel combustion phases. 9th International Conference on Engines and Vehicles, 2009.
-
Torregrosa A., Broatch A., Maratin J., Monelletta L. Combustion level assessment in direct injection diesel engines by means of in cylinder pressure components. Measurements Science and Technology, Vol. 18, Issue 7, 2007, p. 2131-2142.
-
Ge Qun S., Hai Qiao W., Rui H. The transfer function of combustion noise in D.I. diesel engine. SAE Technical Paper 2005-01-2486, 2015.
-
Liang X., Yang K., Shu G., Dong L. The identification of noise source in diesel engine based on the cepstrum analysis of sound and vibration signals. SAE Technical Paper 2012-01-0802, 2012, https://doi.org/10.4271/2012-01-0802.
-
Chiavola O., Chiatti G., Arnone L., Manelli S. Combustion characterization in diesel engines via block vibration analysis. SAE Technical Paper 2010-01-0168, 2010, https://doi.org/10.4271/2010-01-0168.
-
Arnone L., Boni M., Manelli S., Chiavola O., Conforto S., Recco E. Diesel engine combustion monitoring through engine block vibration signal analysis. SAE Technical Paper 2009-01-0765, 2009, https://doi.org/10.4271/2009-01-0765.
Cited by
About this article

