Abstract
Damage imaging based on scattering signals of ultrasonic Lamb waves in plate structure is considered as one of the most effective ways for structural health monitoring area. To improve location accuracy and reduce the impact of artifacts, a probability weighted four-point arc imaging algorithm for time reversal Lamb wave damage detection is proposed in this paper. By taking the defect as a secondary wave source, the four-point arc positioning method is used to calculate the propagation time of the signal from transducer to defect. And the amplitude of damage signal corresponding to the time of flight is used for imaging. In order to eliminate the artifacts, a damage probability weighting is combined with four-point circular arc imaging algorithm. The effectiveness of the proposed method is experimentally verified in aluminum plate. Experimental results indicate that damage location accuracy and imaging quality has been improved in both single-flaw and double-flaw samples compared with conventional delay-and-sum method.
Highlights
- Use the flight time of Lamb wave scattering signals to image the damages
- Combine the four-point arc imaging method and damage index probability imaging together
- Time reversal method is used to refocus energy and increase signal-to-noise ratio
- Our algorithm has been verified through the experiment on aluminum plates
1. Introduction
Structural health monitoring (SHM) has been a considerable research area for material integrity nondestructive inspecting. In this area, structure interrogation using Lamb wave can be done with transducers fixed on plate surface, which is convenient in practical applications. It is of great significance to quality inspections of industry products, especially in the plate like structure detection [1-3].
Lamb wave can spread between two surfaces of plate structure and scatter at the flaw. The defect information is acquired from the received signals which are collected by ultrasonic transducers fixed on the plate. Through imaging methods, the defect position is shown after processing the received signals. Wang et al. [4] proposed a delay-and-sum (DAS) algorithm which effectively imaged the received signals, but it made artifacts in the case of multiple defects. Sohn et al. [5] explored the correlation between the damage condition and the similarity of the reconstruct and excitation signal, and proposed the concept of damage index (DI) to characterize the severity of defect without baseline signal. Zenghua Liu et al. [6] yield a baseline-free detection method combined with the modified damage imaging algorithm based on the time reversal method. Xin Li et al. [7] proposed an acoustic emission source locating method based on time reversal theory by using four-point arc location algorithm. The efficiency of this methodology had been verified through experiments, and results showed the enhancement of damage signal energy. But the artifacts can be produced through this method.
In our paper, a new probability weighted algorithm based on the four-point arc location method is proposed. The new algorithm has been verified by the experiment, and the position of damage can be shown accurately through time reversal reconstruction signal in the detected area.
2. Principle of four-point arc location method
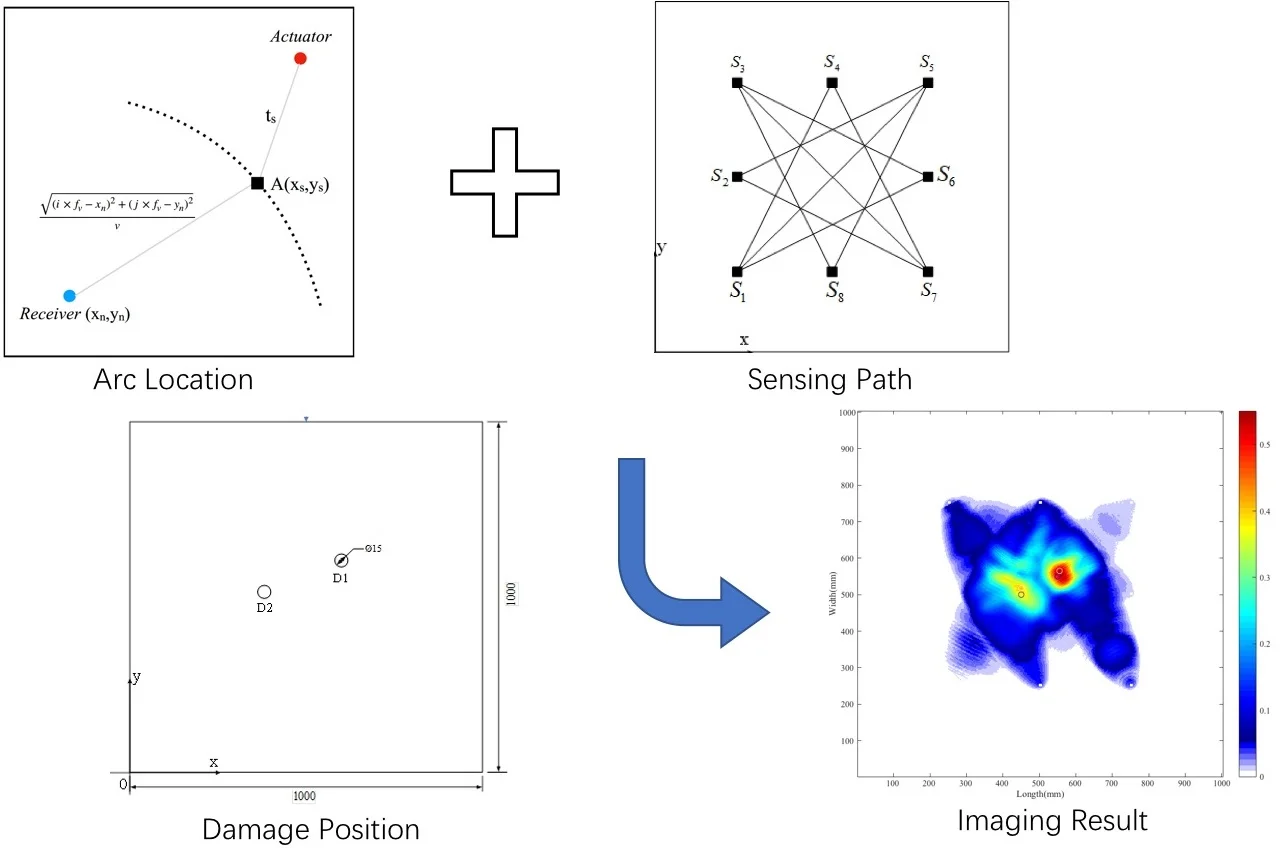
Four-point arc location algorithm is an active damage monitoring method [8]. Supposing four transducers are fixed in the four corners of a squire measured area in a plate, if the time of arriving at the receivers is known, the time of arriving at the flaw, , can be calculated by Eq. (1):
where (, ) is the defect coordinate, (, ) is the first transducer coordinate, is the structure wave velocity, and is the time of the signal arriving at the first transducer. (, ), (, ), (, ), , and are similar defined. The flaw position and the time of arrival at the defect can be calculated by solving the equations. The principle of four-point arc location method is shown in Fig. 1(a), where A is the damage point. And then, the received signal can get imaged referring to the calculation results as shown in Eq. (2):
where is the damage imaging value of the position (, ), is the number of the signal, is a coefficient for balancing the transducers’ output, is the distance of transducer (, ) and measure point (, ) and is image resolution. The defect is seen as an acoustic secondary source according to the time . The schematic of the imaging method is presented in Fig. 1(b).
Fig. 1Illustration of four-point arc imaging method
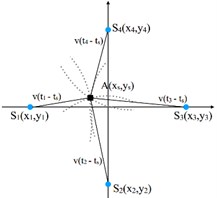
a) Location schematic
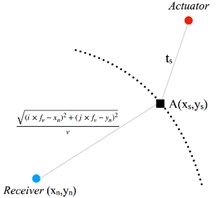
b) Imaging principle
3. Proposed method
3.1. Damage index probability imaging
The time reversal method is an application of the acoustic reciprocity principle, which can effectively reconstruct the sound source signal [9]. After the time reversal process, the received signal, should have the same shape with the original one, which is called signal reconstruction.
Referring to the time reversal theory, if certain kinds of defects present, the linear reciprocity property will break down, making the reconstructed signal deviate from the input original signal [5]. Due to this property, the damage index is introduced to quantify the deviation of the two signals [10]. Damage index is calculated by Eq. (3):
where denotes the th damage sensing path, , are the signal time of beginning and ending. The defect probability at a specific position (, ) is defined by Eq. (4) as follows:
where is the probability distribution. Sheen et al. [11] indicated that the longer distance from damage to sensing path related smaller damage index. The distribution function is:
where is a sensing area parameter of a certain path. In this paper, 0.05. And:
where is the distance from (, ) to the actuator in the th sensing path. Similarly, is the distance to the receiver. And is the distance of the actuator and receiver. The distribution function gives the relationship between damage probability and measured position.
3.2. Damage probability weighted four-point arc imaging
The four-point arc location method has better position accuracy than the damage index weighted method, however the artifacts may produce owing to the algorithm limitation. While the probability method creates no artifacts, but it has limited location capability. In order to make full use of the defect information and acquire better imaging quality, a new weighted algorithm based on the four-point arc location method and the damage index probability method is presented. According to Eq. (4)-(6), this new weighted imaging algorithm is explained by Eq. (7):
It is not difficult to see that Eq. (7) is the form of probability expectation. And the full summation method is used to obtain the imaging result after each of the expectation term is calculated. Under the influence of the probabilities, image of the measured area is limited by the damage probability distribution, which reduces error of the damage location. The new weighted method combines the advantages of both methods. By adding the part of probability weight, the image quality of the four-point arc imaging algorithm is improved and the image value of artifact pixel is reduced. Besides, the defects can be located more accurately.
4. Experiments
4.1. Experimental setup
The experimental system consists of a personal computer, an arbitrary waveform signal generator (Agilent 33520A), an active signal amplifier based on the TI op amp chip OPA657, and a four-channel oscilloscope (Tektronix DPO5034B). The experimental setup is shown in Fig. 2. The excitation signal is the normalized five period sinusoidal narrow-band signal modulated by Hanning window. And the signal frequency is 500 kHz. The signals are excited and received by contacting ultrasonic oblique probes.
The test samples in this experiment are two 6061 aluminum plates, which are single-flaw and double-flaw respectively. The defects are circle through hole with a diameter of 15 mm. The coordinate origin is the left bottom corner of the plate. As the Fig. 3(a) and Fig. 3(b) shows, the center coordinate of the single flaw is (550, 550) called D1, and the center coordinates of the double flaws are (450, 500) and (550, 550) called D1 and D2 respectively. During the imaging process, the measured area is divided into 400×400 = 160000 grids with the area of 2.5×2.5 mm2 for each one.
The transducers are placed as shown in the Fig. 3(c), in order to reduce the influence of boundary reflection. The black blocks denote the transducers, and the links between the blocks are the 10 sensing paths. The positions of the eight probes are (250,250), (500,250), (750,250), (500,750), (750,750), (750,500), (750,250), (500,250).
Fig. 2Schematic illustration of experimental setup
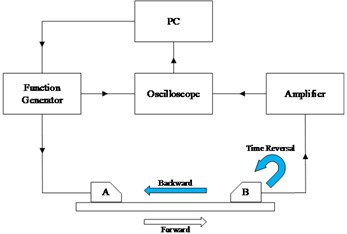
a) Experimental system
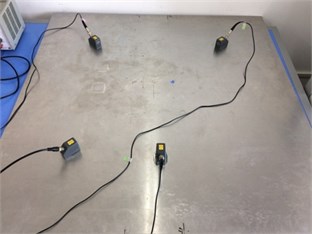
b) Transducers placement
Fig. 3Diagram of environmental sample plates
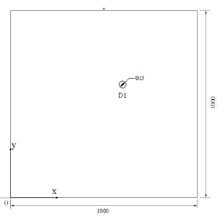
a) Single flaw sample
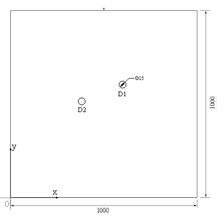
b) Double flaws sample
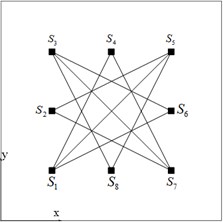
c) Sensing paths layout
4.2. Experiment processing and results
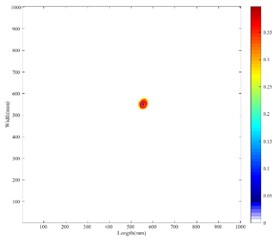
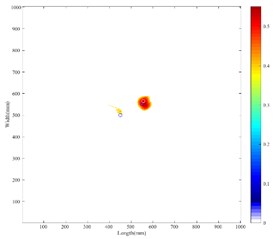
Using the experimental system above, a series of signal data related to each sensing path is obtained through the time reverse process. Then the damage index shown in Table 1 and Table 2 is calculated by Eq. (3) according to the time reversal signal. The result of the damage probability weighted four-point arc method is presented in Fig. 4(a) and Fig. 4(b). Note that white circles denote the defects acquired by the method and black circles indicate the actual defect locations. From the picture, the distance from the center of the defect acquired by the method to the real, D1, is 5 mm for the single-flaw plate; and in the double-flaw sample, the distances from the algorithm acquired to the real are 17.50 mm for the D1 and 15.81 mm for the D2. Besides, the result of the time-reverse delay-and-sum method is presented in Fig. 5(a) and Fig. 5(b). For single defect, the distance from the acquired to the real D1 is 19.04 mm; for the double damages, the distance from the acquired to the center of D1 and D2 are 29.15 mm and 34.00 mm respectively. From Fig. 5(a) and Fig. 5(b), the damage image is insufficiently precise to clearly find exact positions of the defects especially in double-defect plate. While from the Fig. 4(a) and Fig. 4(b), the flaw locations are well captured with our new weighted method, and the contrast ratio of Fig. 4(b) is higher than the Fig. 5(b). Both in Fig. 4(a) and Fig. 4(b), the maximum image value pixel can indicate the defect position clearly, and the artifact is reduced in the two-defect case compared with the DAS method.
Table 1Damage index of single flaw
Paths | |||||
DI | 0.1402 | 0.1336 | 0.1330 | 0.1287 | 0.1242 |
Paths | |||||
DI | 0.1212 | 0.1202 | 0.1189 | 0.1160 | 0.1010 |
Table 2Damage index of double flaws
Paths | |||||
DI | 0.1695 | 0.1450 | 0.1429 | 0.1386 | 0.1322 |
Paths | |||||
DI | 0.1299 | 0.1228 | 0.1192 | 0.1167 | 0.1129 |
Fig. 4Imaging results of weighted four-point arc method
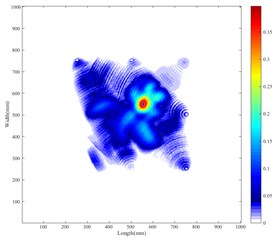
a) Weighted method in single-flaw sample
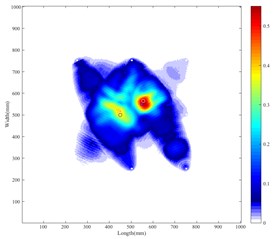
b) Weighted method in double-flaw sample
Fig. 5Imaging results of das method
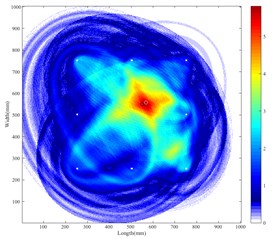
a) DAS in single-flaw sample
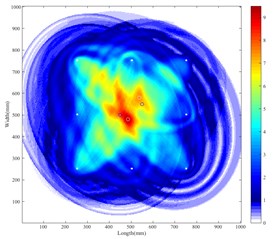
b) DAS in double-flaw sample
Fig. 6Thresholder results of weighted method
a) Weighted method in single-flaw sample
b) Weighted method in double-flaw sample
The location error of the two imaging methods is presented in Table 3 for comparison purpose. As the data in the table shows, it can be seen that the location accuracy of the weighted four-point arc imaging method is higher than the time-reversal DAS method. To facilitate observation, the image is intercepted with the threshold of the 70 % peak value. The thresholder image is shown in Fig. 6. The damage location and area detected by imaging generally match the actual damage situation. The error may produce due to the inaccuracy of group velocity, and the damage index measurement of the sensing paths. It can be limited further by more accurate velocity measurement and improved damage probability method.
Table 3Error of two algorithms
Defects | Single defect | Double defects | |
Algorithm | D1 | D1 | D2 |
Weighted 4-point arc | 5.00 mm | 17.50 mm | 15.81 mm |
Delay-and-sum | 19.04 mm | 29.15 mm | 34.00 mm |
5. Conclusions
The proposed method combines the advantages of four-point arc location algorithm and the damage index probability method. The time reversal process is done for the purpose of focusing the energy of the scatters, and damage index is acquired by calculating the deviation of reconstruction and original signal. Experimental result shows that the method have better location accuracy and more precise defect imaging area compared with the typical delay-and-sum method, which validates the efficiency of the proposed method. In future works, the velocity of the wave can be measured better, and the weight method can be also modified to achieve better performance.
References
-
Alleyne D. N., Cawley P. The interaction of Lamb waves with defects. IEEE Transactions on Ultrasonics Ferroelectrics and Frequency Control, Vol. 39, Issue 3, 1992, p. 381.
-
Chang Z., Mal A. Scattering of Lamb waves from a rivet hole with edge cracks. Mechanics of Materials, Vol. 31, Issue 3, 1999, p. 197-204.
-
Staszewski W. J., Lee B. C., Traynor R. Fatigue crack detection in metallic structures with Lamb waves and 3D laser vibrometry. Measurement Science and Technology, Vol. 18, Issue 3, 2007, p. 727.
-
Wang C. H., Rose J. T., Chang F. K. A synthetic time-reversal imaging method for structural health monitoring. Smart Materials and Structures, Vol. 13, Issue 2, 2004, p. 415.
-
Sohn H., Park H. W., Law K. H., et al. Damage detection in composite plates by using an enhanced time reversal method. Journal of Aerospace Engineering, Vol. 20, Issue 3, 2007, p. 141-151.
-
Liu Z., Zhong X., Dong T., et al. Delamination detection in composite plates by synthesizing time-reversed Lamb waves and a modified damage imaging algorithm based on RAPID. Structural Control and Health Monitoring, Vol. 24, Issue 5, 2017, p. e1919.
-
Xin Li, Gengsheng Luo, Shengrong Long, et al. Location method of acoustic emission by time reversal focusing and enhancing for steel plate. Chinese Journal of Scientific Instrument, Vol. 37, Issue 8, 2016, p. 1792-1799.
-
Qiang Wang, Shenfang Yuan, Lei Qiu, et al. Image representation based on time reversal theory for structure health monitoring. Chinese Journal of Scientific Instrument, Vol. 29, Issue 9, 2008, p. 1816-1821.
-
Park H. W., Kim S. B., Sohn H. Understanding a time reversal process in Lamb wave propagation. Wave Motion, Vol. 46, Issue 7, 2009, p. 451-467.
-
Wang D., Ye L., Lu Y., et al. Probability of the presence of damage estimated from an active sensor network in a composite panel of multiple stiffeners. Composites Science and Technology, Vol. 69, Issue 13, 2009, p. 2054-2063.
-
Sheen B., Cho Y. A study on quantitative lamb wave tomogram via modified RAPID algorithm with shape factor optimization. International Journal of Precision Engineering and Manufacturing, Vol. 13, Issue 5, 2012, p. 671-677.
About this article

This work was supported by the National Natural Science Foundation of China with Grant No. 61671285.
