Abstract
Hybrid impact drilling is a new drilling method proposed in recent years, the PDC (polycrystalline diamond compact) bit impacts the rock in torsional and axial directions during its rotation. From the perspective of field application, hybrid impact drilling can increase the rate of penetration (ROP), especially in hard heterogeneous formations. However, its rock breaking mechanism and difference from torsional impact drilling are not clear, this leads to aimless in choosing these two drilling methods. In this paper, the quasi-3D numerical simulation model of hybrid impact cutting is carried out to investigate the rock breaking mechanism, including the chip formation, mechanical specific energy (MSE) etc. moreover, its comparison with torsional impact cutting is also conducted for evaluating the applicability of these two methods for the same formation. The results show that, the rock breaking efficiency of hybrid impact cutting is higher than torsional impact cutting for shallow depth of cut (DOC), on the contrary, the rock breaking efficiency of hybrid impact cutting is more lower for the medium DOC; but for the deep DOC, both of these two cutting methods cannot improve the rock breaking efficiency. The axial impact amplitude and frequency have large influence on rock breaking efficiency, the optimal axial impact amplitude and frequency exist for specific formation. Both of these drilling methods are not applicable to soft formations. This study leads to an enhanced understanding of rock breaking mechanisms in hybrid impact drilling, and contributes to the improvement in the design of impact tools and determination of the related parameters.
Highlights
- The quasi-3D numerical simulation model of hybrid impact cutting is carried out to investigate the rock breaking mechanism.
- The distinction of rock breaking mechanism of hybrid impact and torsional impact cutting are discussed.
- The optimal axial impact amplitude and frequency of cutter are obtained through the simulation analysis.
1. Introduction
PDC (Polycrystalline diamond compact) bit has been widely used in geological exploration due to its high drilling speed, long working life, good stability and flexible design etc. The PDC bit currently developed are mainly suitable for soft to medium hard homogeneous formations. When drilling deep hard formations, especially soft and hard staggered formations, problems such as low drilling efficiency and short bit life are frequently encountered, or even the fracture of bottom hole assembly (BHA) [1]. The application of torsional impact drilling [2] and rotary percussive drilling [3] methods made it possible for PDC bit to drill through the deep hard formations with a higher ROP. The hybrid impact drilling method is a combination of torsional impact and rotary percussion, that is, high-frequency impact in torsional and axial directions during PDC bit rotation.
The hybrid impact drilling is a new drilling method proposed in recent years, its rock breaking mechanism is vague and its difference from torsional impact drilling method is also unclear, this leads to aimless in choosing these two drilling methods. However, few researches can be found at present, instead, much attentions are focus on the rock breaking mechanism of torsional impact and rotary percussion drilling [4-6]. The high frequency torsional impact drilling as a new drilling technology, it has been got great attention because its merits of raising ROP and restraining the stick-slip vibration in hard formation drilling. From numerous actual field applications, the torsional impact drilling method was been proved has a positive effect on ROP raising. Relative theory researches on its rock breaking mechanism also obtain the same results. These researches such as, Li et al. [7, 8] have conducted the torsional impact tests to analysis the rock failure mechanism, and the results show the torsional impact drilling technology can improve the ROP. Zhu et al. [9, 10] have investigated the effects of high frequency torsional impacts on rock drilling, the numerical simulations and experiment tests were carried out in these analysis. Deen et al. [11], Wedel et al. [12] tested a torsional impact hammer in applications in Western Oklahoma and Southeast Arabian Peninsula, them found that the torsional hammer can reduce the tendency for stick/slip to initiate and can improve on the efficiency of shearing rock failure. In the early 1949, Guarin et al. [13] have discussed the rotary percussion drilling, which covering the influence of weight on bit (WOB) and rotary speed up on performance in various formations. Subsequently, Han and Bruno [14, 15] established a 3D numerical model and analyzed the rock deformation and failure process during the percussion drilling. Li et al. [16] has analyzed the influence of rotary drilling parameters on the efficiency of rock breaking and the relationship between the drilling parameters and the performance parameters of the impactor through the methods of theory and experiment. Powell et al. [17, 18] proposed a new hydraulic impactor which using with PDC bit, and its working principle and ROP rising effect are introduced. Song et al. [19] has optimized the relevant parameters of the impactor (impact frequency and energy), and established the relevant theoretical optimization model and verified the correctness of the model by using experimental results. Xuan et al. [20] and Ma et al. [21] proposed a PDM driven drill string reciprocating percussion concept and developed a downhole rotary percussion drilling device, and its theoretical analysis and ground test were carried out. Wiercigroch et al. [22] put forward a rotary percussion drilling technology RED for hard formation, through a large number of physical experiments and theoretical analysis it was found that RED technology can greatly improve the ROP, making the drill bit adapt to the complex and variable formation conditions. Markandeya et al. [23] proposed a method to improve drilling efficiency and reduce drilling cost by combining the rotary percussion technology and drill bit design theory and drilling parameters, the feasibility of this method is studied by laboratory experiment. Jiang et al. [24] established the rock breaking mechanics model of rotary percussion drilling, and analyzed the stress state of rock under axial force and shear force. Lei et al. [25] developed a self-excited rotary percussion drilling tool, and its performance parameters were tested.
The main objective of this study is investigating the rock breaking mechanism of hybrid impact drilling, analyzing its difference from torsional impact drilling. For this purpose, the quasi-3D numerical simulation model of hybrid impact cutting is performed through the trial and error calibrations using experiment results to investigate the rock breaking mechanism, including the cutting force responses, chip formation, MSE etc., moreover, its comparison with torsional impact cutting is also conducted for evaluating the applicability of these two methods for the same formation.
2. Rock constitutive model and failure criterion
The constitutive description of the rock material remains complex in nature due to the brittleness, anisotropy, abrasion resistance and shear elongation associated with different rocks. There are many models to describe the rock yield criteria, and most of them require many input parameters based on experiment measurement under stringent laboratory conditions. Based on the experimental results, this study used the Drucker-Prager (D-P) yield criterion with relatively fewer parameters [26]. The D-P model is applicable to rock-like materials with the compressive strength larger than the tensile strength:
where is the mean stress, is the Mises equivalent stress, is the inclination angle of yield surface, is the cohesive strength of material.
The constants and can be related to the material properties of geological materials by:
where is friction angle of rock, is cohesive strength of rock.
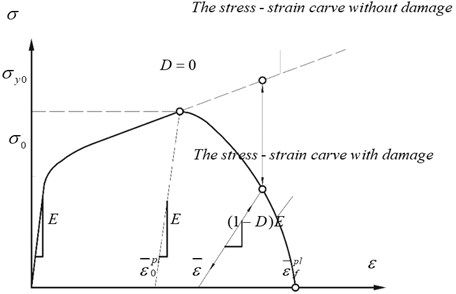
The most key problem of rock cutting simulation is to measure the cutting force responses and chip formation process. During the simulation, the crack initiation and propagation are governed by the value of strain softening, the chips are generated through element erosion. The rock cutting process is totally different with metal machining which a predetermined cutting surface should be created. The new surface generated after cutting lies on the rock properties, hence, an erosion contact model should be employed in the rock model. The elements will be removed by erosion contact model while the stiffness of rock element is completely degraded, which means that the carrying capacity is fully lost. A damage model can be utilized to simulate the degradation of mechanical properties (including rock strength and stiffness) during the loading process. In numerical simulation procedure, the strength degradation of rock range from 0 to 1, the value of 0 represents no damage of rock and the value of 1 illustrates the strength of rock is fully lost.
The initiation and growth of rock damage are governed by the value of plastic strain. The ductile damage criterion is utilized in the rock model, this criterion assumes the rock material starts to damage while the plastic strain value reaches a certain value of , and the strength and stiffness of rock elements are fully lost and separated from the intact rock model if the value of plastic deformation exceeds .
Fig. 1Schematic diagram of isotropic damage mechanism
3. Numerical simulation model of hybrid impact cutting
3.1. Calibration of rock model parameters
A three-dimensional simulation model of rock cutting is presented in Fig. 2(a), which consists of a breakable rock model and a rigid PDC cutter. The PDC cutter has a diameter of 12.7 mm, the dimension of the rock model is 30 mm × 16 mm × 6 mm (length × width × thickness), including 196 530 tetrahedron elements (C3D6) with an average element size of 0.2 mm. The PDC cutter moves forward with a constant velocity of 0.3 m/s, cutting depth of 1 mm and rake angle of 15 degree. The bottom of the rock model remains fixed in the direction, the left and right sides are constrained in the direction, while the front and back surfaces are constrained in direction. Ya’an granite is used in this numerical simulation procedure, and its physical mechanical parameters are listed in Table 1, including Brazilian test strength (BTS), Uniaxial compressive strength (UCS), Elastic modulus, Poisson’s ratio, Cohesion and Friction angle.
Table 1Physical mechanical parameters of Ya’an granite
Rock type | BTS (MPa) | UCS (MPa) | Elastic modulus (MPa) | Poisson’s ratio | Cohesion strength (MPa) | Friction angle (°) |
Ya’an granite | 6.678 | 126.519 | 31783 | 0.118 | 13.7 | 45.29 |
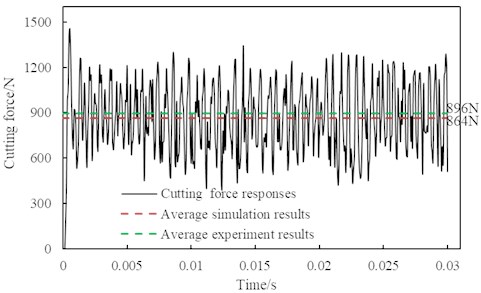
Fig. 2(b) presents the rock cutting setup, it has a large stiffness to resistance the deformation and vibration during cutting Ya’an granite. The cutting force obtained from the rock cutting experiments are utilized to calibrate the numerical simulation model mainly through a trial-and-error process. The cutting parameters (such as rake angle, DOC, cutting velocity, cutter size) in numerical simulations are same with the experimental tests. Fig. 3 plotted the cutting force responses monitored from the simulations and experiments, the average value of simulation result is 864 N, and the average value of experiment result is 896 N, 3.7 % errors between experiment result and simulation result, which verifies the reliability of numerical simulation of rock cutting.
Fig. 2Schematic diagram of simulation model and rock cutting setup
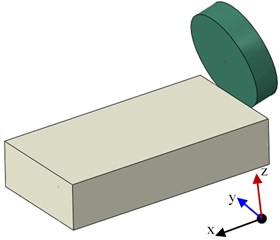
a) Schematic of simulation model
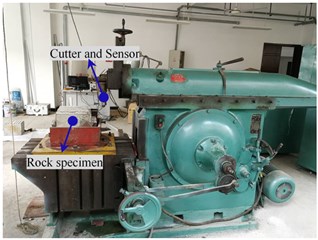
b) Rock cutting setup
Fig. 3The comparison of experimental results and simulation results
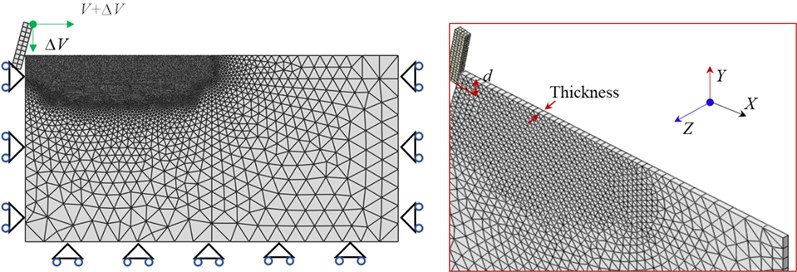
In order to reproduce the formation of rock chips and initiation and propagation of cracks, a plane strain model of rock cutting is carried out based the above analysis. The rock model has specified thickness in the -direction with a single layer of 3D element is used to well capture the rock breaking process, it has the size of 40 mm × 20 mm × 0.1 mm (length × width × thickness), see Fig. 4. The rock model adopts C3D6 elements similar to the three-dimensional simulation model mentioned above, as well as the boundary conditions. In traditional rock cutting process, the cutter moves horizontally with the cutting velocity, , of 0.3 m/s, rake angle of 15 degree and the DOC ranges from 0.2 mm to 1.5 mm. In contrast, the cutter suffers impact forces in axial and torsional directions in hybrid impact cutting process, leading a periodic impact velocity, , in these two directions, the period is 2 ms. The numerical procedure implements an erosion contact model in the rock material model to describe the generation of the new surface during the rock cutting process.
Fig. 4Numerical simulation model of quasi-3D rock cutting
3.2. Mechanical specific energy calculation
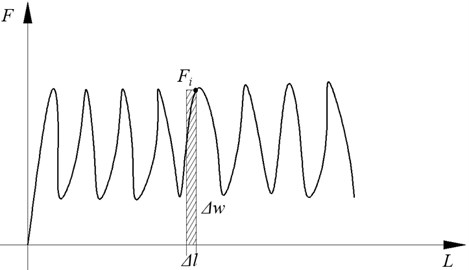
MSE refers to the energy consumed by removing a unit volume of rock, which is an important index for evaluating rock breaking efficiency of drill bit [27]. The move distance of cutter in rock cutting can be divided into n tiny parts of displacement, see Fig. 5:
where, represents the move displacement of each part.
The work done by the cutter in each tiny displacement is:
The total work done by the cutter can be expressed as:
The volume of removed rock material in rock cutting is:
Combined with the above Eqs. (8) and (9), the MSE is given by:
where, represents the move distance of cutter; represents the work done by the cutter in each tiny displacement; represent the cutting force in each tiny displacement, it is postulated as a constant; represents the volume of removed rock by cutting; represents the contact area between cutter and rock surface; represents the magnitude of MSE.
Fig. 5The work done by the cutter in each tiny displacement
4. Simulation results of granite cutting
In the simulation of hybrid impact cutting, two concepts are defined, impact amplitude and impact frequency. The impact amplitude in torsional direction is defined as the ratio of maximum impact velocity to the cutting velocity, the impact amplitude in axial direction is defined as a axial displacement. In addition, the impact frequency is simplified as impact times.
4.1. Effect of cutting depth
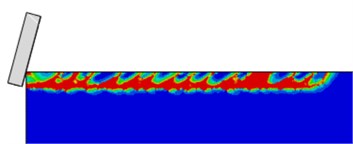
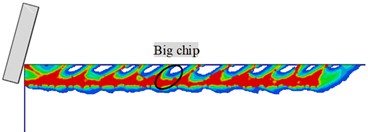
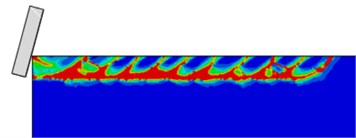
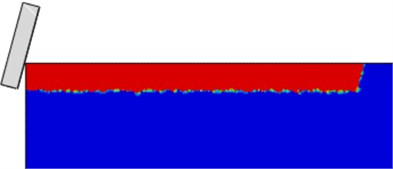
Fig. 6 presents the rock failure mode under different cutting depths, 0.2 mm, 0.5 mm, 0.8 mm, 1.0 mm, 1.2 mm, 1.5 mm, respectively. The impact amplitude in torsional and axial directions are 1.1 and 0.1 mm respectively, and the impact frequency is 4 times. As the figures illustrate, no obvious rock chips formation occurs when the cutting depth is relatively shallow; with the cutting depth increases, the big rock chips will be formed and separated from the virgin rock. These phenomenon imply the rock failure mode changes from ductile-dominated failure to brittle-dominated failure with the cutting depth increases. The simulation results are good agreement with the results observed from the experimental tests [28, 29].
Fig. 6The rock breaking mode under different cutting depths
a) Cutting depth 0.2 mm

b) Cutting depth 0.5 mm
c) Cutting depth 0.8 mm

d) Cutting depth 1.0 mm

e) Cutting depth 1.2 mm

f) Cutting depth 1.5 mm
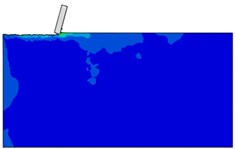
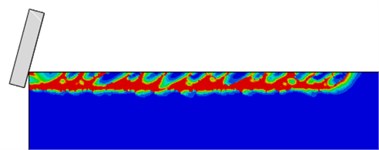
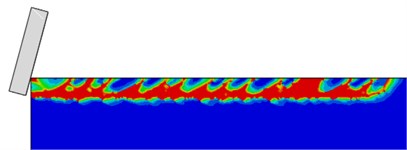
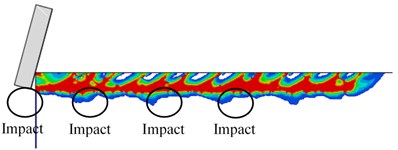
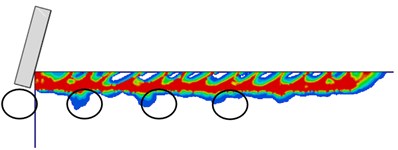
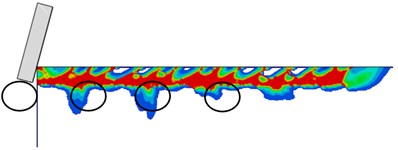
Fig. 7 shows the rock damage and chips formation in rock cutting process. The red area represents the fully damaged zone of rock, the damage value equals 1. The other areas which damage value less than 1 denotes the rock chips formation during the cutting process, just as the black circle marked in Fig. 7(e). Just as Fig. 7(a) and Fig. 7(b) show, the rock mainly takes place ductile-dominated failure when the cutting depth is shallow, the rock element fully damaged after cutting. When the cutting depth increases to 0.8 mm, obvious cutting chips start to generate.
Fig. 7The damage and rock chips formation in cutting process
a) Cutting depth 0.2 mm
b) Cutting depth 0.5 mm
c) Cutting depth 0.8 mm
d) Cutting depth 1.0 mm
e) Cutting depth 1.2 mm
f) Cutting depth 1.5 mm

Fig. 8The cutting force responses monitored under cutting depth of 0.2 mm and 0.5 mm
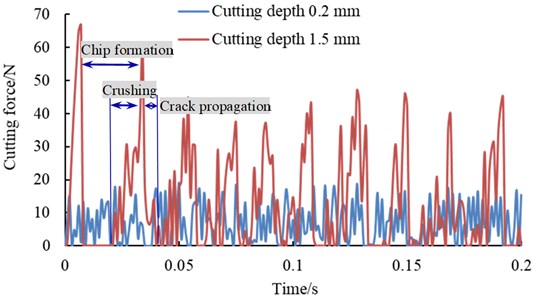
Fig. 8 plotted the cutting force responses monitored in rock cutting simulations under cutting depth of 0.2 mm and 1.5 mm. For the relatively deep cutting depth of 1.5 mm, the cutting force curve fluctuates with respect to time. The peaks of the cutting force curve imply a higher surface energy status of rock, after then, a big chip generates and separates from the virgin rock, leading the cutting force suddenly drops. The crushing mechanism occurs after the separation of chips with small variations and relatively small magnitude cutting force fluctuation. The cutting force curves also indicates that the shearing and crushing mechanisms are occurring in an alternating manner. Fig. 9 compares the average cutting force of torsional and hybrid impact cutting under different cutting depths. It indicates that the average cutting force increases almost linearly with increasing DOC while the cutting depth is shallow. However, the non-linear relationship gradually presented with the cutting depth becomes larger.
Fig. 9The average cutting force of torsional and hybrid impact cutting under different cutting depths
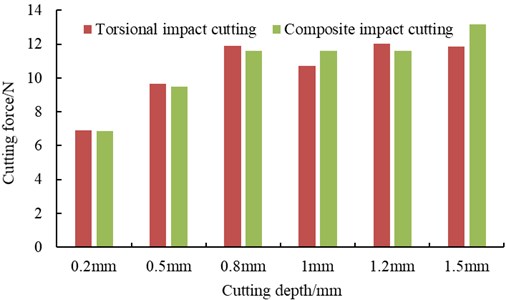
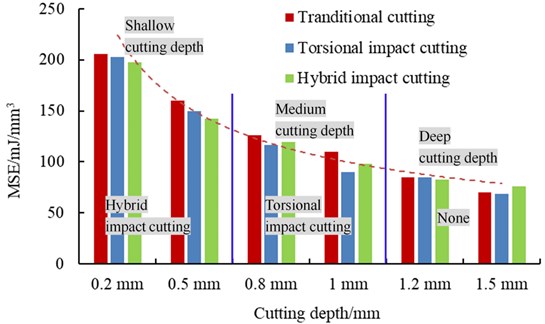
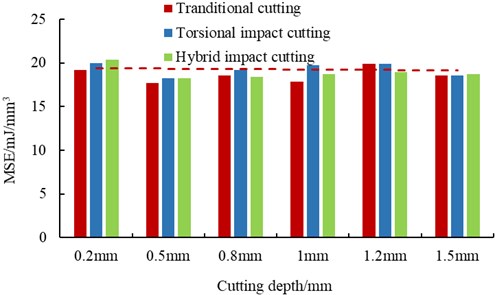
Fig. 10 illustrates the magnitude of MSE for traditional cutting, torsional impact cutting and hybrid impact cutting. The magnitude of MSE decreases with increasing the cutting depth and then nearly leveled. The method of torsional impact cutting and hybrid impact cutting both have a smaller value of MSE when the cutting depth does not exceed 1.2 mm, which means both of these rock breaking methods can rising the ROP. Moreover, the magnitude of MSE for hybrid impact cutting is smaller than torsional impact cutting only when the cutting depth is shallow, which means hybrid impact cutting method is recommended. Similarly, the torsional impact cutting method is recommended while the cutting depth is medium. However, for the deep cutting depth, these three rock cutting methods have no obvious difference, therefore, there is none optimal rock breaking method recommended. The reason why these three rock cutting methods have no obvious difference is that, rock cutting with a large DOC leads to the rock failure in brittle-dominated mode, as a consequence, the impact of cutter cannot causes obvious brittle failure of rock anymore, that is to say the cutter impact has less influence on increasing brittle failure of rock than DOC. In contrast, when the cutting depth is shallow and medium, the rock fails in ductile-dominated or a mixture of these two failure modes, the cutter impact has more influence on increasing brittle failure of rock than DOC. These results are interesting and can offer a reference to the drilling engineers for improving the drilling efficiency.
Fig. 10The magnitude of MSE for traditional cutting, torsional impact cutting and hybrid impact cutting
4.2. Effect of impact amplitude
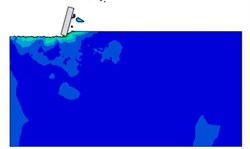
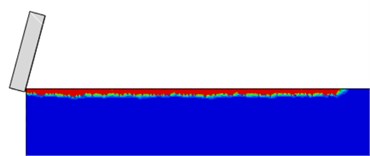
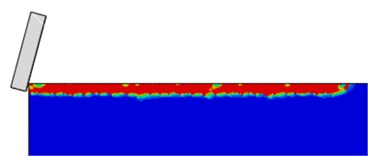
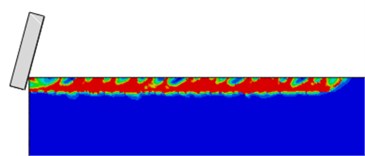
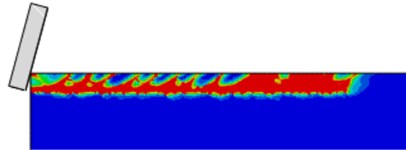
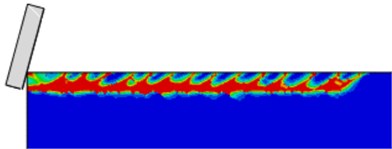
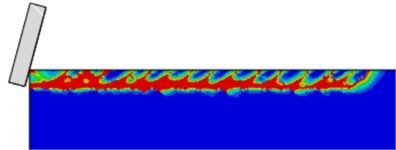
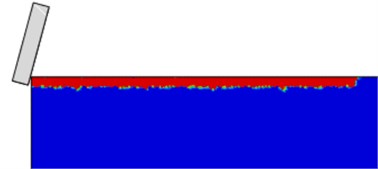
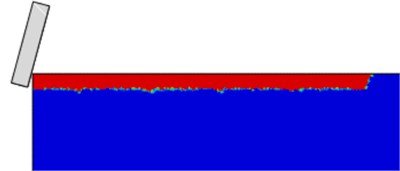
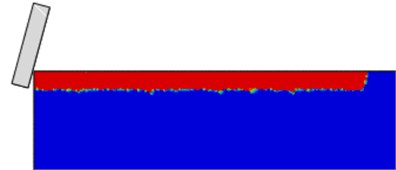
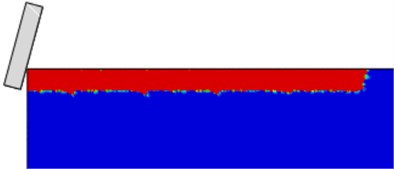
Fig. 11 presents the rock failure mode under different axial impact amplitudes, 0.1 mm, 0.2 mm, 0.3 mm, 0.4 mm, 0.5 mm, respectively. The impact parameters in torsional direction keep constant. With the axial impact amplitude increases, the rock damage beneath the cutter becomes obviously, just as the black circle marked in Fig. 11(c), (d), (e). The axial impact does not make a crushing pit instead of a damaged zone, that means the impact energy of cutter is absorbed by damaged zone of rock without causing brittle fracture.
Fig. 11The rock failure mode under different axial impact amplitude
a) Axial impact amplitude 0.1 mm
b) Axial impact amplitude 0.2 mm
c) Axial impact amplitude 0.3 mm
d) Axial impact amplitude 0.4 mm
e) Axial impact amplitude 0.5 mm
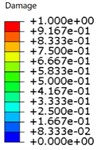
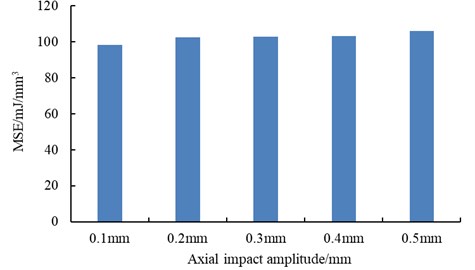
Fig. 12 depicted the magnitude of MSE under different axial impact amplitudes. The value of MSE under different axial impact amplitudes are 98.2 mJ/mm3, 102.4 mJ/mm3, 102.9 mJ/mm3, 103.4 mJ/mm3, 105.9 mJ/mm3, respectively. The results show that the magnitude of MSE is the smallest when the impact amplitude is 0.1 mm, moreover, it indicates that the axial impact amplitude is no need too large because it cannot induce corresponding rock breaking volume, resulting in the relatively large MSE eventually.
Fig. 12The magnitude of MSE under different axial impact amplitude
4.3. Effect of impact frequency
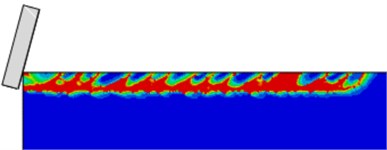
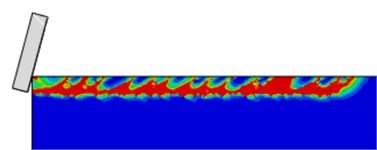
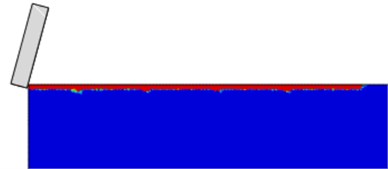
Fig 13 shows the rock failure modes under different axial impact frequencies (the impact frequency simplified as impact times, 1 time, 2 times, 3 times, 4 times and 5 times, respectively). The rock failure modes are obviously different at different axial impact times. Rock fails in more ductile mode when axial impact 1 time, in contrast, the relatively less ductile failure of rock is presented when axial impact 2 times and 3 times.
Fig. 13The rock failure mode different axial impact times
a) Axial impact 1 time
b) Axial impact 2 times
c) Axial impact 3 times
d) Axial impact 4 times
e) Axial impact 5 times

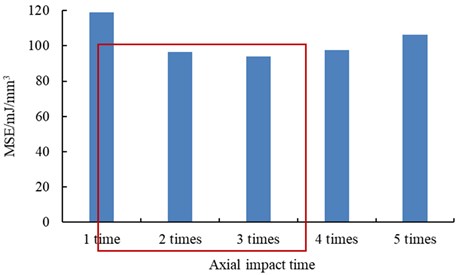
Fig. 14 plotted the magnitude of MSE under different axial impact times, the value equals 118.8 mJ/mm3, 96.5 mJ/mm3, 94 mJ/mm3, 97.4 mJ/mm3, 106.2 mJ/mm3, respectively. The MSE is larger when axial impact 1 time and 5 times than it when the axial impact time is 2, 3 and 4, among them the magnitude of MSE is the smallest when the axial time is 3.
Fig. 14The magnitude of MSE under different axial impact times
5. Simulation results of sandstone cutting
Fig. 15 presents the rock failure mode of Nanchong sandstone under different cutting depths. The cutting depths are 0.2 mm, 0.5 mm, 0.8 mm, 1.0 mm, 1.2 mm, 1.5 mm, respectively. The sandstone mainly occurs ductile failure mode, which is independent of the cutting depth (range from 0 to 1.5 mm). Comparing with the granite, no obvious chips formation in sandstone cutting, instead of the powder-like chips. The physical parameters of Nanchong sandstone are listed in Table 2.
Table 2Physical parameters of Nanchong sandstone
Rock type | BTS (MPa) | UCS (MPa) | Elastic modulus (MPa) | Poisson’s ratio | Cohesion strength (MPa) | Friction angle (°) |
Ya’an granite | 2.836 | 50.565 | 5220 | 0.111 | 11.69 | 35.45 |
Fig. 15The rock failure mode under different cutting depth
a) Cutting depth 0.2 mm
b) Cutting depth 0.5 mm
c) Cutting depth 0.8 mm
d) Cutting depth 1.0 mm
e) Cutting depth 1.2 mm
f) Cutting depth 1.5 mm

Fig. 16 depicted the magnitude of MSE for traditional cutting, torsional impact cutting and hybrid impact cutting. The MSE almost independent of the cutting depth (range from 0 to 1.5 mm) in sandstone cutting, it nearly keeps the same value. This phenomenon is different from the granite, that means the torsional impact cutting or hybrid impact cutting methods cannot rising the ROP when drilling Nanchong sandstone formation or the soft rock formation similar to Nanchong sandstone.
Fig. 16The magnitude of MSE for traditional cutting, torsional impact cutting and hybrid impact cutting
6. Conclusions
This study mainly attempts to investigate the rock breaking mechanism of hybrid impact cutting, moreover, its comparison with torsional impact cutting is also conducted for evaluating the applicability of these two methods for the same formation. The following conclusions can be summarized:
1) In granite cutting, no obvious rock chips were observed when the cutting depth is relatively shallow; with the cutting depth increases, the big rock chips will be formed and separated from the virgin rock.
2) In granite cutting, the rock breaking efficiency of hybrid impact cutting is higher than torsional impact cutting for shallow DOC; on the contrary, the rock breaking efficiency of hybrid impact cutting is more lower for the medium DOC; for the large cutting depth, both of these two drilling methods cannot improve the rock breaking efficiency.
3) The axial impact amplitude and frequency have significant influence on rock breaking efficiency, the optimal axial impact amplitude and frequency exist for specific formation. Both of these drilling methods are not applicable to soft formations.
References
-
Warren T. M., Oster J. H. Torsional resonance of drill collars with PDC bits in hard rock. SPE Annual Technical Conference, 1998.
-
Clayton R. Hammer tools and PDC bits provide stick-slip solution. Hart’s E & P, 2010.
-
Powell S. W., Herrington D., Botton B., et al. Fluid hammer increases PDC performance through axial and torsional energy at the bit. SPE Annual Technical Conference and Exhibition, 2013.
-
Pletcher J. P., Scarr A., Smith J., et al. Application of air percussion drilling improves drilling efficiency in horizontal sandstone wells. SPE Annual Technical Conference and Exhibition, 2010.
-
Sun L. D., Zhou C. N., Zhu R. K., et al. Formation, distribution and potential of deep hydrocarbon resources in China. Petroleum Exploration and Development, Vol. 40, Issue 6, 2013, p. 687-695.
-
Xuan L., Guan Z., Hu H. Analysis and improvement of the rotary percussion drilling tool in oil wells. International Symposium on Material, Energy and Environment Engineering, 2015.
-
Li Wei, Yan Tie, Zhang Zhichao, et al. Rock response mechanism and rock breaking test analysis for impact of high frequency vibration drilling tool. Petroleum Drilling Techniques, Vol. 41, Issue 6, 2013, p. 25-28.
-
Li Wei, He Xuanpeng, Yan Tie, et al. Rock fragmentation mechanism and application of near-bit torsion impacter. Oil Drilling and Production Technology, Vol. 36, Issue 5, 2014, p. 1-4.
-
Zhu X., Tang L. Development of a high-frequency torsional impact generator for improving drilling efficiency. Proceedings of the Institution of Mechanical Engineers, Part C: Journal of Mechanical Engineering Science, Vol. 228, Issue 11, 2014, p. 1968-1977.
-
Zhu X., Liu W. The rock breaking and ROP rising mechanism for single-tooth high-frequency torsional impact cutting. Acta Petrolei Sinica, Vol. 38, Issue 5, 2017, p. 578-586.
-
Deen C. A., Wedel R. J., Nayan A., et al. Application of a torsional impact hammer to improve drilling efficiency. SPE Annual Technical Conference and Exhibition, 2011.
-
Wedel R., Mathison S., Hightower G., et al. Mitigating bit related stick slip with a torsional impact hammer. Proceedings of the AADE National Technical Conference and Exhibition, 2011.
-
Guarin P. L., Arnold H. E., Harpst W. E., et al. Rotary percussion drilling. Drilling and Production Practice, 1949.
-
Han G., Bruno M., Lao K. Percussion drilling in oil industry: review and rock failure modelling. The AADE National Technical Conference and Exhibition, 2005.
-
Han G., Bruno M., Dusseault M. B. Dynamically modelling rock failure in percussion drilling. 40th US Symposium on Rock Mechanics (USRMS), 2005.
-
Li G. H., Bao H. Z., Tao X. H. Effects of drilling conditions on crushing rocks while rotary percussion drilling. Petroleum Drilling Techniques, Vol. 32, Issue 2, 2004, p. 4-7.
-
Powell S. W., Ertai H. Hydraulic percussion drilling system with PDC bit increases ROP and lowers drilling cost. SPE Middle East Unconventional Resources Conference and Exhibition, 2015.
-
Powell S., Garcia A., Barocio H., et al. Percussion drilling system combined with hybrid PDC bit increases ROP and interval drilled on Taoudenni basin well in Mauritania. SPE/IADC Drilling Conference and Exhibition, 2015.
-
Song C., Chung J., Kim J. H., et al. Design optimization of a drifter using the Taguchi method for efficient percussion drilling. Journal of Mechanical Science and Technology, Vol. 31, Issue 4, 2017, p. 1797-1803.
-
Xuan L., Guan Z., Hu H., et al. The principle and application of a novel rotary percussion drilling tool drived by positive displacement motor. IADC/SPE Asia Pacific Drilling Technology Conference, 2016.
-
Ma G. J., Zhang H. P., Wang J. C. Designed and testing of the positive displacement motor driven rotary percussion drilling device. China Petroleum Machinery, Vol. 44, Issue 6, 2016, p. 24-27.
-
Wiercigroch M., Vaziri V., Kapitaniak M. RED: revolutionary drilling technology for hard rock formations. SPE/IADC Drilling Conference and Exhibition. Society of Petroleum Engineers, 2017.
-
Markandeya S., Merchant D., Sha D., et al. Optimized PDC bit designs for percussion performance drilling system deliver higher penetration rates. Offshore Technology Conference Asia, 2016.
-
Jiang H. W., Liu Y. S., Zhai Y. H., et al. Research on rock crushing mechanics model in rotary and percussive drilling. Petroleum Drilling Techniques, Vol. 34, Issue 1, 2006, p. 13-16.
-
Lei P., Ni H. J., Wang R. H., et al. Field test of self-excited vibration rotary percussion drilling tool in deep and ultra-deep wells. Petroleum Drilling Techniques, Vol. 41, Issue 6, 2013, p. 40-43.
-
Liu W., Qian X., Li T., et al. Investigation of the tool-rock interaction using Drucker-Prager failure criterion. Journal of Petroleum Science and Engineering, Vol. 173, 2019, p. 269-278.
-
Teale R. The concept of specific energy in rock drilling. International Journal of Rock Mechanics and Mining Sciences and Geomechanics Abstracts, Vol. 2, Issue 1, 1965, p. 57-73.
-
Liu W., Zhu X., Li B. The rock breaking mechanism analysis of rotary percussive cutting by single PDC cutter. Arabian Journal of Geosciences, Vol. 11, Issue 9, 2018, p. 192.
-
Liu W., Zhu X., Jing J. The analysis of ductile-brittle failure mode transition in rock cutting. Journal of Petroleum Science and Engineering, Vol. 163, 2018, p. 311-319.
Cited by
About this article

This study is supported by the Open Fund (10010099-18-ZC0607-0025) of State Key Laboratory of Shale Oil and Gas Enrichment Mechanisms and Effective Development, Scientific Research Starting Project of SWPU (2018QHZ015), Applied Basic Research of Sichuan Province (Free Exploration-2019YJ0520), National Natural Science Foundation of China (Grant No. 51674214). Such supports are greatly appreciated by the authors.
