Abstract
We obtained the corroded steel bars by conducting electrically-accelerated corrosion tests. Then, to investigate the effects of the corrosion ratio and the stress amplitude on the fatigue life, and to further study the damage evolution law under corrosion and fatigue loads, we performed axial fatigue tests on 13 steel bars with various corrosion ratios. The laboratory results show that the fatigue life is logarithmical linear to the stress amplitude, and the increase in corrosion ratio leads to the accelerated decrease in the fatigue life. In addition, the increase in stress amplitude can accelerate the fatigue damage, and further decreases the fatigue life. With the laboratory data, we further established a model to predict the fatigue life of the steel bars with various corrosion ratios. The evolution of the residual strains includes the relatively rapid increase, stable increase and rapid increase stages. Moreover, we developed an evolution equation for the residual strain, and this equation can properly describe the laboratory results. Furthermore, considering the fatigue damage, we proposed a constitutive model to describe the stress-strain curve of the corroded steel bar under static tension. The comparison shows that the calculated stress curves agree well with the laboratory curves.
Highlights
- The increase of the corrosion ratio decreases the fatigue life.
- A prediction model for the fatigue life of the corroded steel bar under various stress amplitudes is established.
- The development of the residual strain includes the relatively rapid increase, stable increase and rapid increase stages.
- The constitutive model, considering fatigue damage, was established by defining the fatigue damage variant.
1. Introduction
The ingressions of the CO2 and the chloride ion, from the voids of the concrete, frequently decrease the pH value in the reinforced concrete of the bridge, and further damage the passivated film of the steel bars. Then, corrosion occurs when the steel reacts with oxygen and water. Besides the dead load, repeated loads, resulting from the vehicles, may act on the bridge. Therefore, the variations in the vehicle weight and density may cause fatigue loads on the steel bars. Clearly, the adaptation, the safety and the fatigue life of these steel bars, exposed to corrosion and fatigue loads, may significantly decrease. Thus, the laboratory investigation on the damage evolution law of the reinforced concrete, exposed to corrosion and fatigue loads, may contribute to the safety analysis and the fatigue life prediction.
Brittle failure is the main fatigue failure pattern for the reinforced concrete beam [1, 2]. First, the corrosion of the steel bar increases the brittle failure risk. Previous studies have investigated the relation between the corrosion depth and the strength, the ductility and the corrosion ratio of the steel bar [3-5]. Some studies have also studied the effect of the corrosion depth on the mechanical properties of the corroded steel bar [6, 7]. Silvia [8] proposed that the energy, consumed in the fatigue tests, decreases with the increase in the corrosion ratio. Apostolopoulos [9, 10] stated that the corrosion ratio significantly affects the strength, ductility and fatigue life of the steel bars under low frequency loads. In addition, Cao [11] and Li [12] conducted fatigue tests on corroded steel bars, and further proposed a curve of the fatigue stress amplitude () and the fatigue life (). Zhang [13] and Li [14] found that the increase in corrosion ratio decreases the fatigue strength, the ductility and the fatigue life of the naturally and man-made corroded steel bars. Moreover, Zhang [15] stated that the fatigue process of the steel bar includes three stages. Liu [16] established a damage evolution equation for the rectangular reinforced concrete. The above studies significantly contribute to understanding the effect of corrosion ratio or fatigue load on the strength, the ductility and the fatigue life of the steel bars. However, the coupled influence of the corrosion and the fatigue load on the damage evolution lacks detail investigations. Furthermore, because of the corrosion and fatigue loads, the strength, the stiffness and the ductility of the steel bars may continuously decrease. Correspondingly, the stress-strain curve of the steel bar varies. Fernandez [17] investigated the influence of the corrosion ratio on the constitutive relation. Wu [18] and Zhang [19] established a constitutive equation based on the static tension tests. Zhang [20] conducted fatigue tests and static tension experiments to study the effect of corrosion ratio and fatigue loads on the constitutive law. The results showed that the increase of the corrosion ratio reduces the yield stage, and the increase in the fatigue cycles will shrink the ultimate deformation. However, the effect of the accumulated damage, caused by corrosion and fatigue loads, on the constitutive law lacks sufficient investigations. Additionally, the proposed models fail to describe the stress-strain curve of the corroded steel bars, after fatigue loads.
In the present article, we conducted electrically-accelerated corrosion tests, axial fatigue tests, and static tension tests to investigate the degeneration features of the fatigue life and the evolution characteristics of the residual strain of the corroded steel bars. In addition, we proposed a prediction equation for fatigue life, and an evolution equation for the residual strain. The damage variable is defined by using the fatigue residual strain of corroded steel bars, and the stress-strain constitutive relation of steel bars considering the damage variable is established.
2. Laboratory tests
2.1. Laboratory preparation
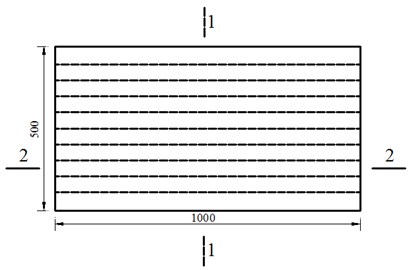
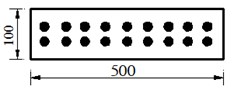
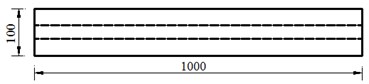
The diameter, the yield strength and the ultimate strength of the HRB 335 steel bars, with the same length, were 16 mm, 425 MPa and 557.5 MPa, respectively. To simulate the corroded steel bars in the practical reinforced concrete, the steel bars were embedded in the concrete plate, with the dimension of 1000 mm×500 mm×100 mm (Fig. 1). Then, the steel bars were electrically corroded. According to the Faraday’s law, we obtained the corroded steel bars with specific corrosion ratios by controlling the conduction time. Table 1 lists the conduction time and the corresponding current intensity. In addition, the ends of the steel bars were wax-sealed to avoid failure in the fatigue tension tests (Fig. 2).
Fig. 1Steel bars in slab specimens
a)
b)
c)
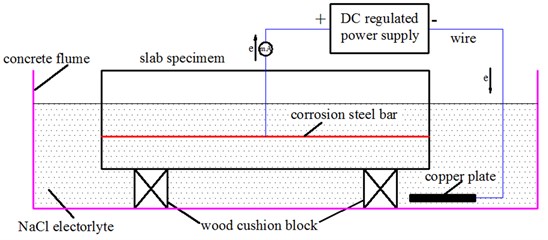
In the electrical corrosion tests, the reinforced concrete plate was submerged in the NaCl solution with a concentration of 5 %. Then, the steel bar and the copper plate were connected to the positive and negative anodes of the power supply, respectively (Fig. 3). The ampere density in the tests was about 150 μA·mm-2. When the conduction time reached to the preset values, we separated the corroded steel bars from the reinforced concrete, and then removed the concrete residuals and steel rusts of the corroded steel bars. Subsequently, we saturated the corroded steel bars in the hydrochloric acid solution with a concentration of 12 % to solve the rusts. Then, after the washing by clean water, the saturation in limewater for neutralization, the second washing and the drying in the oven in sequence, the steel bars were weighted.
Fig. 2Corroded specimens
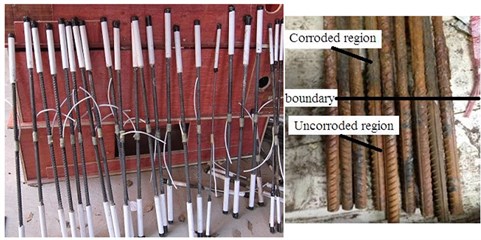
Fig. 3Schematic of the electrical corrosion test
2.2. Loading modes
The PM-500 hydraulic fatigue machine was applied in the fatigue tests. The steel bars were fixed on the prefabricated reaction frame which can transmit axial fatigue loads to the steel bars. According to the previous study [21], the allowed stress amplitude in the fatigue tests is usually 155 MPa. Based on the previous studies [13, 14], the fatigue stress amplitude for the corrosion ratios of 0, 3 %, 6 %, 9 %, 12 % and 15 % was 200 MPa. In addition, we applied two stress amplitudes of 240 MPa and 280 MPa on the specimens with the corrosion ratios of 9 %, 12 % and 15 %. To avoid vibration of the testing apparatus, the loading frequency was 3 Hz.
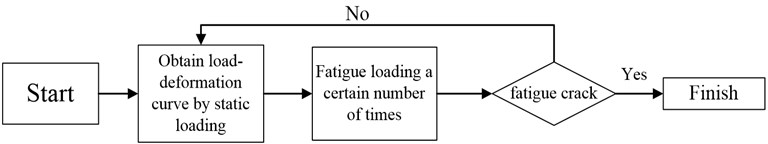
In addition, to study the residual strain after specific load cycles, we ceased the load process every specified cycles, measured the stable residual strain, and restarted the load process until fatigue failure occurred. Moreover, to determine the static mechanical properties of the corroded steel bars, axial tension tests on six corroded steel bars, with various corrosion rates and the stress amplitude of 200 MPa, were conducted. Fig. 4 shows the corresponding test procedures.
Fig. 4Procedures of the axial fatigue tests
3. Test results
3.1. Fatigue test results
Axial fatigue tests were performed on the steel bars, containing relatively even corroded grooves. In total, we conducted 13 successful tests, characterized by the fatigue failure at the middle part instead of the ends. Table 1 shows the corresponding test parameters and results.
Table 1Fatigue characteristics of steel bar with different corrosion ratios
Specimen | Conduction time, (h) | Current intensity, (mA/cm2) | Corrosion rate, (%) | Stress amplitude, (MPa) | Number of cycles prior to fracture, (N) | Fatigue life ratio | |
Expected | Measured | ||||||
GJ 1 | 0 | 0 | 0 | 0 | 200 | 1648352 | 100 % |
GJ 2 | 72 | 0.774 | 3 | 3.87 | 200 | 803359 | 48.7 % |
GJ 3 | 144 | 0.769 | 6 | 6.78 | 200 | 645446 | 39.1 % |
GJ 4 | 264 | 0.723 | 9 | 9.47 | 200 | 563417 | 34.1 % |
GJ 5 | 264 | 0.702 | 9 | 9.23 | 240 | 127467 | 7.73 % |
GJ 6 | 264 | 0.663 | 9 | 8.86 | 280 | 36141 | 2.19 % |
GJ 7 | 216 | 0.995 | 12 | 12.32 | 200 | 477298 | 28.9 % |
GJ 8 | 216 | 0.998 | 12 | 12.46 | 240 | 103214 | 6.26 % |
GJ 9 | 216 | 0.990 | 12 | 11.54 | 280 | 26845 | 1.63 % |
GJ 10 | 288 | 0.935 | 15 | 15.35 | 200 | 342538 | 20.8 % |
GJ 11 | 288 | 0.965 | 15 | 17.2 | 200 | 125653 | 7.6 % |
GJ 12 | 288 | 0.951 | 15 | 16.66 | 240 | 75822 | 4.6 % |
GJ 13 | 288 | 0.928 | 15 | 14.96 | 280 | 21104 | 1.3 % |
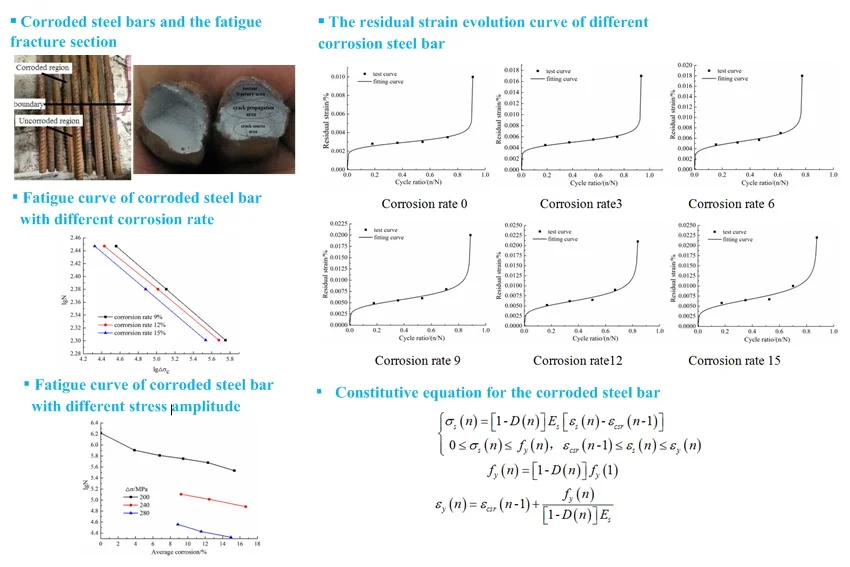
3.2. Failure characteristics of the corroded steel bars
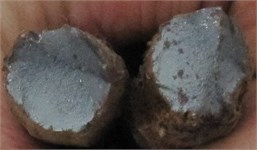
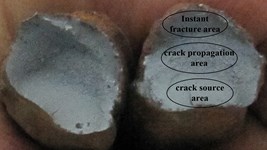
Brittle failure, characterized by the smooth failure surface and no necking, occurred (Fig. 5). Clearly, the failure section included the source area of the crack, the crack propagation area and the instant fracture area. Frequently, failure occurred on the section with relative large corrosion ratio or on the interface between the corroded and intact steel parts.
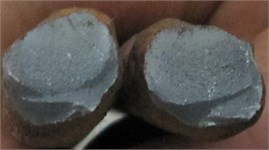
Fig. 5Fatigue fracture section of corroded steel bars
a) Fatigue failure for steel GJ2
b) Fatigue failure for steel GJ6
c) Fatigue failure for steel GJ7
3.3. Curves of the stress amplitude and fatigue life for various corrosion ratios
The function of the fatigue life () and the stress amplitude (), in the form of - curve, can properly illustrate the results of the fatigue tests. In the present article, considering the even section loss of the corroded steel bars, the stress amplitude () was substituted by the nominal stress amplitude () which was calculated according to the residual section area after corrosion. Thus, Eq. (1) can properly depict the relation between and :
where and are the fatigue life and the nominal stress amplitude; and are corresponding coefficients concerning corrosion ratio.
After conducting linear regression analysis, the corresponding fatigue coefficients (A and m) and the correlation coefficient () of the laboratory results (Table 1) are shown in Fig. 6 and Table 2.
Table 2Fatigue coefficient of corroded steel bar
No | Steel type | Corrosion rate / % | |||
1 | HRB335Ф16 | 9 | 24.5334 | 8.1626 | 0.999 |
2 | HRB335Ф16 | 12 | 25.3540 | 8.2824 | 0.999 |
3 | HRB335Ф16 | 15 | 24.5931 | 8.5490 | 0.999 |
Fig. 6Fatigue curve of corroded steel bar
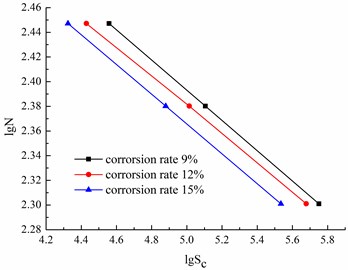
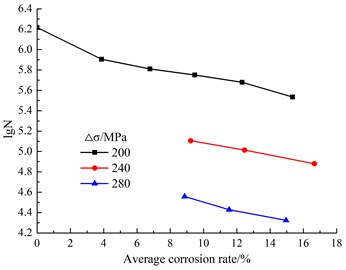
Fig. 7Influences of average corrosion ratio of steel bar on fatigue life
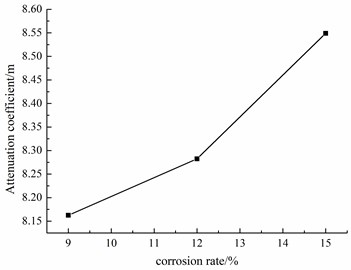
The correlation coefficients (higher than 0.99 in Table 2) show that the fatigue stress amplitude is linear to the fatigue life. In addition, the degeneration index exponentially increases with the increase in corrosion ratio (Fig. 8). This phenomenon indicates that the bearing area of the steel bars decreases with the increase in the corrosion ratio, thus, the increase of the stress amplitude may accelerate the fatigue damage of the steel bars. Correspondingly, the degeneration of the fatigue life is accelerated.
Fig. 8Attenuation coefficient with different corrosion rate
For various stress amplitudes, the fatigue life exponentially decreases with the increase in corrosion ratio (Fig. 7). The decrease ratios of the fatigue life for the corrosion ratios of 3.87 %, 6.78 %, 9.47 %, 12.32 % and 15.35 % were 51.26 %, 60.84 %, 65.82 %, 71.04 % and 79.22 %, respectively, when the stress amplitude was 200 MPa. When the stress amplitude increased to 240 MPa, the decrease ratios of the fatigue life, compared to those for the stress amplitude of 200 MPa, were 77.37 %, 78.38 % and 77.86 % when the measured corrosion ratios were 9.23 %, 12.46 % and 16.66 %, respectively. When the stress amplitude further increased to 280 MPa, the corresponding decrease ratios, compared to those for the stress amplitude of 200 MPa, were 93.58 %, 94.37 % and 93.83 % when the measured corrosion ratios were 8.86 %, 11.54 % and 14.96 %, respectively. Thus, we can infer that the simultaneous increases of the corrosion ratio and stress amplitude can significantly increase the degeneration rate of the fatigue life.
3.4. The prediction model of the fatigue life
The sectional corrosion ratios and the stress amplitudes for the tested corroded steel bars were different. Thus, the establishment of the calculation equation, simultaneously considering the corrosion ratio and the stress amplitude, may contribute to predicting the fatigue life of the corroded steel bar under fatigue loads. According to the laboratory results, the fatigue curve of the corroded steel bars in the log-log coordinate system is a straight line (Fig. 6). In addition, assuming that the coefficients (A and m) are linear to the sectional corrosion ratio, , we can obtain the equations of the fatigue curve [13, 14]:
thus, Eqs. (2), (3) and (4) can be uniformly expressed as:
Therefore, Eq. (5) can be used to calculate the fatigue life for the specific stress amplitude or the fatigue strength after the specific fatigue cycles. According to Eq. (5), the parameters can be determined by the practical loading amplitude and the corrosion ratios.
4. The evolution law of the fatigue damage
To investigate the damage evolution law of the corroded steel bar under fatigue loads, we analyzed the residual strains of the corroded steel bars for various corrosion ratios after specific cycles, when the stress amplitude was 200 MPa. In addition, we defined the fatigue residual strain as the damage variable. With the evolution equation of the residual strains after fatigue loads and the damage variable of the corroded steel bars, we can analyze the damage evolution law of the corroded steel bars under fatigue loads. Table 3 lists the residual strains.
Table 3Residual strain of the specimens after fatigue load
No. | Corrosion rate / % | Cycle ratio and residual strain | ||||||
GJ1 | 0 | Cycle ratio | 0 | 0.182 | 0.364 | 0.546 | 0.728 | 0.91 |
Residual strain / % | 0 | 0.0028 | 0.0029 | 0.003 | 0.0035 | 0.01 | ||
GJ2 | 3 | Cycle ratio | 0 | 0.187 | 0.373 | 0.560 | 0.747 | 0.933 |
Residual strain / % | 0 | 0.0045 | 0.005 | 0.0055 | 0.006 | 0.017 | ||
GJ3 | 6 | Cycle ratio | 0 | 0.155 | 0.310 | 0.465 | 0.620 | 0.775 |
Residual strain / % | 0 | 0.0048 | 0.0052 | 0.0057 | 0.007 | 0.018 | ||
GJ4 | 9 | Cycle ratio | 0 | 0.177 | 0.355 | 0.532 | 0.710 | 0.888 |
Residual strain / % | 0 | 0.0049 | 0.0055 | 0.006 | 0.008 | 0.02 | ||
GJ7 | 12 | Cycle ratio | 0 | 0.168 | 0.335 | 0.503 | 0.670 | 0.838 |
Residual strain / % | 0 | 0.0052 | 0.0062 | 0.0065 | 0.009 | 0.021 | ||
GJ10 | 15 | Cycle ratio | 0 | 0.175 | 0.350 | 0.525 | 0.701 | 0.876 |
Residual strain / % | 0 | 0.0058 | 0.0065 | 0.0067 | 0.01 | 0.022 | ||
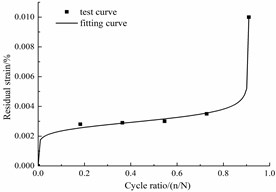
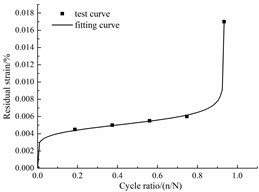
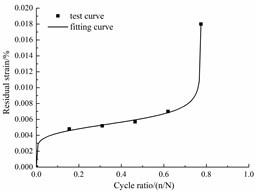
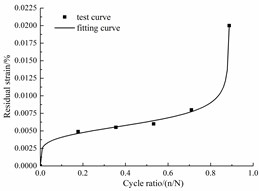
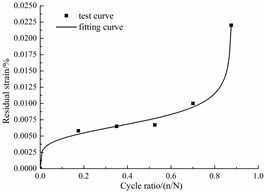
With the data in Table 3, Fig. 9 shows the nonlinearly fitted curve of the residual strain. The correlation coefficients are higher than 99 %, thus, the evolution equation of the residual strain is:
where is the accumulated residual strain after n cycle, n is the cycle times, is fatigue life, , and are the coefficients of the equation. Then, the evolution indexes for various evolution equations are in Table 4.
Table 4Coefficients of the evolution equation
No. | Corrosion rate / % | Equation parameter | Fitting accuracy | ||
GJ1 | 0 | 0.003 | 0.009 | 8.396 | 0.99 |
GJ2 | 3 | 0.005 | 0.009 | 8.142 | 0.99 |
GJ3 | 6 | 0.005 | 0.008 | 6.945 | 0.99 |
GJ4 | 9 | 0.006 | 0.009 | 5.399 | 0.99 |
GJ7 | 12 | 0.006 | 0.008 | 4.969 | 0.99 |
GJ10 | 15 | 0.007 | 0.009 | 4.749 | 0.99 |
Fig. 9Fitted curves of the residual strain
a) Corrosion rate 0
b) Corrosion rate 3 %
c) Corrosion rate 6 %
d) Corrosion rate 9 %

e) Corrosion rate 12 %
f) Corrosion rate 15 %
Fig. 9 shows that the residual strain included the relatively rapid increase, stable increase and rapid increase stages.
With the analysis of the residual evolution, we defined the damage variant , based on the fatigue residual strain under corrosion and fatigue loads:
where and are the initial residual strain and the accumulated residual strain when fatigue fracture occurs.
5. The stress-strain curve of the corroded steel bars after fatigue loads
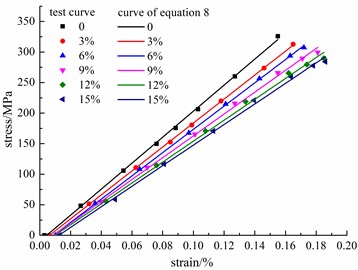
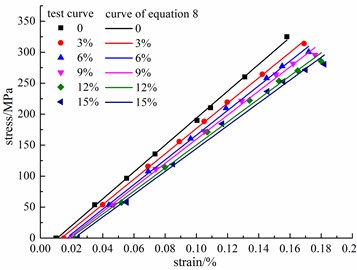
The steel bar, exposed to tension, frequently deforms elastically, yields, strengthens and fails in the form of necking in sequence. In the fatigue test, the fatigue load is commonly lower than the yield strength. Thus, in the present article, we further investigated the stress-strain curve of the corroded steel bars with the specific accumulated strain, caused by the staged fatigue loads. Moreover, we proposed a constitutive equation for the corroded steel bar Eq. (8):
where and are the static tension stress and strain after n cycles, is the corresponding damage variant; Es is the initial elastic modulus, is the residual strain after cycles; is the yield strength after cycles, is the yield strength after 1 cycles and is the yield strain.
Fig. 10 shows the laboratory stress-strain curves and the calculated curves, based on Eq. (8). Clearly, the calculated curves agree well with the laboratory curves. The deviations of the start points from the original point show that the residual strain increases with the increases in corrosion ratio and cycles. In addition, the decrease in the slope of the stress-strain curve indicates that the stiffness of the corroded steel bar significantly declines when the damage accumulates. This tendency is in accordance with the evolution law of the damage variant .
Fig. 10σ-ε curve of steel bars after the same cycle ratio
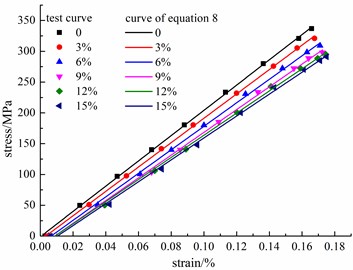
a) Cycle ratio 0.2
b) Cycle ratio 0.5
c) Cycle ratio 0.9
6. Conclusions
We analyzed the influences of the average corrosion ratio and the stress amplitude on the fatigue life of the corroded steel bars. In addition, we studied the damage evolution law of the steel bars under corrosion and fatigue loads. The main conclusions are:
1) Brittle fractures, characterized by the even failure surface, non-necking and abrupt fracture and locating on the significantly corroded sections, occurred in the fatigue tests on the corroded steel bars.
2) The increases in the corrosion ratio and the stress amplitude significantly decreased the fatigue life. With the increase in the corrosion ratio, the fatigue life of the steel bars exponentially decreases. Thus, the fatigue failure time is significantly reduced.
3) Residual fatigue strain occurred after specific cycles. In addition, for the same cycles, the residual strain was positively linear to the increase in corrosion ratio. Moreover, the development of the residual strain included the relatively fast, stable and rapid increment stages. Furthermore, the calculated results, obtained from the proposed evolution equation of the fatigue residual strain, agreed well with the laboratory results.
4) The proposed constitutive equation, based on the defined damage variable, can properly depict the stress-strain curve of the laboratory tests.
References
-
Haichao W. An experimental study on the fatigue behavior of corroded reinforced concrete beams. China Civil Engineering Journal, Vol. 38, 2005, p. 32-37.
-
Wu J., Wang C., Xu J., et al. Study on flexural behavior of corroded reinforced concrete beams under fatigue loads. China Civil Engineering Journal, Vol. 45, 2012, p. 118-124.
-
Almusallam A. A. Effect of degree of corrosion on the properties of reinforcing steel bars. Construction and Building Materials, Vol. 15, 2001, p. 361-368.
-
Apostolopoulos C. A., Papadakis V. G. Consequences of steel corrosion on the ductility properties of reinforcement bar. Construction and Building Materials, Vol. 22, 2008, p. 2316-2324.
-
Stewart M. G., Suo Q. Extent of spatially variable corrosion damage as an indicator of strength and time dependent reliability of RC beams. Engineering Structures, Vol. 31, 2009, p. 198-207.
-
Tang F., Lin Z., Chen G., et al. Three-dimensional corrosion pit measurement and statistical mechanical degradation analysis of deformed steel bars subjected to accelerated corrosion. Construction and Building Materials, Vol. 70, 2014, p. 104-117.
-
Apostolopoulos C. A., Demis S., Papadakis V. G. Chloride-induced corrosion of steel reinforcement-Mechanical performance and pit depth analysis. Construction and Building Materials, Vol. 38, 2013, p. 139-146.
-
Caprili Silvia, Salvatore Walter Cyclic behavior of uncorroded and corroded steel reinforcing bars. Construction and Building Materials, Vol. 76, 2015, p. 168-186.
-
Apostolopoulos C. A., Papadopoulos M. P. Tensile and low cycle fatigue behavior of corroded reinforcing steel bars S400. Construction and Building Materials, Vol. 21, 2007, p. 55-64.
-
Apostolopoulos C. A. Mechanical behavior of corroded reinforcing steel bars S500s tempcore under low cycle fatigue. Construction and Building Materials, Vol. 21, 2007, p. 1447-1456.
-
Cao J., Wen Y. Fatigue experimental study on corrosion reinforcement. Journal of Changsha Railway University, Vol. 16, 1998, p. 15-18.
-
Shibin L., Tang H., Xin Z., et al. Experimental study on fatigue of naturally corroded steel bars. Journal of Building Materials, Vol. 17, 2014, p. 811-815.
-
Zhang W. P., Li Shi Bin, Gu Xiang Lin, et al. Experiment on axial tensile fatigue of naturally corroded steel bar. China Journal of Highway and Transport, Vol. 22, 2009, p. 53-58.
-
Li S. B., Zhang W. P., Gu X. L., et al. Experimental study on fatigue properties of corrosion-accelerated steel bars. Journal of the China Railway Society, Vol. 32, 2010, p. 93-97.
-
Zhang J., Jin W. L., Mao J. H. Experimental study on steel bars' fatigue damage based on piezomagnetism. Journal of Zhejiang University, Vol. 51, 2017, p. 1681-1687.
-
Liu F., Zhou J. Experimental research on fatigue damage of reinforced concrete rectangular beam. KSCE Journal of Civil Engineering, Vol. 22, Issue 9, 2018, p. 3512-3523.
-
Fernandez Bairán Marí I. J. M. A. R. Corrosion effects on the mechanical properties of reinforcing steel bars. Fatigue and σ-ε behavior. Construction and Building Materials, Vol. 101, 2015, p. 772-783.
-
Wu Q., Yuan Y. S. Experimental study on the degradation of mechanical properties of corroded steel bars. China Civil Engineering Journal, Vol. 41, 2008, p. 42-47.
-
Zhang W. P., Shang D. F., Gu X. L. Study on the stress-strain relationship of corroded steel bars. Journal of Tongji University, Vol. 34, 2006, p. 586-592.
-
Zhang W., Song X., Gu X., et al. Tensile and fatigue behavior of corroded rebars. Construction and Building Materials, Vol. 34, 2012, p. 409-417.
-
Ministry of Housing and Urban-Rural Development of the People’s Republic of China. GB 50010-2010 Code for Design of Concrete Structure. Building and Industrial Press, Beijing, 2010.
Cited by
About this article

