Abstract
Because it is difficult to determine the degree and location of damage to bridge structures under environmental excitation, a new method combining frequency domain decomposition and strain mode identification for bridge structure damage assessment is proposed and the related identification principle is derived. General variations in the strain mode parameters of different reinforced concrete beam damage states are accordingly studied under ambient excitation. The results show that the proposed strain mode identification method based on frequency domain decomposition has good anti-noise performance and can identify the strain mode parameters of a structure relying solely on the strain response information of the structure, even under strong background noise. The mutation of the strain mode was effectively used to determine the damage condition of reinforced concrete beams, and the adaptability, feasibility, and reliability of the proposed method for modal parameter and damage identification of reinforced concrete beams under environmental excitation were verified.
Highlights
- Derived and verified a proposed method for the detection of damage in reinforced concrete beam
- The proposed method effectively determines the location and extent of damage
- The proposed method has better anti-noise performance, and it can be used to identify damage to engineering structures such as reinforced concrete bridges under environmental excitation
1. Introduction
Reinforced concrete beams constitute one of the primary structural forms of highway bridges, regardless of bridge size. With rapid economic development across the world, the scope and scale of highway construction are expanding, and with this expansion the quantity and scale of bridges are increasing. However, once constructed, a bridge structure is continuously deteriorating under the influence of factors including changing environmental conditions and traffic overload, inevitably resulting in a variety of damage. The existence of damage hidden inside bridge structures is a real threat to the normal operation of highway traffic. Therefore, the problem of damage identification in bridge structures has attracted significant attention from researchers around the world.
At present, research into methods for the identification of damage to reinforced concrete bridge structures is still in the basic stages of exploration. There remains a significant gap between theoretical methods under research and those currently widely used in practical bridge structural damage identification [1]. Although there are many advanced testing methods, such as X-ray analysis, ultrasonic detection, infrared thermal spectrum analysis, GPS satellite monitoring, and stress monitoring using embedded optical fibers, because of the high cost and difficulty of testing, these technologies face considerable limitations in their implementations on real bridges.
Experimental modal analysis technology is considered to be one of the best and most promising structural damage detection techniques. It has been widely used for damage identification in aviation, aerospace, machinery, bridge, and other engineering structures [2-7]. Farrar et al. conducted a series of dynamic tests on a bridge structure finding that when the bending stiffness of the main beam of the subject bridge decreased sharply, the natural modal frequency of the bridge decreased only slightly, indicating that the inherent modal frequency is not very sensitive to structural damage [8]. Ruzzene et al. used the Morlet wavelet transformation to extract the transient response of a bridge structure under load directly from the acceleration response data, then to determine the response of a simulated three-span bridge and the results were compared [9]. Farrar et al. conducted damage identification research on the I-40 bridge over the Rio Grande River, finding that the change in structural frequency was uncertain due to the large change in the bending stiffness of the bridge, thus determining that structural frequency could not be used as a damage identification index, but finding instead that the vibration mode was sensitive to structural damage [10]. Patil and Maiti studied the crack damage problem of a Euler-Bernoulli beam and determined a linear relationship between the degree of damage of the beam and the change in its natural frequency [11]. Gokdag and Kompaz proposed a new wavelet-based method for damage detection in beam-type structures by combining both continuous and discrete wavelet transformations based on the assumption that a damaged mode shape can be composed of an undamaged mode and local damage-induced variations [12]. Beskhyroun et al. also proposed a new technique based on wavelet transformation for structural damage detection that they verified both experimentally and numerically using a railway bridge [13]. Miyamoto proposed the state representation methodology (SRM) and its application to bridges using monitoring data by developing a frequency slice wavelet transformation that successfully revealed changes in signal characteristics [14].
Traditional modal analysis technology based on the transfer function usually requires both excitation and response signals to identify structural mode parameters. However, it is difficult to apply artificial excitation to many large and complex structures such as bridges, offshore platforms, high-rise buildings, and special vibration-prone structural systems, so the modal parameters can only be determined by measuring the output signal of the structural system. The signal-to-noise ratio (SNR) of the response signal obtained during the modal test of engineering structure under ambient excitation is usually quite low due to the influence of many factors, including system noise and environmental noise. The characteristic signal of a structural fault can be hidden by a strong background noise signal, and the characteristic signal and noise signal often overlap in the frequency band, making it difficult to separate them using traditional filtering and noise reduction methods. Accordingly, Brincker [15, 16] proposed the frequency domain decomposition method (FDD) and the enhanced frequency domain decomposition method (EFDD). These methods are better able to identify the near frequency and even repetition frequency of structural mode parameters when the sampling signal contains strong noise.
The FDD method has been widely studied in the identification of structural modal parameters [17-20]. This type of research primarily uses acceleration sensors to collect the structural vibration response information and obtain the displacement mode. It is well known that a major problem remaining in structural damage identification using the displacement mode is that it is not sensitive to structural damage. The strain mode, however, is the first derivative of the displacement mode, and can be obtained from the displacement mode differentially or directly from the strain response. The strain mode not only reflects the local dynamic characteristics of the structure, but its sensitivity to local structural changes is much higher than that of the displacement mode, and thus can be used to readily identify the location of structural damage. Accordingly, this study combines the FDD method with the strain mode, which is sensitive to the damage of the structure, to identify simulated damage to precast reinforced concrete beams under environmental excitation.
2. Structural strain modal damage identification based on frequency domain decomposition
According to the theory of random vibration, the relationship between the power spectral density of an unknown input of stationary random excitation and a random response output can be expressed as:
where is the input power spectral density matrix, is the output power spectral density matrix, is the frequency response function matrix, and is the complex conjugate transposition matrix. Because strain is the first derivative of displacement, it must have an inherent strain distribution state corresponding to each displacement mode; strain and displacement are two forms of the same energy equilibrium state. Therefore, the relationship between the power spectral density of the input and output and the strain frequency response function can be written as:
where is the strain frequency response function matrix, which can be written in the following partial fractions form:
where is the model order, is the th pole, and is the th residue matrix, which is the product of the th mode shape and the transposed modal participation vector , that is . Assuming that the input ambient excitation is a straight spectrum, then is a real constant diagonal matrix, which is denoted and can be obtained by Eqs. (1) and (3) as:
where is the relative residue, in the case of small damping, in the vicinity of the th mode, and can be approximated as:
where is a real constant on the adjacent spectral line of the th mode frequency, and as is far smaller than , it can be neglected. Therefore:
In the output power spectral density diagram, if only the th mode plays the leading role near the peak value of the spectral density, Eq. (6) can be approximately expressed as:
when the frequency domain method is used to identify the modal parameter, is estimated using a spectrum estimate based on the measured strain response data, then a singular value decomposition of at its discrete frequency point is given by:
where is a unitary matrix holding the singular vectors and is a diagonal matrix holding the singular scalar values. Near a peak corresponding to the th mode in the spectrum, this mode will be dominant. Thus, the first singular vector is an estimate of the th strain mode shape . The frequency band near the peak of the singular value (MAC) is selected for an inverse Fourier transformation, and the approximate correlation function curve of a single degree of freedom is obtained. Then, the modal frequency and damping are identified by the logarithmic attenuation method. It can be seen from the above theoretical derivation that the strain mode identification method based on FDD contains similar expressions to the traditional FDD method, and thus can be used for structure modal parameter identification.
As the structural modal characteristic parameters reflect the actual working state of the structure, if there is damage inside the structure, the structural frequency response function and the corresponding modal characteristic parameters will inevitably change. Therefore, after identifying the strain mode parameters of the tested structure and comparing them with those calculated for an intact structure, the damage state and damage degree of the structure can be determined according to the change in the structural strain mode parameters.
3. Experiments
One intact reinforced concrete beam and eight reinforced concrete beams with different degrees and locations of damage were tested. The simply supported beams were 6 m long, 0.25 m wide and 0.5 m high. The strength grade of the concrete was C40 with a density of 2.5×10³ kg/m3. The longitudinal compression reinforcement was 220, the longitudinal tensile reinforcement was 320, the stirrup spacing was 0.2 m, and the thickness of the concrete cover was 0.04 m. Beam damage was simulated at quarter-span and mid-span using a 0.001 m thick, 0.25 m wide plastic sheet cast 0.025 m, 0.05 m, 0.075 m, and 0.10 m into the bottom face of the beam to introduce physical separation in the concrete, corresponding to 5 %, 10 %, 15 %, and 20 % of the beam height , respectively, and representing increasing degrees of damage. The shape, size, and reinforcement of the beams are shown in Fig. 1.
Fig. 1Geometry of the subject simply-supported reinforced concrete beam
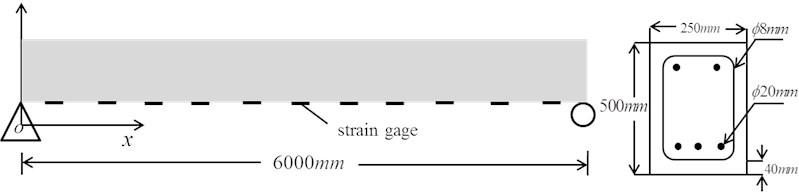
A total of 11 strain measurement points were located along the bottom of the beam. The concrete surface at all measurement points were smoothed with a concrete sander and cleaned with alcohol. The strain gauges used in these tests were physically 55×8 mm with a sensitive grid size of 50×4 mm and were affixed to the beams using 502 glue. As the gages were installed in the middle of the bottom width of the beam, they were arranged with respect to the location of simulated damage. Each measurement point was equipped with two mutually perpendicular strain gauges oriented in the -direction (length direction) for measurement and -direction (width direction) for compensation. After these two-gage patches were installed, they were allowed to stand for one week before the experiments were performed.
Due to the relatively massive nature of a reinforced concrete beam, the strain caused by natural environmental excitation is quite small. In repeated tests, the vibration responses of the test beams were collected by randomly exciting the top of the beam with a 24 lb. hammer for an approximately 10-minute sampling time. The data acquisition system sampling frequency was 2000 Hz, the analysis frequency was 781.25 Hz, the time domain was 8192, the frequency domain was 3200, the frequency resolution was 0.244 Hz, and measurement Point 4 was used as the reference point. Fig. 2 shows a diagram of the experimental set up.
Fig. 2Experimental vibration testing set up
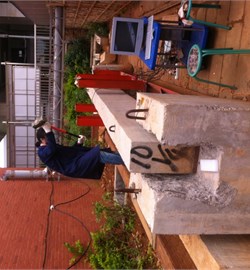
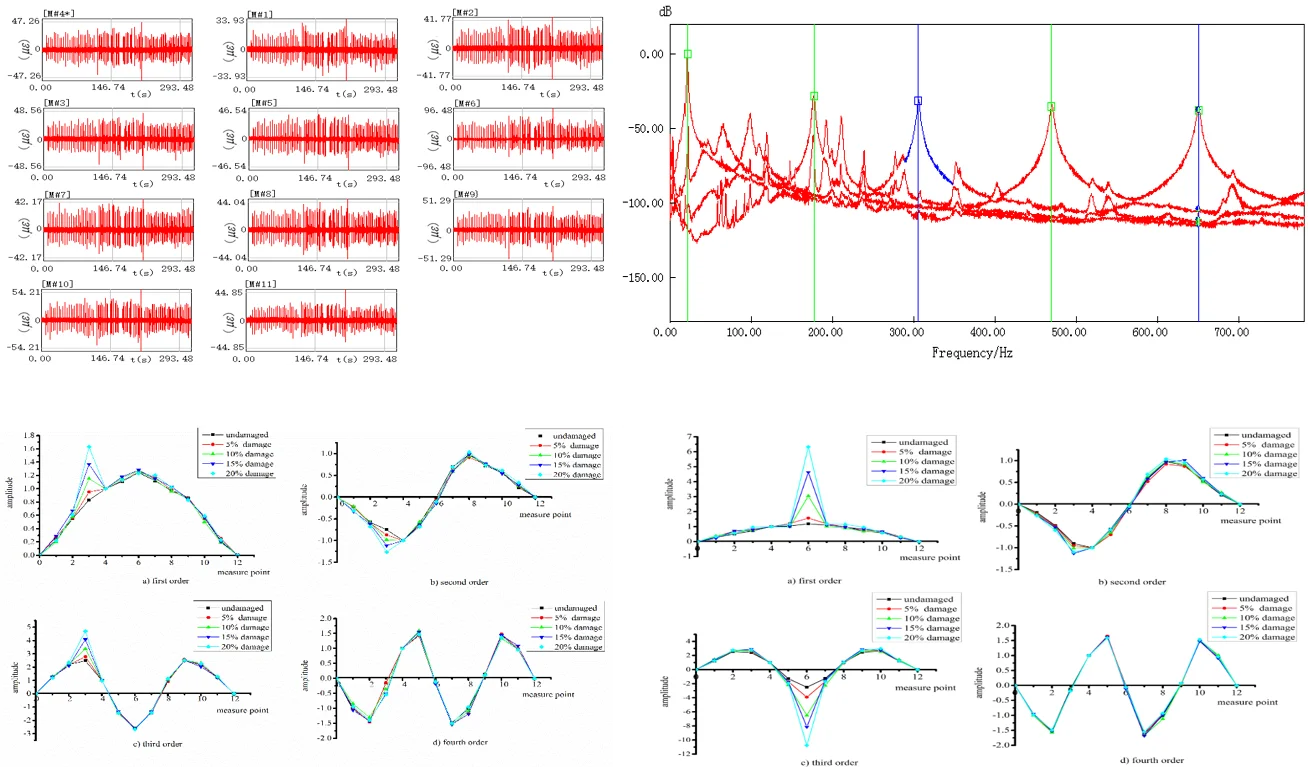
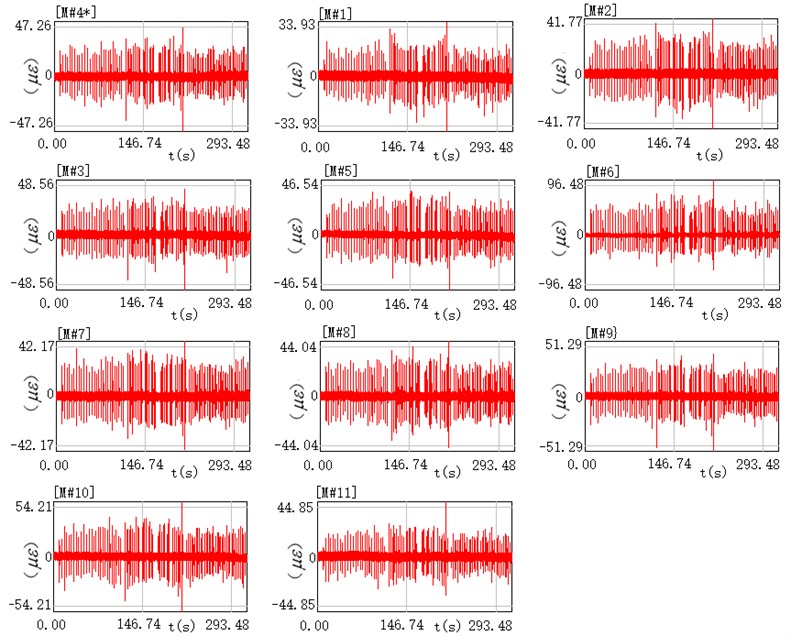
Fig. 3 shows the real-time sampling signals collected at each measurement point on the intact beam during the tests. In each plot, the upper left corner indicates the measurement point, the horizontal axis is the sampling time, and the vertical axis is the dependent variable (strain). Again, data from measurement Point 4 was used as the reference signal. It can be seen from the figure that the sampling signals at each measurement point contain a certain component of the noise signal near the strain zero value, and that the strain response signals at each measurement point under the same excitation are in good agreement. The strain at each measurement point is different, and as measurement Point 6 is at the mid-span of the beam, it reports the largest strain.
Fig. 3Real-time sampling signals at each measuring point on the intact beam during vibration tests
The strain response signals the intact reinforced concrete beams sampled in Fig. 3 were subjected to an FFT transformation and an FDD for comparative analysis. Fig. 4 shows the spectral superposition of each measuring point of the intact beam after FFT transformation, which exhibits multiple resonance peaks, obviously showing a single-peak AC noise signal with a frequency doubling of 50 Hz. Theoretically, each resonance peak in the graph should correspond to the first-order resonance frequency of the subject beam. However, a post-experiment study indicated that due to the existence of various unavoidable interference noises in the sampling process, it is difficult to identify the exact modal frequency and mode shape of the subject beam from the FFT-converted spectrogram.
Fig. 4Spectral superposition of data from each measuring point on the intact beam after FFT transformation
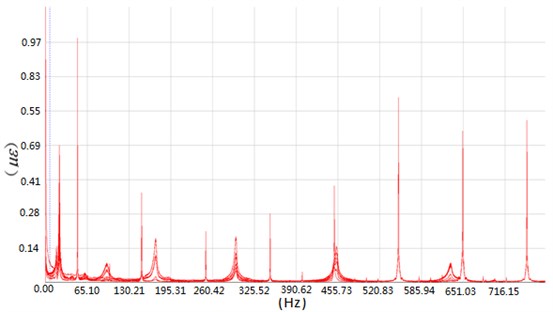
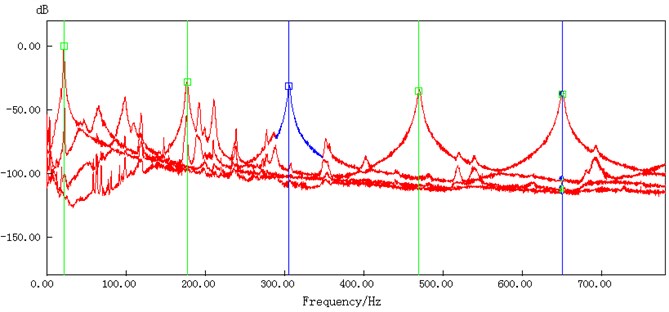
Fig. 5 depicts the singular decomposition curve of the strain response signal power spectrum of the intact reinforced concrete beam based on FDD. In this figure, the singular maximum peak point (the peak value in the figure) is quite clear and readily identifiable, representing the corresponding modal frequency of the beam. The 50 Hz single-peak AC strong noise signal appearing in Fig. 4 is not present in Fig. 5, demonstrating that the strain mode identification method based on FDD provides superior noise interference suppression compared to the FFT-converted spectrogram.
Fig. 5Singular decomposition curve of the strain response power spectrum of the intact beam based on frequency domain decomposition
3.1. Damage identification
According to Eq. (8), the mode shapes, frequencies, and damping ratios of the test beams can be identified. Table 1 and Table 2 list the first four modes of the natural frequency identification and damping identification results, respectively, of the reinforced concrete beams under different degrees of simulated damage.
Table 1Natural frequencies and damping at quarter-span of intact and damaged beams
Mode | Intact | 5 % damage | 10 % damage | 15 % damage | 20 % damage | |||||
(Hz) | (%) | (Hz) | (%) | (Hz) | (%) | (Hz) | (%) | (Hz) | (%) | |
1 | 21.48 | 0.71 | 22.46 | 0.88 | 22.46 | 1.05 | 21.28 | 0.95 | 21.00 | 0.84 |
2 | 170.11 | 0.39 | 174.32 | 0.89 | 178.2 | 0.57 | 173.34 | 1.01 | 170.9 | 1.09 |
3 | 298.34 | 0.45 | 298.83 | 0.47 | 300.8 | 0.31 | 297.36 | 0.53 | 290.53 | 0.43 |
4 | 460.45 | 0.81 | 456.05 | 0.41 | 457.5 | 0.63 | 452.15 | 0.48 | 443.36 | 0.50 |
Table 2Natural frequencies and damping at mid-span of intact and damaged beams
Mode | Intact | 5 % damage | 10 % damage | 15 % damage | 20 % damage | |||||
(Hz) | (%) | (Hz) | (%) | (Hz) | (%) | (Hz) | (%) | (Hz) | (%) | |
1 | 21.48 | 0.71 | 21.97 | 0.74 | 21.97 | 0.3 | 20.93 | 0.64 | 20.53 | 0.43 |
2 | 170.11 | 0.39 | 177.25 | 0.52 | 178.2 | 0.81 | 167.97 | 0.98 | 166.5 | 0.79 |
3 | 298.34 | 0.45 | 306.64 | 0.54 | 307.1 | 0.46 | 281.25 | 0.59 | 284.67 | 0.54 |
4 | 460.45 | 0.81 | 469.78 | 0.46 | 463.8 | 0.87 | 478.75 | 0.35 | 456.29 | 0.43 |
It can be seen in the tables that, compared with the intact beam, the same natural frequency modes for the different damaged beams are not considerably different. On the whole, except for the natural frequency of the 20 % damaged test beam, the natural frequency of the damaged beams does indicate any consistent trend with the increase in the degree of structural damage. Similarly, the change in structural damping does not reflect any consistent trend with the increase in structural damage. While the natural frequency of the 5 % damaged test beam is larger than that of the intact beam, this is mainly due to the fact that all test beams cannot be constructed with exactly the same physical characteristics, leading to slightly different inherent frequencies. The structural frequency change is clearly not obvious when the damage is small, and this is consistent with many other studies on the sensitivity of natural frequencies to structural damage.
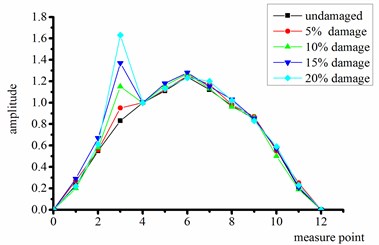
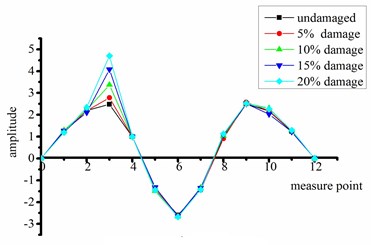
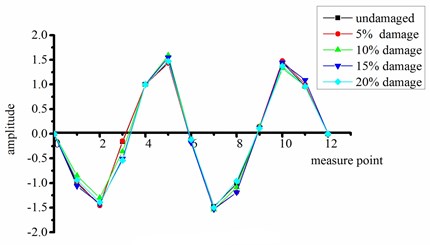
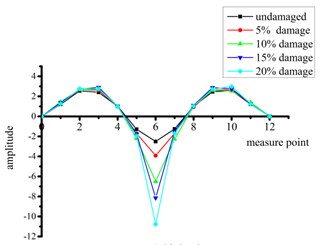
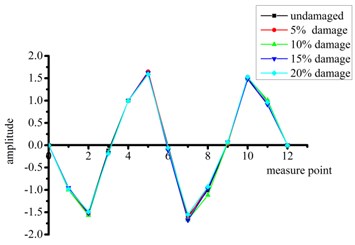
Figs. 6 and 7 show the first four-order strain mode shapes of the test beams with different degrees of damage at the quarter-span and mid-span, respectively, according to the proposed strain mode identification method using FDD.
Fig. 6Strain modal shapes at quarter-span of intact and damaged beams
a) First order
b) Second order
c) Third order
d) Fourth order
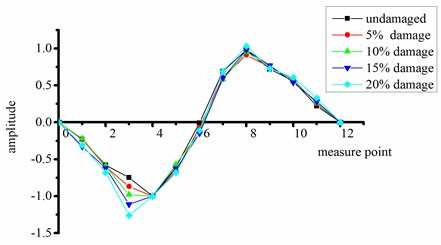
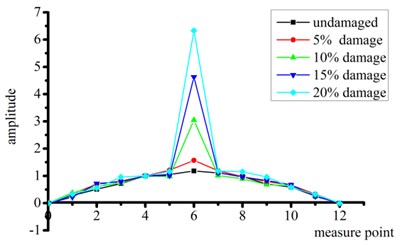
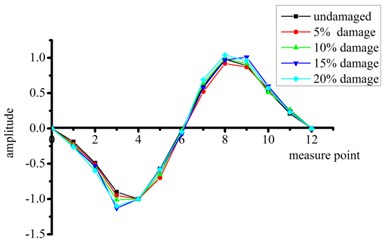
Fig. 7Strain modal shapes at mid-span of intact and damaged beams
a) First order
b) Second order
c) Third order
d) Fourth order
It can be seen from Figs. 6 and 7 that:
(1) Compared with the intact beam, the test beams with damage at quarter-span exhibits significant mutations in the shape of all strain modes except the fourth-order mode. This mutation reflects the existence of structural damage.
(2) The beams with damage at mid-span have the most significant mutations in the first-order and third-order strain mode shapes, thus these curves also accurately reflect the existence of the structural damage. No changes in the second-order and fourth-order modes are obvious because the position of simulated damage is located near a node for these vibration modes.
(3) Considering all beams with damage at the two different sites, the mutation of the third-order strain mode shape is particularly significant. That is, this high-order frequency mode shape is clearly more sensitive to structural damage.
(4) When the change in mode shape is abrupt, the degree of mutation increases with the degree of damage.
4. Conclusions
In this study, the frequency domain decomposition (FDD) method and strain mode were combined to provide a method for the identification of damage to a reinforced concrete beam bridge structure under environmental excitation. The theoretical derivation of the FDD method indicates that it is suitable for the modal identification of strain vibration signals. An experimental evaluation of reinforced concrete beams with precast simulated damage was accordingly conducted to evaluate the effectiveness of the proposed method. The main conclusions of this study are as follows:
1) In this study, the theoretical derivation of the proposed method assumes that the excitation input is a straight spectrum, which is a difficult to satisfy criterion in an actual engineering test. However, the results of this study have shown that, even under random excitation, the proposed strain mode identification method based on FDD can accurately identify the modal parameters of the structure using the structural vibration strain response information.
2) The proposed strain mode identification method based on FDD can accurately identify the position of damage on the beam according to the mutation of the strain mode shape, and the magnitude of the mode shape mutation more accurately reflects different degrees of damage to the structure.
3) The proposed strain mode identification method based on FDD has better anti-noise performance, enabling it to identify the modal parameters of the tested structure under strong background noise, and thus can be used to identify damage to engineering structures such as reinforced concrete bridges under environmental excitation.
Based on the results of this research, the health of a bridge engineering structure can be determined according to the sudden changes in the strain mode shape by using system vibrations to identify the degree and location of damage. If the structural damage criterion is established ahead of time, the degree of damage to the structure can be determined based on this mutation of the modal shape. Note that when identifying the damage to a bridge structure using the proposed method, in order to accurately to determine the existence and location of structural damage, it is important to select a reasonable modal order according to the measured structure geometry in addition to considering the optimal arrangement of the measurement points. This method can be applied in the field to determine structural damage without extensive or expensive equipment, thus lowering the barrier to conducting damage testing and resulting in safer structures.
References
-
Zhu H. P., Yu J., Zhang J. B. A summary review and advantages of vibration-based damage identification methods in structural health monitoring. Engineering Mechanics, Vol. 28, 2011, p. 1-11.
-
Ewins D. J. Modal Testing Theory and Practice. John Wiley and Sons,New York, 1984.
-
Pandey A. K., Biswas M. Experimental verification of flexibility difference method for locating damage in structures. Journal of Sound and Vibration, Vol. 184, 1995, p. 311-328.
-
Adewuyi Philips A., Z. H., Serker Kammrujaman N. H. M. Assessment of vibration-based damage identification methods using displacement and distributed strain measurements. Structural Health Monitoring, Vol. 8, 2009, p. 443-461.
-
Griffith Todd D., Carne Thomas G. Experimental modal analysis of research-sized wind turbine blades. Sound and Vibration, Vol. 44, 2010, p. 8-12.
-
Wei F., Qiao P. Z. Vibration-based damage identification methods: a review and comparative study. Structural Health Monitoring, Vol. 10, 2011, p. 83-111.
-
De Vivo R. A., Brutti C., Leofanti J. L. Modal shape identification of large structure exposed to wind excitation by operational modal analysis technique. Mechanical Systems and Signal Processing, Vol. 19, 2013, p. 195-206.
-
Farrar C. R., Baker W. E. Dynamic Characterization and Damage Detection in the I-40 Bridge Over the Rio Grande. Los Alamos National Laboratory Report, 1994.
-
Ruzzene M., Fasana A., Garibaldi L., et al. Natural frequency and damping identification using wavelet transform: application to real data. Mechanical Systems and Signal Processing, Vol. 11, 1997, p. 207-218.
-
Farrar C. R., Timothy W. D. Microwave interferometers for mon-contact vibration measurements on large structures. Mechanical Systems and Signal Processing, Vol. 13, 1999, p. 241-253.
-
Patil D. P., Maiti S. K. Detection of multiple cracks using frequency measurements. Engineering Fracture Mechanics, Vol. 70, 2003, p. 1553-1572.
-
Gokdagh, Kopmaz O. A new damage detection approach for beam-type structures based on the combination of continuous and discrete wavelet transforms. Journal of Sound and Vibration, Vol. 324, 2009, p. 1158-1180.
-
Beskhyroun S., Oshima T., Mikami S. Wavelet-based technique for structural damage detection. Structural Control and Health Monitoring, Vol. 17, 2010, p. 473-494.
-
Miyamoto A. A new damage detection method for bridge condition assessment in structural health monitoring. Journal of Civil Structural Health Monitoring, Vol. 3, 2013, p. 269-284.
-
Rune Brincker, Zhang L. M., Anderson P. Modal identification from ambient responses using frequency domain decomposition. Proceedings of 18th Conference on Computational Challenges in Structural Dynamics, San Antonio, Vol. 4062, 2000, p. 625-630.
-
Rune Brincker, Carlos Ventura E., Palle Andersen Damping estimation by frequency domain decomposition. Proceedings of IMAC 19: A Conference on Structural Dynamics, Hyatt Orlando, Kissimmee, Florida, Vol. 4359, 2001, p. 698-703.
-
Wang T., Zhang L. M. Frequency and spatial domain decomposition for operational modal analysis and its application. Acta Aeronautica et Astronautica Sinica, Vol. 27, 2006, p. 62-66.
-
Hui L., Huang Ch, Xun Y. Modal test and analysis of the tied arch bridge by using EFDD method. Highway Engineering, Vol. 40, 2015, p. 129-132.
-
Ahmet Can Altunisik, Alemdar Bayraktar, Baris Sevim Operational modal analysis of a scaled bridge model using EFDD and SSI methods. Indian Journal of Engineering and Materials Sciences, Vol. 19, 2012, p. 320-330.
-
Foti D., Gattulli V., Potenza F. Output-only identification and model updating by dynamic testing in unfavorable conditions of a seismically damaged building. Computer-Aided Civil and Infrastructure Engineering, Vol. 29, 2014, p. 659-675.
Cited by
About this article

This research was supported by the National Natural Science Foundation of China No. 51278235.
