Abstract
Dynamic characteristics analysis on shearer drum is an important aspect in shearer design and a well-structured shearer drum provides better performance in vibration reduction and service life extension. To make reference for structure improvement, many researchers have focused on the dynamic analysis on cutting pick. However, the simplified model such as single pick, linear motion and continuous coal in the previous study made it divorced from actual situations underground. On basis of this, the model of shearer drum with several arranged picks and the coal model with some distributed rock have been set up in order to consist with the real working conditions. Through simulation, it can be found that the mean force in -direction is little influenced by rock distribution, but the peak force in-direction fluctuates greatly under different rock distribution. During the analysis on the peak force, it can be found that this kind of force could be cut down effectively when the rock was distributed on the top of the shearer cutting range. Based on these conclusions, we can program the cutting strategy to lower the influence of cutting forces on the shearer and its drum in the future.
1. Introduction
Shearer drum is one of important parts in the comprehensive mechanization mining equipment, and the economic and production efficiency in coal mine can be kept when the drum works under steady conditions. However, some references show that the failure resulted from shearer drum account for 56.4 % in all failure on the mechanized mining equipment [1]. Besides, of all the failure on shearer drum, problems due to heavy shock and vibration are in the majority without any doubt [2]. In the recent years, many researchers began to study on shearer picks particularly the force acted on that. Reasonable cutting force will be helpful not only in the reduction of pick failure such as teeth broken or wear but also in the extension of service life. Furthermore, in the long term, it will also exert a positive impact on the improvement of production efficiency and so on.
According to induction on the existing references, dynamic analysis on shearer drum usually started from the following three aspects, and they are theoretical research, simulation analysis and experiments. Of all these theoretical studies, many other theories are developed based on the theory proposed by Evans in 1984 [3]. He put forwards a theoretical formula for calculating the forces on the single point-attack pick according to the installing angle and other parameters. This theory was then successfully applied to the single point-attack pick design until now. After Evans, there were some other researchers such as Goktan [4] and Bilgin [5], and they also put forwards some new theories which further promoted the research on the force of single point-attack pick. Later, with the appearance of elastoplastic theory, some researchers try predicting the force on basis on this theory, for example, Kuidong Gao [6] have set up a theoretical model for predicting the peak force of cutting force on the basis of the linear elastic fracture theory. In addition to theoretical studies, experimental methods to make relevant research were also well underway [7-11]. Ono Tetsuji [12] applied a series of different cutting angle onto the different kind of rock and made analysis of the cutting force on these cutters. They found that the rake angle of cutter had more impacts on the cutting force compared with the relief angle and the influence of these angle differed with these rock type. Songyong Liu [13] made research on the interaction between cutters and rock when the cutters were under different abrasion. In actually, this research was also to study the regularity of cutting force in various cutting angle. As for the simulation analysis, it is also common to be used in the references. Zhengrong Wang [14] set up the finite element model to simulate the contact between cutter and coal and then studied the relationship between the cutting angle and cutting force. Pijush Samui [15] gave out several calibrated parameters relevant to model simulation and then made analysis on the cutting forces under different shapes of cutter, cutting depth and so on. They concluded the reasonable cutting depth and cutter shape in order to get the mean cutting forces minimum. It is because of these research and exploration that make the design of cutter step towards rationalization.
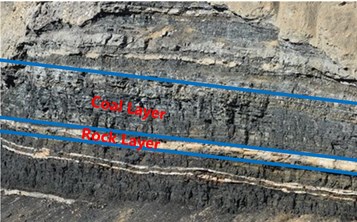
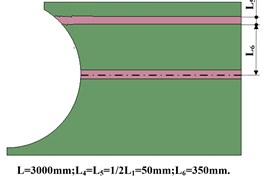
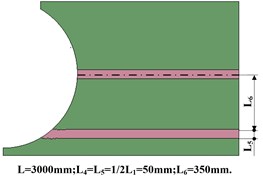
However, the factors influenced on shearer drum are far from these. Most researchers focused more on the structural optimization of cutter or the rationalization of working parameters [16, 17], and the model of cutter and coal were assumed to be even and continuous [18, 19]. Suppose that nothing such as rock existed in continuous coal, but this is merely one of the ideal conditions in actual production as shown in Fig. 1. Fig. 2 shows another common situation in production practice. As it can be seen from this figure, a little rock exists in coal seam and the rock is distributed continuously and evenly along the coal seam. Some references indicated that the mechanical properties of coal differ from that of rock greatly [20-23]. The cutting process on continuous coal will be broken off by the existence of rock and then some large fluctuation of cutting force will appear which has bad effect on the stability of shearer drum. Therefore, reasonable cutting strategy to avoid the fluctuation of force is necessary to be studied according to the different distribution of rock.
To make the study closer to the actual working conditions, the paper prepared to study the interaction between cutter and coal from the perspective of complicated seam conditions. The finite element method is used to simulate the crushing process of coal and rock under shearer drum. In this paper, the whole simulation model can be divided into coal, rock and shearer drum which consists of several conical picks and helical vanes. The model of coal is not continuous, and the rock model is distributed in that with some regularity. With these models, the dynamic characteristics analysis on shearer drum has been made and the force acted on shearer drum in different directions has been obtained. On basis of these results, some cutting strategies, which are able to decrease the load fluctuation, can be gotten and will be helpful for those who make structural design on shearer drum if the rock is required to be considered.
2. Experiment design and its equipment
2.1. Cutter-coal-rock calibration
Before running simulation, parameter which determines the accuracy of simulation results should be calibrated at first. Now, there are about two ways to finish the parameter calibration. The first is to make several simple experiments and then study the regularity of some force in these test-beds, and then adjust the parameters in simulation to make the results close to those results in the simple experiments. Finally, make more complicated research based on these calibrated parameters and the results gotten by these parameters will be more convincing. In this way, H. Huang [24] made his research on the relationship between cutting depth and the failure type of rock. Another method is to make use of the existing parameters and they are obtained by experiments or proved to be right in the previous simulation analysis. Finally, researcher will save time in parameter calibration and focus more on the solution of more complicated problems [25-27]. Qianqian Zhang [28] tried getting the forces in finite element method and the parameters in their research was just based on the results proved to be reasonable in some experiments made by Bligin [29] and Copur [30]. Finally, the conclusions gotten from Zhang were consistent with experiments and they were persuasive consequently.
Fig. 1Coal bed with continuous distribution
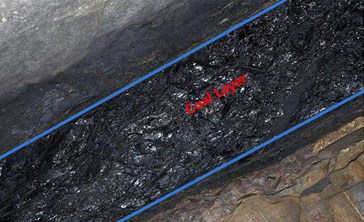
Fig. 2Coal bed with several rock distribution
In this paper, the accuracy of simulation results are determined by several parameters, including cutting speed of shearer, cutting depth and mechanical properties of rock and conical picks. Some parameters are chosen according to the working conditions such as cutting speed, cutting angle, cutting depth and so on, because these belong to macro parameters and they are restricted as long as the type of shearer is selected, and no calibration is needed; the other are set by the mechanical properties such as the uniaxial compressive strength and tensile strength of coal [31-33]. With the method of trial and error, Qianqian Zhang got the calibrated parameters of rock which can be directly applied to simulation, and these parameters can be tracked in Table 1. What’s more, Pijush Samui [15] gave out the calibrated parameters of cutter, coal and rock when studying the cutting forces in the finite element method. The calibrated results can be seen in Table 2.
Table 1Calibrated parameters of material used in the paper [26, 28, 34]
Material specification | Value | Material specification | Value |
(I) Rock parameters | Value | (II) Cutter parameters | Value |
Young’s modulus | 0.25 GPa | Young’s modulus | 550 GPa |
Poisson’s ratio | 0.25 | Poisson’s ration | 0.24 |
Cohesion | 5 MPa | Density | 7850 kg/m3 |
Friction | 40° | – | – |
Tensile strength | 1 MPa | – | – |
Fracture strength | 200 N/m | – | – |
Critical plastic strain | 0.20 % | – | – |
With these parameters used in Table 1, Zhang Qianqian [28] made analysis on the research of coal cutting. By means of simulation, the mean and peak force acting on single pick can be obtained. After simulation, they compared and found that the mean and peak forces obtained by simulation were in high linear correlation with that gotten by theory and experiment. It was said that the correlation coefficient of forces between simulation and Goktan theory is up to 0.9295, while that between simulation and experiment is 0.9132. Therefore, these parameters provide the reference for simulation in the paper and the results will be believable to some extent. Of course, the results should and will be verified with some experimental results again to ensure the accuracy of the research.
2.2. Cutter-coal-rock model
It has been mentioned that the dynamic analysis on shearer drum was usually made with the model of single conical pick and the simplified model can be seen in Fig. 3. [34, 35]. The single conical pick is better for model simplification, but the mutual influence on coal between each conical pick on shearer drum can’t be considered with this simplified model. In view of this, the paper prepared to establish the shearer drum model with several conical picks and helix vanes and they can be found in Fig. 4. Comparing with the single conical pick and coal-rock model in Fig. 3, the model of shearer drum in Fig. 4 was not only improved with several conical picks, fixed base and helical blade, but also taken many kinds of factors into account and these factors were shown in Table 2. For this reason, the shearer drum model is much closer to the real working environments and it is more reliable than the single bit model. Besides, the operating parameters of shearer drum were shown in Table 3. So far, the parameters required in the simulation have been finished and then some other operations in LS_DYNA are needed.
Fig. 3Model of Single pick and coal
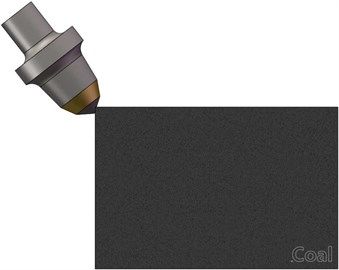
Fig. 4Model of shearer drum and coal-rock
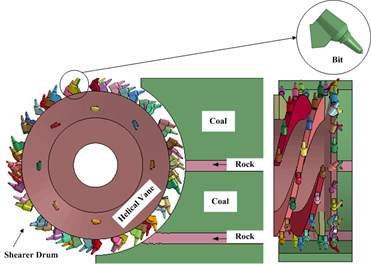
Table 2Mechanical properties of coal and rock after calibration
Material type | Density (t/mm3) | Young’s modules (MPa) | Poisson’s ratio | Tensile limit (MPa) | Shear limit (MPa) | Shear strain (mm) |
Coal | 1.3E-09 | 2.5E+03 | 0.25 | 1 | 9 | 0.01 |
Rock | 2.6E-09 | 4.6E+04 | 0.23 | 12 | 22.5 | 0.003 |
Table 3Design and operation parameters of shearer and its drum
Item | Drum diameter (mm) | Drum width (mm) | Haulage speed (m/min) | Rotating speed (r/min) | Cutting depth (mm) | Termination time (s) |
Value | 2240 | 880 | 10.4 | 25.83 | 1000 | 8.0 |
In the paper, the rock was designed to be distributed in the different positions and the positions can be shown in Fig. 5 Moreover, in order to facilitate the introduction in the subsequent parts, the different situations of rock distribution shown in Fig. 5 were simplified with their abbreviation and different code as shown in the Table 4. The Ab. in the Table 4 will be used in the following figures and tables such as Table 5, 6 and Fig. 11. The code shown in the Table 4 will also be used in the following figures such as Fig. 7, 10 and 11.
Table 4Codes and abbreviation of rock distribution under different situations
Ab. | Code | Meaning of the abbreviation |
Top | 1 | Rock was distributed in the top of the model just as Fig. 5(a) shown |
Mid | 2 | Rock was distributed in the middle of the model just as Fig. 5(b) shown |
Bot | 3 | Rock was distributed in the bottom of the model just as Fig. 5(c) shown |
Top-Bot | 4 | Rock was distributed in the top and bottom of the model just as Fig. 5(d) |
Top-Mid | 5 | Rock was distributed in the top and middle of the model just as Fig. 5(e) |
Bot-Mid | 6 | Rock was distributed in the middle and bottom of the model just as Fig. 5(f) |
Moreover, to make the simulation more similar to the coal cutting, the material model Drucker-Parger, which contains only a few parameters but proved to be high accuracy for rock simulation, and the damage model ADD_EROSION were adopted in coal and rock models. When the material was stressed beyond its plastic limit, these failure parts will be removed automatically which is consistent with the damage effect in real rock and coal cutting [36]. Furthermore, the type of all elements was Solid 164 which is 3D element with 8 nodes, and hourglass control was also made to prevent zero energy modes which might make simulation terminated. In addition, the contact between coal and shearer picks was defined as surface-to-surface, and the shearer pick was chosen as contact surface and the whole coal seam was chosen as target surface. After meshing on the model, the number of elements is 1140942 and nodes 973102, which proved to be applicable in the simulation.
Fig. 5Distribution of rock in coal seam
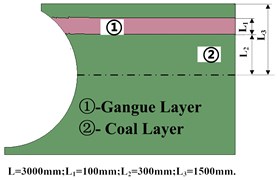
a) Gangue distributed on the top of coal
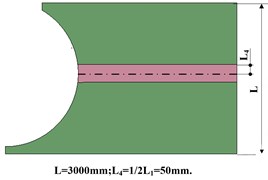
b) Gangue distributed on the middle of coal
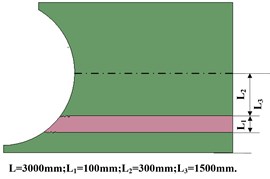
c) Gangue distributed on the bottom of coal
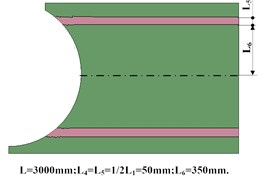
d) Gangue distributed on the top and bottom of coal
e) Gangue distributed on the top and middle of coal
f) Gangue distributed on the middle and bottom of coal
3. Test results and discussion
In the paper, the finite element method was used and the model of shearer drum was set up to explore the interaction between conical picks and coal, rock respectively. Besides, the distribution of rocks in the coal model and its influence on the force acted on conical picks will be studied in the paper too.
3.1. Continuity of coal cutting in different rock positions
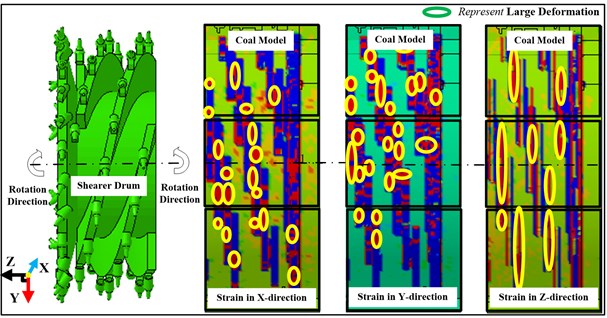
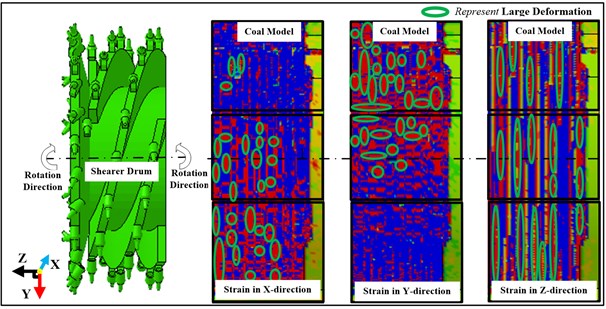
Fig. 6 shows the strain of coal and rock under the action of shearer drum. In Fig. 6(a) and (b), the figure on the left side is the finite model of shearer drum and the other three parts on the right are the strain diagram of coal and rock, which are the strain of coal and rock in , and direction respectively. What’s more, different colors correspond to the different strain and the color of red correspond to the maximum strain which means some coal or rock will be broken off from the whole part. For the convenience of observation, the area where the maximum strain appears has been marked with ellipse shape and the sizes of the ellipse represent the range of the maximum strain.
Fig. 6(a) and (b) shows strain of coal and rock at 0.5 s and 0.5 s after shearer drum works. From Fig. 6(a) to (b), the quantity and size of elliptical shape shows a remarkable increase. Besides, the majority of elliptical shapes in -direction are distributed on the middle and bottom of the coal model; On the contrary, in -direction, the majority of elliptical shapes are distributed on the top and middle of the coal model. In summary, we can get the conclusions that the component force in -direction is gradually decreased from the bottom to the top of the cutting range, and in -direction, the component force on the bottom, on the contrary, is smaller than that on the top of cutting range.
Fig. 6Strain on the coal and rock under pick cutting
a) Strain on the coal and rock under pick cutting at 0.05 s
b) Strain on the coal and rock under pick cutting at 0.5 s
In addition to finding the deformation and fragment of coal and rock visually, the mean and peak forces in , and direction can be gotten as shown in Table 5. However, fewer references showed the force on shearer drum and most research focused on the force on single pick. Therefore, to make comparison between simulation and experiment, the force on shearer cutting drum needed be converted into that on single pick. The total number of picks on shearer drum is 64 and there are always 32 picks simultaneously contacting with coal at any time. Therefore, it was the sum of all force on these 32 picks that was showed in Table 5 and the force on each pick can be obtained according to the Table 5. They were roughly equal to the total forces in Table 5 over the quantity of picks on drum and the force on single pick was shown in Table 6.
Table 6 showed the mean and peak force on a single conical pick. The results came from the processing results of simulation. Meanwhile, Luo and Sandro made these researches in experiment and the results are convinced to some extent. It can be seen that the results of mean force in and direction in the research of Luo and Sandro lies in the range of those gotten by simulation. As for the mean tractive force, the results gotten by simulation are closer to those done by Sandro. Two reasons can be speculated: (1) the interrelationship between picks might be ignored in the experiments of single pick cutting, which leads to little difference; (2) the force in direction is more prone to be affected and then fluctuate compared with the other two kinds of force, which can be proved in Sandro [39].
Table 5Force on shearer drum in conditions of coal cutting (units: KN)
Position | Mean force in direction | Mean force in direction | Mean force in direction | Peak force in direction | Peak force in direction | Peak force in direction |
Top | 1.80 | 15.31 | 3.64 | 20.97 | 31.53 | 78.62 |
Mid | 1.46 | 14.20 | 2.93 | 59.40 | 28.42 | 79.17 |
Bot | 2.41 | 14.34 | 3.34 | 55.70 | 30.90 | 84.72 |
Top-Bot | 1.99 | 16.54 | 3.64 | 55.50 | 31.60 | 72.81 |
Top-Mid | 3.41 | 20.97 | 1.02 | 52.69 | 30.36 | 60.45 |
Mid-Bot | 3.82 | 22.01 | 3.01 | 62.24 | 29.67 | 81.93 |
Table 6Force on a conical pick (units: KN)
Position | Mean force in direction | Mean force in direction | Mean force in direction | Peak force in direction | Peak force in direction | Peak force in direction |
Top | 0.06 | 0.47 | 0.11 | 0.65 | 0.98 | 2.45 |
Mid | 0.04 | 0.07 | 0.09 | 1.86 | 0.89 | 2.64 |
Bot | 0.07 | 0.44 | 0.10 | 1.74 | 0.96 | 2.47 |
Top-Bot | 0.06 | 0.52 | 0.11 | 1.73 | 0.98 | 2.28 |
Top-Mid | 0.11 | 0.66 | 0.03 | 1.64 | 0.95 | 1.89 |
Mid-Bot | 0.11 | 0.68 | 0.09 | 1.94 | 0.93 | 2.56 |
Force [39] | 0.08 | 0.50 | 0.07 | – | – | – |
Force [40] | 0.07 | 0.23 | 0.09 | – | – | – |
For further study, Fig. 7 shows the tendency towards the component force when rock is distributed in different situations. As Table 5 and Fig. 7(a) shows, the biggest mean force is found in the tractive force, which is about 10 times bigger than the other component forces and this conclusion also can be found in the reference written by Sandro Turchetta [39] and et al. Moreover, it can be found that the lower fluctuation exists in the mean tractive and axial force when compared with radial force and their mean deviations are 0.52 KN, 0.22 KN, 0.92 KN respectively. Different from the regularities of mean force, it is a general phenomenon that the peak of side force is larger than cutting force in any conditions of rock distributions. Moreover, the mean deviations of the tractive, radial and axial forces are 3.767 KN, 3.41 KN and 5.278 KN. Therefore, we can conclude that both values and fluctuation in the peak force are generally larger than that in the mean force.
Fig. 7Component forces of the interaction between cutter and coal under different distributions of rock
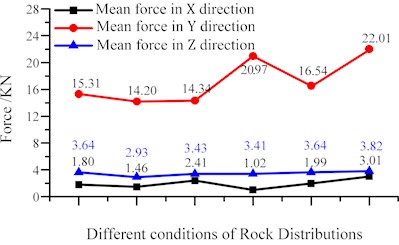
a) Mean component forces in different conditions
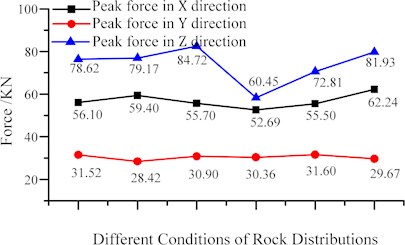
b) Maximum component forces in different conditions
In addition, some other regularity can be gotten from Fig. 7. As mentioned, one objective in this paper is to explore the relationship between cutting force and rock distributions. Once these regularities are applied into coal mining, some coping tactics can be made to weaken the resultant force. For example, shearer drum adjustment to alter the relative position between rock and cutting range might be one of effective ways to decrease the mean or peak cutting force. According to the phenomenon shown in Fig. 7(b), when most of rock is distributed in the middle of cutting range, the workers are able to adjust the shearer drum to the height of the top or bottom of cutting range if we want to reduce some vibration caused by the peak tractive force. After adjustment and calculation, the peak force in -direction can be cut down by 6.56 % compared to the average of peak force in -direction and 10.06 % compared to the maximum of peak cutting force appeared in other rock distributions. Therefore, rock distributed in the middle of coal seems better to decrease the resultant force than other case showed in Fig. 5.
Fig. 8Strain of coal under different rock distribution
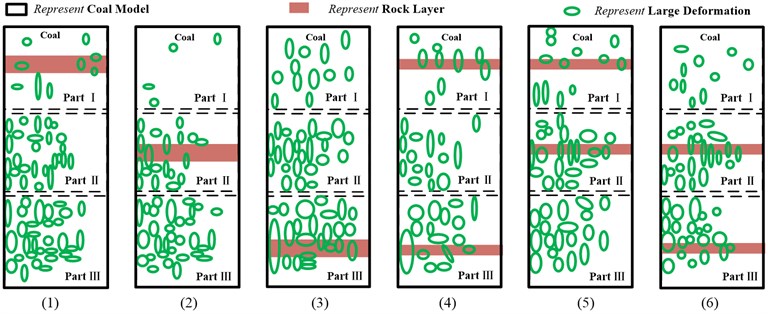
a) Strain of coal in direction under different rock distribution
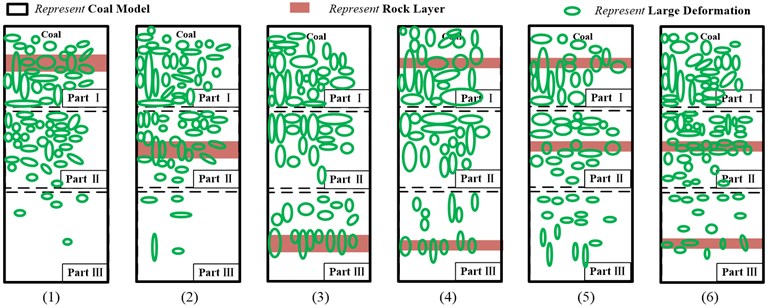
b) Strain of coal in direction under different rock distribution
In addition to the strategy exploration on how to weaken the resultant force in the complicated coal conditions, the size of flaking coal and rock under different cutting strategies is also needed to be studied and Fig. 8 shows the strain of coal and rock under different rock distributions. It is acknowledged that coal and rock will fall off from coal seam due to failure when the strain of them grows to a maximum. On basis of this, the positions of maximum strain fields should be an important characteristic to indicate the size of coal and rock flaked from coal seam. In other words, we can make a general understanding of conditions about the rock and coal fragment size according to the findings mentioned above.
From the Fig. 8, we can find that, in the and direction, when rock was distributed on the top and middle, the number of ellipse shapes which corresponds to the flaked coal and rock is much more than that on the bottom, but the size of the ellipse shapes is much smaller than that on the bottom. This means that the size of flaked coal and rock will be improved when the rock is distributed on the bottom of coal and that is what we want in the process of coal mining. Therefore, if we want to improve the block size of flaked coal in the complicated coal seam, height adjustment to make the rock distributed on the bottom of coal seam might be effective.
3.2. Rock cutting in different rock positions
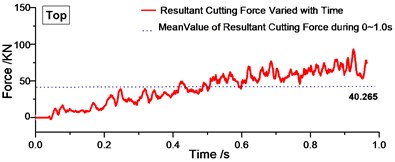
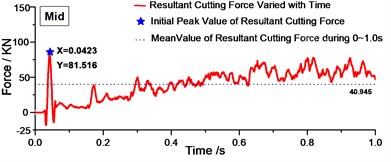
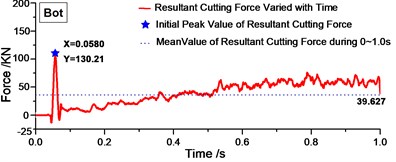
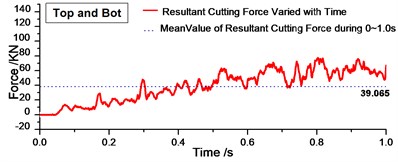
In the previous section, we have studied the influence of rock distribution on the continuity of coal cutting and in this section, we focus on the influence of rock distribution on the interaction between conical picks and rock. To make the study more organized, the process of rock cutting is divided into two stages according to the stress characteristic on rock and conical picks. The first stage is named with primary contact in which the force is characterized with gradual growth and lower values and the other is named with thorough contact in which the force is characterized with oscillation around their equilibrium positions and higher values. The study will be started with the first stage and Fig. 9 shows the resultant force acted on rock in the first stage.
Fig. 9Variation of resultant cutting forces with time during 0-1.0 s
a)
b)
c)
d)
e)
f)
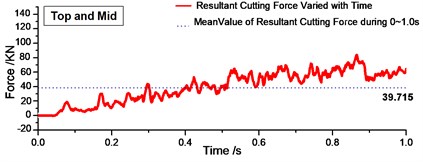
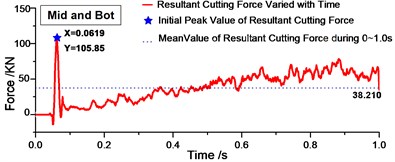
Fig. 9 shows the resultant forces varied with time during 0-1.0 s. From Fig. 9, we can find that there was one peak value at the beginning of cutting process in Fig. 9(b) (c) and (d), and this peak value is much larger than the mean value in the period of time. Therefore, for one layer of rock, when it was distributed in the top of the cutting range, the peak resultant force will not exist at the beginning of cutting, which might decrease shock on cutting bits effectively. The regularity can be validated in Fig. 9(d)-(f). Fig. 9(d)-(f) shows the resultant cutting force under two layers of rock. As long as the rock was distributed in the top of cutting range of drum shearer, there is no distinct peak value. Then we can get the conclusion that rock distributed in the top of cutting range will decrease the peak value at the beginning and decrease the cutting shock effectively.
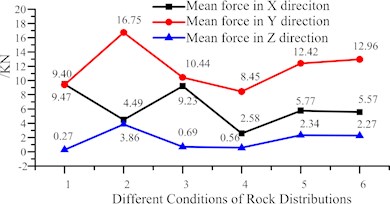
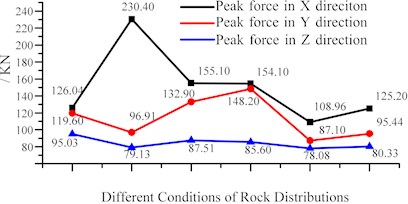
After complement of analysis on the first stage, the mean and peak value of component force in the second stage can be gotten from simulation results and they were shown in Table 7 and in Fig. 10.
Table 7Forces on shearer drum in conditions of rock (gangue) cutting (units: KN)
Position | Mean force in direction | Mean force in direction | Mean force in direction | Peak force in direction | Peak force in direction | Peak force in direction |
Top | 9.47 | 9.40 | 0.27 | 126.0 | 119.3 | 95.03 |
Mid | 4.49 | 16.75 | 3.86 | 230.4 | 96.91 | 79.13 |
Bot | 9.23 | 10.44 | 0.69 | 155.1 | 132.9 | 87.51 |
Top-Bot | 2.58 | 8.45 | 0.56 | 154.4 | 148.2 | 85.60 |
Top-Mid | 5.77 | 12.4 | 2.34 | 109.0 | 87.13 | 78.08 |
Mid-Bot | 5.57 | 12.96 | 2.27 | 125.2 | 95.44 | 80.33 |
Fig. 10Force on shearer drum in conditions of rock (gangue) cutting
a) Mean force under different rock distribution
b) Peak force under different rock distribution
We have studied the influence of rock distribution on the continuity of coal cutting and also gotten the relationship between mean/peak force and rock distribution in the previous section. Now, the relationship between mean/peak force and rock distribution will be studied again but in this part, the mean/peak force is the force acted on rock rather than coal. Some conclusions on the relationship between forces acted on rock and rock positions can be drawn in the Fig. 10. From the Fig. 10(a), smaller difference is shown between these component forces in different directions when compared with the component forces on coal. The regularity is also true in the peak component force just as shown in Fig. 10(b). Based on these regularities and combined with the mechanical properties of rock, we can find that the material properties will have some influence on the numerical difference between the component force in different directions and further study might be done to find the major parameters which will have a noticeable impact on the numerical difference of component forces.
After the study on the component forces, the resultant forces on rock in different rock distribution are also obtained and they were shown in Fig. 11.
Fig. 11Resultant forces on rock under different rock distribution
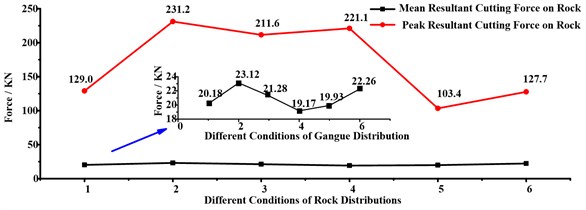
Fig. 11 showed the variation regularity of the mean and maximum resultant cutting forces on rock. From Fig. 11, the mean resultant cutting force varied with little fluctuation while the maximum resultant force varied with relatively larger fluctuation. After calculation of the data in Fig. 11, the mean deviations of these two curves were 1.58 KN and 50.63 KN respectively. According to this regularity, we can get the following conclusions: (1) the mean resultant cutting force is less affected by rock distribution; (2) the peak resultant cutting force is more vulnerable to the influence of rock distributions; (3) when the rock was distributed on the top of the cutting range, the peak resultant cutting force will reach the minimum and the mean resultant as well.
Through the analysis of the interaction between shearer drum and coal-rock, we can find that the position of rock would exert a certain influence on mean and peak force on shearer drum. In addition, the degree of difference is much different on mean and peak force when rock is distributed in different positions. In order to make description of these differences, the forces on coal and rock were processed and they were shown in Table 8. Table 8 showed the ratio of the force on coal to the force on rock. According to the statistical results, in mean force, the ratio of force on rock and coal is mainly distributed in the range of 0-1 KN, while most of ration in peak force is beyond 1 KN. In the peak force, the ration of force on rock and coal in direction is smaller than that in the other directions. In conclusion, the influence of rock on peak force is greater than that on mean force. In other words, compared with the peak force on coal, the peak force on rock is much more prone to be influenced by rock distributions.
Table 8Ratio of the force on coal to the force on rock in different rock positions
Mean force (KN) | Peak force (KN) | |||||
Top | 5.26 | 0.61 | 0.07 | 4.01 | 3.92 | 1.21 |
Mid | 2.80 | 1.18 | 1.32 | 3.88 | 3.40 | 0.99 |
Bot | 3.82 | 0.73 | 0.20 | 2.78 | 4.65 | 1.03 |
Top-Bot | 1.29 | 0.51 | 0.15 | 2.78 | 5.01 | 1.76 |
Top-Mid | 1.69 | 0.59 | 2.29 | 1.52 | 2.87 | 1.29 |
Mid-Bot | 1.45 | 0.59 | 0.75 | 2.01 | 3.22 | 0.98 |
4. Conclusions
To ensure the reliable results of this simulation, the model in the paper was set up based on shearer drum applied in actual working conditions and with this model, the dynamic process of coal cutting can be replicated in convenience. In this paper, on the one hand, we studied the influence of rock positions on the continuity of coal cutting; on the other hand, we also discussed the forces acted on shearer drum when cutting with rock under different rock distribution. Finally, we try finding the reasonable relative position of shearer drum and rock to minimize the vibration and cutting force. The followings are the conclusions obtained from numerical statistics and analysis:
(1) The mean force in -direction is little affected by rock distribution whether it is the cutting force between the picks and coal or the cutting force between the picks and rock. On the other hand, the peak force in -direction is influenced distinctly by the rock distribution and the peak force in -direction fluctuates largely under different rock distribution.
(2) The continuity of coal cutting can be affected by rock position. When the rock is distributed in the top or middle of the cutting range, the extra added peak force on coal will appears compared with the force in other distribution.
(3) The interaction between conical pick and rock can be affected by rock distribution. An extra augment of resultant peak force on rock will arise when the rock is distributed in the middle or bottom of cutting range, while the resultant peak force is lower in the other situations.
(4) Initial peak force exists in some conditions when the conical pick make first contact with rock. From research, the initial resultant cutting force will be prone to appear when the rock is distributed in the middle and bottom of the cutting range, while the initial peak force will be rarely existent in other situations.
References
-
Jiao L. Cause analysis and safeguard measures of shearer malfunction in Zhen-Chengdi coal mine. Coal Mine Modernization, Vol. 137, Issue 2, 2017, p. 105-106.
-
Zhong K., Zhou J. Static analysis mining equipment malfunction in Shendong mining area. Journal of Huainan Vocational and Technical College, Vol. 13, Issue 4, 2013, p. 1-8.
-
Zhou J. Fault statistics and causes analysis on coal shearer in Shendong mining area. Coal Science and Technology, Vol. 43, 2015, p. 139-143.
-
Evans I. A theory of the cutting force for point-attack picks. International Journal of Mining Engineering, Vol. 2, 1984, p. 63-71.
-
Goktan R. A suggested improvement on Evans’ cutting theory for conical bits. Proceedings of the 4th Symposium in Mine Mechanization Automation, Brisbane, Queensland, 1997.
-
Gao K., Du C., Jiang H., Liu S. A theoretical model for predicting the peak cutting force of conical picks. Frattura Ed Integrità Strutturale, Vol. 8, Issue 27, 2014, p. 43-52.
-
Keles S. Cutting Performance Assessment of a Medium Weight Roadheader at Cayırhan Coal Mine. M.Sc. Thesis, Middle East Technical University, Ankara, 2005.
-
Roxborough F., Phillips H. Experimental studies on the excavation of rocks using picks. Proceedings of the Third ISRM Congress of the International Society for Rock Mechanics, 1974.
-
Li D., Liu C. Development and experiment of cutting force model on conical pick cutting rock at different wedge angles. International Conference on Mechanics and Mechatronics, Changsha, China, 2015.
-
Moneim M., Castillo E., Morales F. A fundamental study of rock cutting I. Wear, Vol. 61, Issue 1, 1980, p. 31-41.
-
Wang C., Li G., Yao B. The experiment study of flat pick cutting coal and rock. Journal of Liaoning Technical University, Vol. 20, Issue 4, 2001, p. 487-488.
-
Ono T., Karasawa H., Misawa S. Influence of clearance and rake angles on the cutting force of rock. Journal Nire, Vol. 2, 1993.
-
Liu S., Ji H., Liu X., Jiang H. Experimental research on wear of conical pick interacting with coal-rock. Engineering Failure Analysis, Vol. 74, 2017, p. 172-187.
-
Wang Z., Xiong X., Zhang H., Chen D. Study on conical pick cutting using LS-DYNA. Journal of Vibration, Measurement and Diagnosis, Vol. 30, Issue 2, 2010, p. 163-165.
-
Samui P., Kumar R., Kurup P. Determination of optimum tool for efficient rock cutting. Geotechnical and Geological Engineering, Vol. 34, Issue 4, 2016, p. 1257-1265.
-
Gantt J., Gatzke E. High-shear granulation modeling using a discrete element simulation approach. Powder Technology, Vol. 156, Issues 2-3, 2005, p. 195-212.
-
Yang D., Li J., Wang L. Experimental and theoretical design for decreasing wear in conical picks in rotation-drilling cutting process. International Journal of Advanced Manufacturing Technology, Vol. 77, Issues 9-12, 2015, p. 1571-1579.
-
Zhou Y., Lin J. Modeling the ductile-brittle failure mode transition in rock cutting. Engineering Fracture Mechanics, Vol. 127, 2014, p. 135-147.
-
Jaime M., Zhou Y., Lin J., Gamwo J. Finite element modeling of rock cutting and its fragmentation process. International Journal of Rock Mechanics and Mining Science, Vol. 80, Issue 4, 2015, p. 137-146.
-
Mazurkiewicz D. Empirical and analytical models of cutting process of rocks. Journal of Mining Science, Vol. 36, Issue 5, 2000, p. 481-486.
-
Liu S., Ji H., Han D., Guo C. Experimental investigation and application on the cutting performance of cutting head for rock cutting assisted with multi-water jets. International Journal of Advanced Manufacturing Technology, Vol. 94, Issues 5-8, 2018, p. 2715-2728.
-
Santner T., Duffy D. The statistical analysis of discrete data. Technometrics, Vol. 33, Issue 2, 1989, p. 242-242.
-
Yudovich Y. Coal inclusions in sedimentary rocks: a geochemical phenomenon. International Journal of Coal Geology, Vol. 56, Issues 3-4, 2003, p. 203-222.
-
Huang H., Detournay E. Discrete element modeling of tool-rock interaction II: rock indentation. International Journal for Numerical and Analytical Methods in Geomechanics, Vol. 37, Issue 13, 2013, p. 1913-1929.
-
Richard T. Determination of Rock Strength from Cutting Tests. M.Sc. Thesis, University of Minnesota, Minnesota, 1999.
-
Menezes P., Lovell M., Avdeev I. Studies on the formation of discontinuous rock fragments during cutting operation. International Journal of Rock Mechanics and Mining Science, Vol. 71, 2014, p. 131-142.
-
Menezes P. Influence of rock mechanical properties and rake angle on the formation of rock fragments during cutting operation. International Journal of Advanced Manufacturing Technology, Vol. 90, Issues 1-4, 2017, p. 127-139.
-
Zhang Q., Han Z., Zhang M., Zhang J. Prediction of tool forces in rock cutting using discrete element method. Electronic Journal of Geotechnical Engineering, Vol. 20, Issue 5, 2015, p. 1607-1625.
-
Bilgin N., Demircin M., Copur H., Balci C., Akcin A. Dominant rock properties affecting the performance of conical picks and the comparison of some experimental and theoretical results. International Journal of Rock Mechanics and Mining Science, Vol. 43, Issue 1, 2006, p. 139-156.
-
Copur C., Bilgin H., Tuncdemir, Balci H. A set of indices based on indentation tests for assessment of rock cutting performance and rock properties. Journal of the Southern African Institute of Mining and Metallurgy, Vol. 103, Issue 9, 2003, p. 589-599.
-
Kel K., Akcin N., Tuncdemir H., Bilgin N. Cuttability characteristics of high strength rocks strength rocks for roadheader selection in Zonguldak Coalfiled. Proceedings of the 10th International Symposium on Mine Planning and Equipment Selection, New Delhi, 2001.
-
Wyk G., Els D., Akdogan G., Bradshaw S. M., Sacks N. Discrete element simulation of tribological interaction in rock cutting. International Journal of Rock Mechanics and Mining Science, Vol. 65, Issue 1, 2014, p. 8-19.
-
Doshvarpassand S., Richard T., Mostofi M. Effect of groove geometry and cutting edge in rock cutting. Journal of Petroleum Science and Engineering, Vol. 151, 2017, p. 1-12.
-
Huang J., Zhang Y., Zhu L., Wang T. Numerical simulation of rock cutting in deep mining conditions. International Journal of Rock Mechanics and Mining Science, Vol. 84, 2016, p. 80-86.
-
Wang S., Sloan S., Liu H., Tang C. Numerical simulation of the rock fragmentation process induced by two drill bits subjected to static and dynamic (impact) loading. Rock Mechanics and Rock Engineering, Vol. 44, Issue 3, 2011, p. 317-332.
-
Hallquist J. O. LS-DYNA Keyword User’s Manual, Version 970. Livermore Software Technology Corporation, California, 2003.
-
Kopp T., Stahl J., Demmel P., Volk W. Experimental investigation of the lateral forces during shear cutting with an open cutting line. Journal of Materials Processing Technology, Vol. 238, 2016, p. 49-54.
-
Özel T., Altan T. Process simulation using finite element method – prediction of cutting forces, tool stresses and temperatures in high-speed flat end milling. International Journal of Machine Tools and Manufacture, Vol. 40, Issue 5, 2000, p. 713-738.
-
Turchetta S., Polini W. Cutting force in stone lapping. International Journal of Advanced Manufacturing Technology, Vol. 57, Issues 5-8, 2011, p. 533.
-
Luo C., Jing S., Han X., Liu Y., Du C. Load characteristics of pick cutting coal seams with coal and rock interface. Jordan Journal of Mechanical and Industrial Engineering, Vol. 10, Issue 3, 2016, p. 205-210.
About this article

The National Natural Science Foundation of China (No. 51704178) and Natural Science Foundation of Shandong Province (No. ZR2017MEE034); Shandong Province Postdoctoral Innovation Project (No. 201603057); Qingdao Postdoctoral Applied Research Project (No. 2016120).
The authors declare no conflict of interest.
