Abstract
This paper focuses on FEM simulation model of pneumatic spring implemented into cushioning of a car seat. This spring is a part of a device which ensures controlled change pressure distribution in contact zone between car seat and passenger. This spring made up from silicone and foam parts and from the tape. In this article, the material properties of these materials are experimentally investigated in order to get parameters for their mathematical models implemented in FEM software MSC.Marc. The simulation of the spring is then carried out with changing internal pressure.
1. Introduction
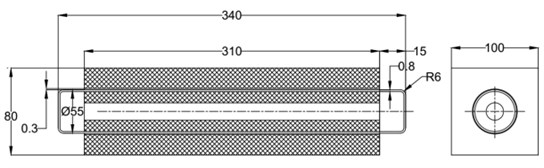
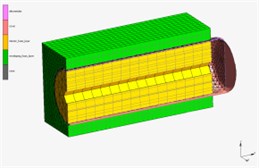
The seat with the implemented pneumatic spring contains an active vibration-isolation element in accordance with the patented solution [1]. The spring is made up from parts produces from different materials – foam, silicone and the material of tape. Mechanical properties of these materials are investigated experimentally to fit mathematical simulation models. The structure of FEM model of a pneumatic spring is shown in Fig. 1. When the pneumatic spring is supplied with compressed air, the silicone tube stretches and bulge at both ends, the cover tape layer keeps the tube’s shape and limits the deformation. The pressure inside the spring is generated against the external load which acts on outer foam. The pneumatic spring is a part of the system intended to change pressure distribution in the contact zone between the passenger and the seat or to reduce vibration load of the passenger during the car ride.
Fig. 1Scheme of the pneumatic spring.
2. Experimental setup
Based on suitable theories, the experiments were set up for purpose of obtaining the strain – stress data of materials.
2.1. Testing of silicone rubber membrane
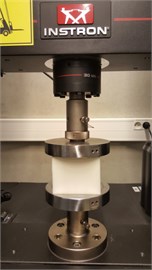
For investigation of properties of the silicone rubber membrane the bulge test was used (Fig. 2). Regarding the scheme in Fig. 3 the assumption of spherical shape of bulge was used. The deformation of the specimen in dependence on internal pressure is described by height and radius of bulge window.
In accordance with [2], the stress in a spherical membrane can be expressed by the formula:
where is the radius of the sphere, is the applied internal pressure and is the thickness of the membrane.
The thickness is given by equation [3]:
where is initial thickness of the membrane.
From the geometry of deformed membrane (Fig. 3) follows the relation Eq. (3) and Eq. (4) for radius and angle :
In this case engineering strain has to be derived by this way [3]:
where: is the initial length and instantaneous length of meridian curve of deformed membrane, , is the initial value of radius and angle respectively.
Fig. 2Experimental setup for testing of silicone membrane
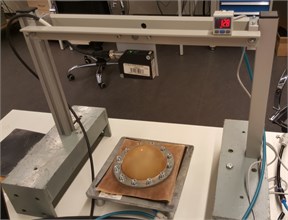
Fig. 3Setting up bulge test
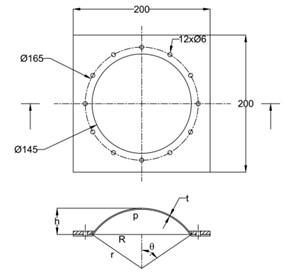
Fig. 4Experimental setup measurement of the a) foam and b) the tape
a)
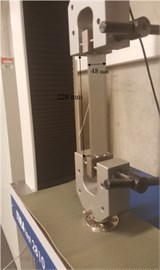
b)
2.2. Uniaxial compression test of foam
The strain energy function of finite hyperelasticity of compressible media is used to describe the elastic properties of open cell soft foams. To determine the constitutive equation the experimental data from a uniaxial compression test is used. Tested specimen was taken from a car seat cushioning and has dimensions 100×100×80 mm. The tests was conducted by means of Instron loading machine. Fig. 4(a) shows the experiment setup. The test was carried out under displacement control at a constant loading rate of 1 mm/s up to a given deformation 60 mm.
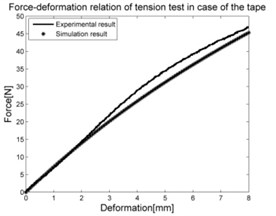
2.3. Uniaxial tensile test of the tape
The cover layer of pneumatic spring is made by several layers of adhesive tape along the silicone tube in order to limit its deformation. The specimen of the tape was 0.16 mm thick, 48 mm wide and 220 mm long. Uniaxial tensile test was conducted by means of Tira test 2810 machine showed in Fig. 4(b).
3. Experimental result of the material tests and input data for determining the mathematical model of the materials
In the experiments of materials, in case of silicone rubber, the raw result is the dependence of deformation-pressure, . In case of foam, the raw result is the relation of compressible deformation-force and for tape it is the dependence of tensile deformation-force shown in Fig. 5.
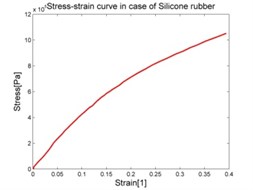
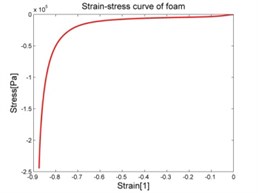
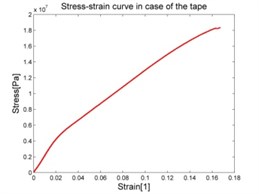
The purpose of collecting data from these experiments is to compute the stress-strain relation and use it as the input data for the experimental data fit function in the MSC.Marc. The stress-strain data is calculated by means of Matlab software and graphed as shown in the Fig. 6.
Fig. 5Raw experimental result of the material tests
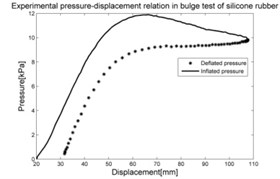
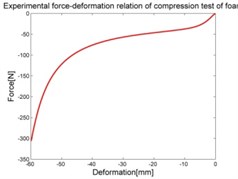
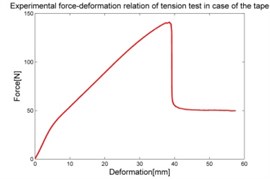
Fig. 6Stress-strain characteristic of materials
4. Selection of the appropriate mathematical model of materials and its identification
The simulation models of materials were identified in MSC.Marc by means of measured stress-strain data fit procedure. Then the experiments described above were reproduced by numerical simulation. For verification, the suitable mathematical model of elastomers is chosen for the materials.
4.1. Mathematical model of silicone rubber
In according with [4], rubber can be defined by a stored energy function as hyperelastic material. Conventional hyperelastic material models such as Ogden model works very well for silicone rubber. Ogden designed the energy function as separable function of principal stretch in generalized form:
where and are material constants
is the initial bulk modulus, is the volumetric ratio, defined as . Under consideration of incompressible material (1) and Ogden model selection for silicone rubber we can use a 3-term formulation with engineering stress- engineering strain curve for biaxial mode with engineering strain , [5], thus:
According to [5], in the material fitting data option in MSC.Marc the biaxial deformation mode is selected. The software automatically calculates results as follows: 1.21738×10⁸ Pa, 7.7123×10⁶ Pa, 117.45 Pa, 0.0110147, 0.0123274, 15.898, 3.5946×10⁹.
4.2. Mathematical model of a foam
In accordance with [4], the foam is considered as compressible materials and thus suitable material model us represented by function:
where , and are material constants and second term represents volumetric change, is the Jacobian measuring dilatancy defined as the determinant of deformation gradient (, where and refer to the deformed and original coordinates of the body) with , , [5]. For this deformation state we have: .
In the material fitting data option, uniaxial deformation mode was selected with the value of fictive poison’s ratio 0.1, material model is Foam with 3 terms (3). The results obtained are as follows: 4688.15Pa, 9.72738, –1.21592, 360734 Pa, –0.01998, 0.002497, –0.02778 Pa, –6.18115, 0.772644.
4.3. Mathematical model of the tape layer.
In case of the tape the Mooney-Rivlin material model can used in form [5]:
Experimental verification using uniaxial extension [5]: , . Hence:
The results obtained from material fitting data option are as follows: –2.55107×10⁸, 2.9003×10⁸, 1.18362×10⁸, –8.66098×10⁸.
Result of repeat plot of engineering stress-engineering strain curve and behavior of materials is shown in Fig. 8 and Fig. 9 respectively.
Fig. 8Repeat plot of engineering stress-engineering strain curve of materials
a) Rubber silicone
b) Foam
c) Tape
Fig. 9Repeat plot of engineering stress- engineering strain curve of materials
a) Rubber silicone
b) Foam
c) Tape
5. Comparison of experimental and simulation results
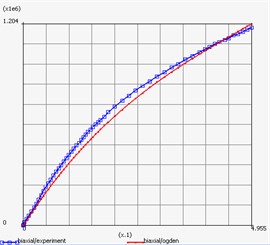
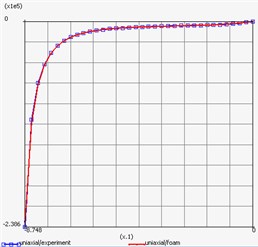
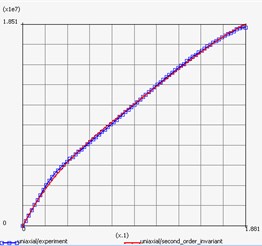
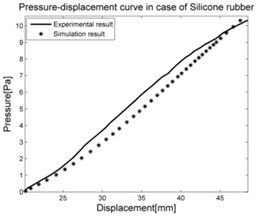
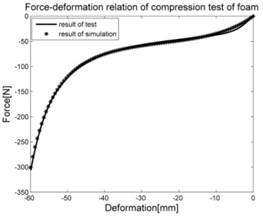
The load cases of individual parts described above were simulated by MSC.Adams with the same boundary and initial conditions and initial conditions as were used for experiments. The results in Fig. 10 show good correspondence of experimental and simulated data. Consequently, the structure assembled from individual parts is simulated.
Fig. 10Comparison between experimental results and simulation results of individual parts
6. Simulation of the pneumatic spring
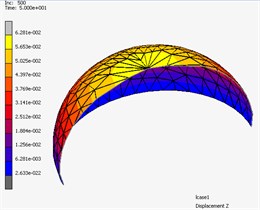
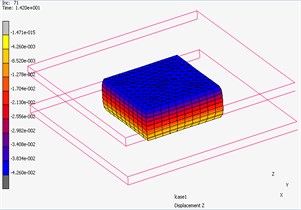
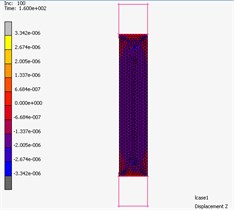
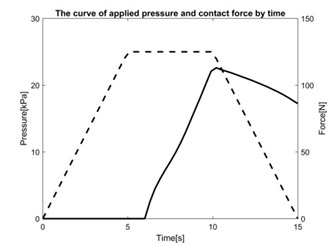
The indentor is acting by force to upper surface of the foam block. Inside this block the pneumatic spring reinforced by tape layer is inserted. The system works for 15 seconds, the pneumatic spring is supplied with compressed air in the first 5 seconds to achieve pressure from 0 to 25 kPa. Then the pressure will be controlled to keep constant in the next 5seconds, which would be ensured by means of electronic feedback control system in real case. In this time, the indentor goes down for 25 mm from the starting possition 5 mm above top surface of the foam layer. In the last 5seconds, the pressure is reduced back to 0 kPa. The simulation result of deformation is shown in Fig. 11 and the dependence of contact force between the indentor and pneumatic spring and supplied pressure inside pneumatic spring on time is shown in Fig. 12.
Fig. 11The 3D simulation of deformation in Marc
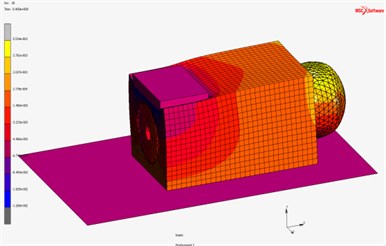
Fig. 12The curve of applied pressure and contact force by time
7. Conclusions
Material models of individual parts of pneumatic spring assembly were identified on the basis of experimental data with acceptable precision. After this the model of pneumatic spring assembly was created in MSC.Marc and the process of loading was simulated. This simulation demonstrates correct behavior of the pneumatic spring model consistent with reality. In future work the obtained simulation result will be compared in quantitative way with experiments.
References
-
CirklDavid Seat. Patent No. 303163, 2012.
-
Wu Chung-Lin, Fang Weileun, Yip Ming-Chuen Measurement of Mechanical Properties of Thin Films Using Bulge Test. SEM 10th International Congress and Exposition on Experimental and Applied Mechanics, 2004.
-
Holzapfel Gehard A. Nonlinear Solid Mechanics: A Continuum Approach for Engineering. Wiley, 2000.
-
Ali A., Hosseini M., Sahari B. B. A review of constitutive models for rubber-like materials. American Journal of Engineering and Applied Sciences Vol. 3, 2010, p. 232-239.
-
Experimental Elastomer Analysis. MAR103, 2010.
-
Cirkl David, Xuan Tien Tran Simulation model of seat with implemented pneumatic spring. Vibroengineering Procedia, Vol. 7, 2016, p. 154‑159.
About this article

This article was written at the Technical University of Liberec, Faculty of Mechanical Engineering with the support of the Institutional Endowment for the Long Term Conceptual Development of Research Institutes, as provided by the Ministry of Education, Youth and Sports of the Czech Republic in the year 2017.
