Abstract
One of the key issues encountered in development of condition monitoring systems for industry is definition of decision rules in diagnostic system for determined diagnostic features. In practice, it appears very often that proposed algorithm is not effective for all technical assets of machinery park. The major cause is usually related to smaller or higher diversity of objects, mainly in terms of design features, operating conditions and wear level. These factors directly influence the profile of measured vibration signals, diagnostic features, thresholds, decision rules and so on. In this paper authors propose the usage of Generalized Rule Induction (GRI) algorithm for association rules discovery from data base of the Computerized Maintenance Management System (CMMS) - patterns hidden in data reflecting existing processes phenomena, regularities, and expresses relationships between them. Such approach provides better interpretation of signals, and consequently, much more effective decision rules.
1. Introduction
Development of CMMS for complex machinery park is a tough challenge due to number of technical objects. It is very often related to high diversity of objects (even within a group of the same type of objects). These variety may occur due to: (a) design features (design, construction materials, components, their quality, collapsing or balance), (b) functionality, workload and human factors (engine starting methods, external load), (c) way of integrating with other technical objects, (d) environment factors (temperature, humidity, dustiness, salinity), (e) degradation process (different wear level of components) [1-6]. This usually causes application with a common diagnostic technique to be ineffective on all objects. One special case relates to rotating machinery, particularly where objects operate under non-stationary load. For these cases, condition monitoring as well as diagnostics are very difficult. This includes e.g. gearboxes of mining machinery, helicopters or wind turbines [7-13].
In this paper, authors consider the influence of different factors influencing signal profile and spectral features extracted from them. Investigated case study is mining conveying system consisted of over 220 gearboxes. There is very high diversity of technical objects according to mentioned above categories. For this case, long-term acquisition of operating and diagnostic data may provide knowledge discovery using typical data mining tools. Carrying out an exploratory data analysis is a key for many reasons. One of them is to recognize what determines signal variability. This allows to recognize patterns hidden in data matrix which are some simplification of existing processes phenomena, regularities and expresses relationships between them. Authors propose affinity analysis for extraction of formal rules (co-occurrence relationships among data) from comprehensive CMMS data base [14]. The Generalized Rule Induction algorithm (GRI) common used to perform so called market basket analysis has been proposed for the above-described purposes. A large source of data and information sources were used for the analysis.
The paper is organized as follows: a short technical and operating aspects of machinery park will be described; next diagnostic data base and problem of alarm threshold identification will be discussed; factors influencing spectral features have been formulated; in next step, methodology will be proposed; prepared data to analysis and procedure to association rules extraction will be shown; finally application of the method will be provided and results will be discussed.
2. Data acquisition system
Investigated case study is a conveyor system of one Polish underground copper ore mines. Machinery park includes over 80 conveyors combined in series in form of networked continuous transportation system. Conveyors are operated in 4-shift work, 6 days a week with the exception of short breakdowns for maintenance or repair purposes. More than 220 gearboxes propel this complex transportation system. Given the high investment and operating costs, online monitoring applications are usually excluded in the practise for this kind of machinery park. Thus, for investigated objects periodic monitoring has been proposed using portable data acquisition system. Measurements have been performed by using three accelerometers placed on the housings of gearboxes. Duration of measurements was equal to 60 seconds. Its sensor layer includes 3 accelometers assembled on gearbox body and tachometric probe directed toward gearbox input shaft. Quick measurement delivers 3 vibration signals and tachometric signal. Further processing comes down to diagnostic features extraction from vibration signals and calculation of rotational speed of gearbox input shaft from tacho signal in order to identify operating condition. Developed feature extraction procedure is based on segmentation of raw signal dividing it into 60 equal segments without overlapping. Next, every single 1 sec. segment of vibration signal is transformed into frequency domain and all components are summed in given spectrum frequency bands (for shafts: 10-100 Hz, for gears: 100-3 500 Hz, for bearings: 3 500-10 000 Hz). Finally, 60 sec. time series of three diagnostic features are extracted: (shafts condition), (gears condition) and (bearings condition) [15, 16].
2.1. Diagnostic data base - problem of thresholds identification
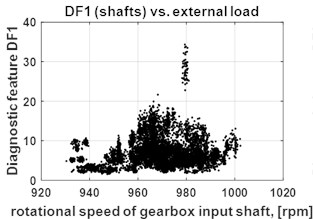
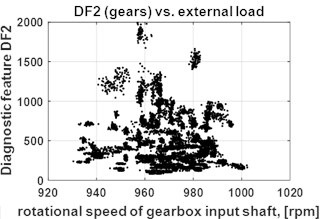
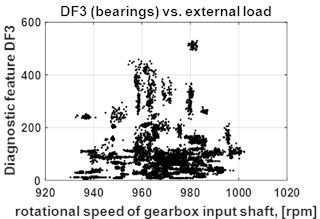
As a result of 4-years monitoring the diagnostic data base has been collected. Fig. 1 shows 155 measurements of diagnostic data presented as feature-operating condition space.
Fig. 1a) Diagnostic data base: diagnostic features DF1 (shafts) vs. external load, b) diagnostic features DF2 (gears) vs. external load, c) diagnostic features DF3 (bearings) vs. external load (right)
a)
b)
c)
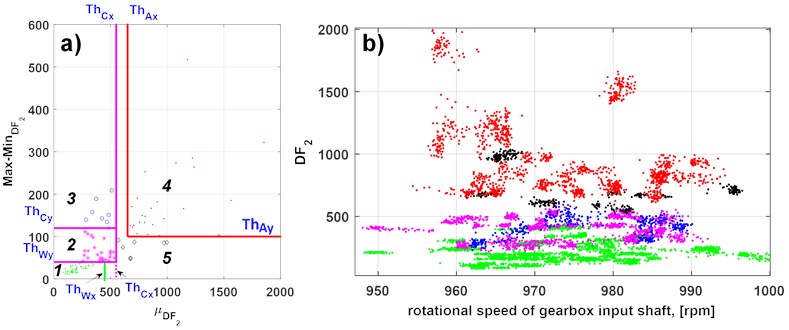
For the purpose of compound diagnosis of gearboxes, algorithm for identification of decision thresholds has been developed for , and features. Strong influence of operational parameters and wear level on spectral diagnostic features excludes usage of classical statistical methods to define a constant thresholds for measured diagnostic features. With reference to [8] a novel method for finding the decision boundaries has been proposed based on statistical analysis of diagnostic features and their load dependency. Readers interested in this method are referred to [2] where presented above diagnostics feature observations firstly have been divided into 5 clusters based on analysis of Max-Min vs. external load or vs. mean of diagnostic features.
Their appropriate combination allows to decompose primary data set into tri-state form and next, setting the thresholds for warning and alarm states as (operating conditions descriptors, machine condition descriptors), (see Fig. 2).
We believe that these different behaviors of machines are strongly dependent on: (a) operational parameters (rotational speed, external load), (b) design properties (technical configuration, modulus of elasticity etc.) and (c) degree of wear (e.g. pitting, scuffing).
Fig. 2Statistical analysis of diagnostic feature DF2: a) setting constraints related to high scatter and small values of features (ThAx,ThAy) as well as adding constraints related decomposition of warning class into 3 subclasses (ThCx,ThCy,ThWx,ThWy), b) visualization of data divided into 3 subclasses
2.2. Factors influencing spectral features
Monitoring of physical values is the basis of diagnosis of technical objects. Effective diagnosis requires determination of cause and effect relation between measured symptoms and real technical condition of objects. During initial analysis of variability of acquired diagnostic data as well as identification of thresholds for diagnostic features, a high diversity both on the level of raw vibration signal and on extracted spectral features has been noted. This heterogeneous nature of diagnostic data results from primary (design features), secondary (wear level of components) and motion (external load) factors that influence signal profile. Fig. 3 shows detailed systematization of primary, secondary and motion factors affecting signal profile [3, 8].
3. Methodology
In this section authors presented methodology for describing data clusters presented above (see Fig. 2). Operation data includes all diagnostic features statistics and rotational speed gearbox input shafts. Additionally, a large source of data and information sources was used for the analysis: (a) technical conditions of shafts, bearings and gear wheels, (b) operating and service data (rotational speeds of gearbox input shafts, register of emergency events), (c) technical and motion documentations etc.
To describe such big data base, authors used affinity analysis by applying Generalized Rule Induction algorithm (GRI) and interpreted taken rules for describing each cluster in data.
Fig. 3Factors that influence signal profile [3]
![Factors that influence signal profile [3]](https://static-01.extrica.com/articles/19082/19082-img5.jpg)
3.1. Preparation of data for analysis
First, diagnostic data modelling was performed – mean value and range were used to parameterize all diagnostic features and rotational speed of gearbox input shafts. The correlation coefficients between diagnostic data was also calculated. Additionally, all measurements were categorized according to design features of diagnosed objects (gearbox type, coupling type, engine type, length of conveyor, drive power, type of start-up etc.). In next step, technical condition of shafts, bearings and gears was determined based on diagnostic data. As a result, multivariate matrix of qualitative and quantitative data describing each individual measurement session was obtained.
3.2. GRI algorithm
Affinity analysis creates opportunity to define association rules. To obtain those rules, authors have chosen GRI algorithm. To use it, there also has to be defined minimal measure of support, precision and confidence level. The model of rules was defined as:
where and are two attributes, and are values in their respective discrete alphabets. Instead of using frequent collection of events, GRI uses information-theoretic approach to decide if considered rule is interesting. It is similar to decision trees algorithm. It splits the item set into antecedents and consequent . In our case we treat and as features. Generalized rule induction is based on -measure calculated as:
where: – probability or confidence of . It is measure of range of antecedents. It is calculated as frequency of in data, – probability or confidence of . It is a measure of range of consequent. It is also calculated as frequency of in data, – representing conditional probability or later, rule confidence of for given . It is probability measure of an event , given that has already occurred. In term of association rules is measured directly as confidence level of the rule.
-measure favors rules, which antecedents have big representation. It results with more rules, for which and has more extreme values. This preference measure can justify, which rules are the most important. Next thing is to interpret these rules and apply them to real data. More details about GRI and -measure can be found in Smyths paper [17].
4. Application to real data
GRI algorithm was initiated to real data matrix. Authors set support of the predecessor at ≥10 % and minimal confidence of rules at 10 %. This helps to eliminate rules with extreme low confidence level that GRI prioritize these with close to 0 or 1. For these parameters algorithm returned 111 rules. After verifying rules, they were interpreted and modified to describe clusters as shown in Table 1.
Table 1A summary of the identified rules in each cluster for association rules analysis. Number of cluster corresponds to Fig. 2
No | Symbol | Characteristic of cluster | Description of cluster |
1. | Good state – low value of and range of its measurement clouds. | Low, mean value of and . Low and high correlations between all three features. Low values and low range of . All of the observations in cluster 1. are representing drive units with fluid coupling. | |
2. | Warning state – medium values of and its range. | More than 60 % samples in this cluster are gearboxes on early stage fault of shafts and bearings. There are positive correlations between and as well as and . Rest of cases points at non-positive correlations, which represents bad condition of shafts or shafts and bearings. The special characteristic of this cluster is that measurements came from overpowered drive units. | |
3. | Warning state – low/medium values of and big range of point clouds. | High correlation between and as well as and . Half observations shows emergency or alarming state for shafts. In addition, the range of is medium or high and value of is low and its range is also low. | |
4. | Alarm state – high values of and ranges of point clouds. | Low correlation between and . Low – in 90 % cases the early stage fault of shafts has been detected. For more than 60 % observations shows: good condition of bearings – gearboxes featured by technical configuration engine – rigid coupling – fluid couplings – gear and low external load caused by overpowering. | |
5. | Alarm state – high values of point clouds of and row range. | There is warning or alarm state of shafts and bearings in 90 % observations. There is high correlation between and . In most of cases, there is no correlation between and . This cluster has big ranges for point clouds of both and . |
4.1. Results
Recognized patterns are only local features of individual data, and should refer to at most several variables or fragments of original records of descriptive data matrix. It is worth mentioning that the interpretation of the given rules should be preceded by verification [14]. The analysis of the rules allowed to determine the influence of the examined factors on the behavior and the form of measured symptoms.
5. Conclusions
The paper concerns significant issue related to interpretation of measured symptoms defined in order to make diagnosis for maintenance purposes. The authors propose affinity analysis for the needs of recognition of factors that influence on different forms of diagnostic features. Identification of patterns related to statistics of diagnostic features leads to discover how design features, operating conditions and wear level significantly influence those features. This results constitute an integral part of work related to identification of thresholds for investigated diagnostic features. Finally, obtained association rules allow to divide primary data set of diagnostic features from over 4 years of monitoring into tri-state form – good condition, warning and alarm state.
References
-
Król R., Kisielewski W., Kaszuba D., Gładysiewicz L. Testing belt conveyor resistance to motion in underground mine conditions. International Journal of Mining, Reclamation and Environment, Vol. 31, 2017, p. 78-90.
-
Zimroz R., Stefaniak P. K., Bartelmus W., Hardygora M. Novel techniques of diagnostic data processing for belt conveyor maintenance. Proceedings of the 12th International Symposium Continuous Surface Mining-Aachen 2014, p. 31-40.
-
Bartelmus W. Condition Monitoring of Open Cast Mining Machinery. Oficyna Wydawnicza Politechniki Wrocławskiej, 2006.
-
Galar D., Gustafson A., Tormos B., Berges L. Maintenance decision making based on different types of data fusion. Eksploatacja i Niezawodnosc – Maintenance and Reliability, Vol. 14, 2012, p. 135-144.
-
Kacprzak M., Kulinowski P., Wedrychowicz Computerized D. Information system used for management of mining belt conveyors operation. Eksploatacja I Niezawodnosc – Maintenance and Reliability, 2011, p. 81-93.
-
Jurdziak L., Krol R., Kawalec W. Variation of ore grade transported by belt conveyors to processing plants. Physicochemical Problems of Mineral Processing, Vol. 53, 2017, p. 656-669.
-
Wodecki J., Stefaniak P., Obuchowski J., Wylomanska A., Zimroz R. Combination of principal component analysis and time-frequency representations of multichannel vibration data for gearbox fault detection. Journal of Vibroengineering, Vol. 18, 2016, p. 2167-2175.
-
Zimroz R., Bartelmus W., Barszcz T., Urbanek J. Diagnostics of bearings in presence of strong operating conditions non-stationarity-a procedure of load-dependent features processing with application to wind turbine bearings. Mechanical Systems and Signal Processing, Vol. 46, 2014, p. 16-27.
-
Zak G., Wyłomanska A., Zimroz R. Application of alpha-stable distribution approach for local damage detection in rotating machines. Journal of Vibroengineering, Vol. 17, 2015, p. 2987-3002.
-
Kruczek P., Obuchowski J., Wylomanska A., Zimroz R. Cyclic sources extraction from complex multiple-component vibration signal via periodically time varying filter. Applied Acoustics, Vol. 126, 2017, p. 170-181.
-
Wodecki J., Zdunek R., Wyłomanska A., Zimroz R. Local fault detection of rolling element bearing components by spectrogram clustering with semi-binary NMF. Diagnostyka, Vol. 18, 2017, p. 3-8.
-
Wyłomanska A., Ak G., Kruczek P., Zimroz R. Application of tempered stable distribution for selection of optimal frequency band in gearbox local damage detection. Applied Acoustics, Vol. 128, 2016, p. 14-22.
-
Baglee D., Knowles M., Kinnunen S.-K., Galar D. A proposed maintenance strategy for a wind turbine gearbox using condition monitoring techniques. International Journal of Process Management and Benchmarking, Vol. 6, 2016, p. 386-403.
-
Raorane A., Kulkarni R., Jitkar B. Association rule-extracting knowledge using market basket analysis. Research Journal of Recent Sciences, Vol. 2277, 2012, p. 19-27.
-
Stefaniak P., Wodecki J., Zimroz R. Maintenance Management of Mining Belt Conveyor System Based on Data Fusion and Advanced Analytics. Springer International Publishing, 2018, p. 465-476.
-
Stefaniak P. K., Zimroz R., Bartelmus W., Hardygóra M. Computerised decision-making support system based on data fusion for machinery system’s management and maintenance. Applied Mechanics and Materials, Vol. 683, 2014, p. 108-113.
-
Smyth P., Goodman R. M. An information theoretic approach to rule induction from databases. IEEE Transactions on Knowledge and Data Engineering, Vol. 4, 1992, p. 301-316.
About this article

This work is supported by the Framework Programme for Research and Innovation Horizon 2020 under Grant Agreement No. 636834 (DISIRE – Integrated Process Control based on Distributed In-Situ Sensors into Raw Material and Energy Feedstock).
