Abstract
Driving tests that have been performed for many years are not representative of actual vehicle operating conditions in terms of emissions and fuel consumption. This paper presents the research results of a new Worldwide harmonized Light duty Test Cycle (WLTC), that takes into account situations occurring in traffic inside and outside the city and on highways in Europe, India, Japan, Korea and USA. Conducted analysis demonstrated a multifractal nature of vehicle speed time signal, typical for he processes of asymmetric generalized multiplicative cascade.
1. Introduction
Vehicle Driving Cycles (VDC) are chassis dynamometer tests for determining emission and fuel consumption of vehicles and engines. Several hundred practical driving cycles resulted from research conducted in different countries and regions of the world. The majority of current vehicle emission testing is based on the principle of faithful time-based simulation. VDC consists of a time series of data representing vehicle speed, that is supposed to reflect motion of the vehicle in actual road conditions [1]. The most popular tests include FTP-75 (Federal Test Procedure) applied in the USA, European NEDC (New European Driving Cycle), or JC08 applied in Japan. NEDC is a synthetic cycle of theoretical driving profile, while the other two are based on the actual usage data. Different methods may be used to determine driving cycles [2-4].
In the pursuit of establishing a more dynamic harmonized test cycle, new Worldwide harmonized Light duty Test Cycle (WLTC) was developed. This procedure is based on actual driving profiles from statistical studies [5], with the transition from NEDC to WLTC in years 2017-2019. Each methodology for developing driving tests requires analysis of the nature of registered operational signals of vehicle speed. Most real time signals, including time series of vehicle motion speed in real road conditions exhibit non-stationarity and non-linearity as well as statistical multi-scalability. In practice, this means that the analysis of registered time series requires application of non-linear analysis methods. A good way of modelling such signals is to apply methods of multifractal formalism, using local measures of power character [6-10].
The aim of the research is to determine multifractal character of time signal of the WLTC cycle. The concept of multifractal analysis method is described in Section 2. The results of the analysis with reference to the WLTC driving cycle of the harmonized procedure of light vehicle testing are presented in Section 3 and Section 4 contains a summary of the entire paper.
2. Singularity spectra of time series
The rapid changes observed in time series of driving cycles may be regarded as singularities measured by the so-called Holder point exponents , describing the level of fluctuation of the amplitude of signal , 1, 2,…, , in the vicinity of point , according to the power relation [11, 12]:
Differentiation of functions for a certain number of time proves the degree of its regularity. Similarly, the Holder point exponent described the regularity of the function. The greater the local regularity of time series, the higher singularity point exponent. Multifractal spectrum is presented on the histogram of Holder exponents and determines fractal dimensions of the singular subsets of the given exponent value. Method of estimation of multifractal spectrum of WLTC signal applied in the research is based on the detrended fluctuations analysis algorithm [13-14]. The procedure leads to determination of power relation of a fluctuation of order:
For multifractals, generalized Hurst exponent is a decreasing function. For negative values of order, the exponent describes property of scaling in segments of lower level of fluctuation; on the contrary, if we consider positive values of order, the segments with high variance values form the fluctuation function.
The generalized scaling exponent and multifractal spectrum are defined by the following formulas:
where the Holder singularity exponent :
Multifractal spectrum is a convex function and the singularity exponent is a monotonically decreasing function. The pairs and are bound by the Legendre transformation. The width of the singularity spectrum reflects the number of Holder exponents. The following parameters allow a description of dynamic properties of the system based on the multifractal spectrum of the time series:
• The level of multifractality determined by singularities of highest and lowest fluctuation of the observed signal and ,
• The span of dimensions of singularities’ subset .
3. Multifractal analysis of emission test cycles WLTC
Driving tests that have been applied for many years are not representative of actual operating conditions of vehicles. In consequence vehicle emission and fuel consumption are underestimated. More reliable combustion rates during simulation of real operating conditions of the vehicle on the dynamometer tests should be provided by the WLTC, resulting from Worldwide harmonized Light vehicles Test Procedures (WLTP) [15]. The WLTP procedures includes several WLTC test cycles applicable to vehicle categories of different power-to-mass ratio (PMr). The synthesis was based on data on traffic parameters in Europe, India, Japan, Korea and USA, taking into account situations associated with driving in the city, outside the city and on highways. As compared to NEDC, test cycle is longer, significantly more dynamic, includes a lot more acceleration and braking cycles, shorter breaks and greater value of average and maximum speed. Due to the introduced changes, WLTC driving cycle will provide more precise conditions for calculating fuel consumption and exhaust emissions. It will be applied for the first time in vehicle models launched in September 2017. WLTC driving cycle is divided into four parts, corresponding to different speeds: low, medium, high and very high. If the maximum speed does not exceed 135 km/h, part of very high speed should be substituted with part of low speed. WLTC time cycle for vehicles with power to mass ratio PMr > 34 is presented in Figure 1, and its basic parameters in Table 1. For this type of vehicles driving dynamics is determined by the driver’s behavior and traffic intensity, and not by technical parameters of the vehicle.
Fig. 1WLTC driving cycle
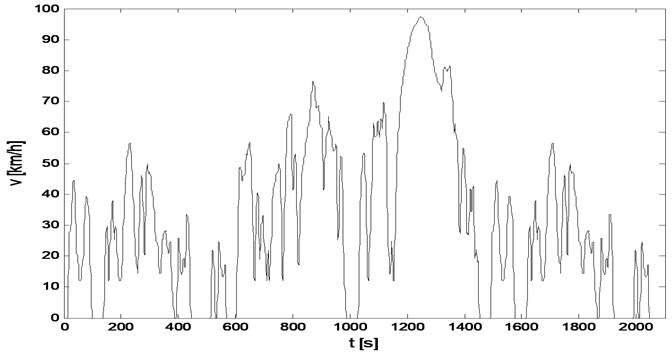
Table 1Basic parameters of WLTC cycle for Class 3b vehicles
Phase | Duration s | Stop duration s | Distance m | km/h | m/s2 | m/s2 | |
Low | 589 | 156 | 3095 | 26,5 % | 56,5 | –1,47 | 1,47 |
Medium | 433 | 48 | 4756 | 11,1 % | 76,6 | –1,49 | 1,57 |
High | 455 | 31 | 7162 | 6,6 % | 97,4 | –1,49 | 1,58 |
Extra-High | 323 | 7 | 8254 | 2,2 % | 131,3 | –1,21 | 1,03 |
Total | 1800 | 242 | 23266 |
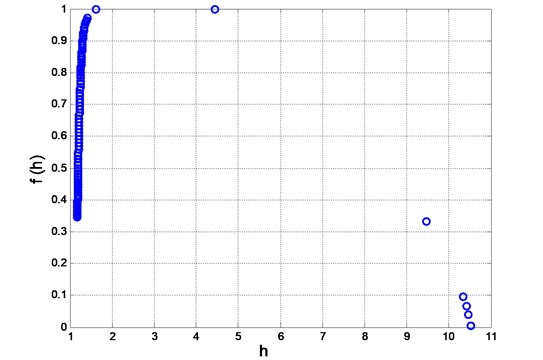
Holder singularity exponents and singularity spectra for examined WLTC driving cycle presented in Fig. 2 and Fig. 3 respectively confirm its multifractal nature. The level of multifractality amounts to: 9,37, and the span between the dimensions of segments with the highest and the lowest probability is 0,33. The most common singularity exponents refer to those fragments of registered time series which are described by greatest variability. The lowest probability of registration refers to the driving periods of highest regularity. The majority of points is concentrated around dimensions corresponding to singularities with the highest and lowest fluctuation of the time series of the vehicle’s speed.
Fig. 2Holder singularity exponents for WLTC 3b
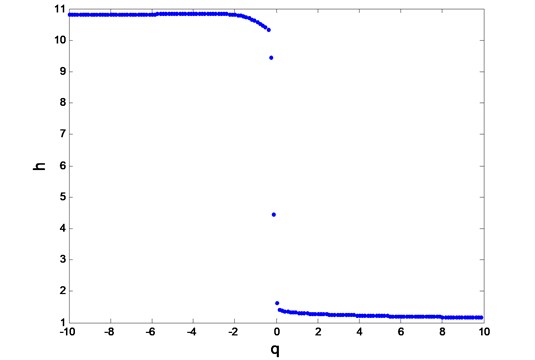
Fig. 3Singularity spectrum for WLTC 3b
4. Conclusions
The synthesis of WLTC driving cycle was made on the basis of data concerning actual parameters of traffic of light vehicles in different parts of the world, with regard to situations associated with driving in the city, outside the city and on highways. Performed analysis demonstrated multifractal nature of the time series of the vehicle’s speed within WLTC driving cycle. If spectra of two different signals have similar properties, then statistical similarity also applies to the dynamics of their corresponding processes. This opens the perspective of modelling driving cycles with application of criterion of similarity of multifractal spectra of signals registered in the real driving conditions and on-the-spot tests. The spectral path, concentrating around two values of Holder singularity exponents indicates occurrence of analogous properties for multifractals obtained as a result of implementation of the process of binominal multiplicative cascade. Moreover, asymmetrical distribution of the values of functions of singularities exponents is a feature of the process of asymmetrical generalized multiplicative cascade [16]. The model of such process is described by a 5-parameter function.
References
-
Worldwide Emission Standards. Passenger Cars and Light Duty Vehicles. Delphi. Innovation for the Real World, 2016/2017.
-
Chłopek Z. Synthesis of driving cycles in accordance with the criterion of similarity of frequency characteristics. Maintenance and Reliability, Vol. 18, Issue 4, 2016, p. 572-577.
-
Qin Shi, et al. The study of a new method of driving cycles construction. Procedia Engineering, Vol. 16, 2011, p. 79-87.
-
Merkisz J., et al. Development of the methodology of exhaust emissions measurement under RDE conditions for NRMM vehicles. IOP Conference Series: Materials Science and Engineering, 2016.
-
Sileghem L., et al. Analysis of vehicle emission measurements on the new WLTC, the NEDC and the CADC. Transportation Research Part D, Vol. 32, 2014, p. 70-85.
-
Dai M., Zhang Ch., Zhang D. Multifractal and singularity analysis of highway volume data. Physica A, Vol. 407, 2014, p. 332-340.
-
Puchalski A., Komorska I. Looking for vibrational measure of vehicle powertrain using multifractal analysis. Vibroengineering Procedia, Vol. 3, 2014, p. 351-356.
-
Puchalski A. Multiscale analysis of vibration signals in engine valve system. Journal of Vibroegineering, Vol. 17, Issue 7, 2015, p. 3586-3593.
-
Puchalski A., Komorska I. Stable Distributions and Fractal Diagnostic Models of Vibration Signals of Rotating Systems. Advances in Condition Monitoring of Machinery in Non-Stationary Operations. Applied Condition Monitoring. Springer International Publishing, AG (9), 2018, (in Press).
-
Shang P., Lu Y., Kamae S. Detecting long-range correlation of traffic time series with multifractal detrended fluctuation analysis. Elsevier, Chaos, Solitions and Fractals, 2008, p. 82-90.
-
Loutridis S. J. An algorithm for the characterization of time-series based on local regularity. Elsevier, Physica A, Vol. 381, 2007, p. 383-398.
-
Shang P, Lu Y., Kamae S. The application of Holder exponent to traffic congestion warning. Elsevier, Physica A, Vol. 370, 2006, p. 769-776.
-
Kantelhardt J. W. Fractal and Multifractal Time Series. Mathematics of Complexity and Dynamical Systems, 2011, p. 463-487.
-
Kantelhardt J. W., et al. Multifractal detrended fluctuation analysis of nonstationary time series. Elsevier, Physica A, Vol. 316, 2002, p. 87-114.
-
Mock P., et al. The WLTP: How a new test procedure for cars will affect fuel consumption values in the EU. International Council on Clean Transportation, Working Paper, 2014.
-
Cheng Q. Generalized binomial multiplicative cascade processes and asymmetrical multifractal distributions. Nonlinear Processes in Geophysics, Vol. 21, 2014, p. 477-487.
About this article

