Abstract
Experimental investigations of the polymeric films HDPE and PP and of the multi-layered material PET+LDPE with defects (puckered surfaces, holes and segregation of the upper layer) were performed. For this purpose, the method of projection moiré was used. In the process of investigations, the images of the defects were determined. During the experimental investigations it was determined that the images and shapes of the eigenmodes, as well as the frequencies and amplitudes of vibrations change due to mechanical or structural defects in the polymeric films and because of symmetrical or un-symmetrical loading. Typical optical images for various types of defects were determined. In the paper smoothness of fringes by using the method of time averaged geometric moiré is also investigated. On the basis of a one dimensional model graphical relationships for linear variation with respect to longitudinal coordinate of amplitude of vibrations are obtained. They provide the background for the choice of the required number of images in a period of oscillations for different smoothnesses of moiré fringes.
1. Introduction
In the process of production of polymeric materials and using them in technological operations of printing, packaging, etc., various mechanical defects often take place: tears, holes, cuts, segregation of separate layers of multi-layered materials, etc. Also, the polymeric films themselves may be of non-uniform density, their thickness in the direction of the width of the tape may differ. Such mechanical and structural defects take place when the parameters of the process of extrusion are incorrectly chosen during the production (inflation) of the polymeric film. Those defects directly deteriorate the final quality of the product (package, published material, label or bag). This problem is especially important for thin mono-layered and multi-layered polymeric films, which during the technological operations and exploitation are exposed to high pressures, extensions, varying temperatures and vibrations [1-3].
Current market requirements among the producers of polymeric packages are increasing. Thus, the requirements for mechanical, thermomechanical, qualitative and other parameters became higher. Quality of production processes of packages to a large amount depends on qualitative parameters of the polygraphic materials (polymeric films) [4, 5].
Detection of the defects in polymer films by non-destructive methods is of great interest [6-9]. Systems capable to detect defects are used in the laboratories, on the production lines and on the final product inspection stations.
Visual measurement is introduced into manufacturing process of polymeric film for defect inspection, alignment, positioning and possible stoppage of the process due to the defect detection. Commonly, the methods of visual measurement are subject to variable illumination and surface states, the method of projection moiré is recommended because of reliability, simplicity and abundant information about it [10-12]. It should be admitted that such optical methods are not developed sufficiently for identification of the qualitative parameters of polymeric films.
Thus, the aim of this work is to expand the possibilities of non-destructive identification of defects of polymeric films using the method of projection moiré.
In the paper smoothness of fringes by using the method of time averaged geometric moiré is investigated. On the basis of a one dimensional model graphical relationships for linear variation with respect to longitudinal coordinate of amplitude of vibrations are obtained. They provide the background for the choice of the required number of images in a period of oscillations for different smoothnesses of moiré fringes.
This paper continues the analysis of time averaged moiré techniques presented in [13]. Similar problems are analyzed in [14-25] and in a number of other related papers.
2. Experimental setup and method of investigation using the method of projection moiré
To determine the dynamical characteristics of polymeric films with and without defects (holes and cuts) for symmetric and un-symmetric loading of the tape the special setup for projection moiré experimental investigations was used.
The experimental setup consists of the vibration generator G3-111, amplifier LV-103, vibro-exciter VEB Robotron Messelektronik 11076, investigated polymeric film, digital image camera Edmund Optics EO-1312C USB Camera, personal computer, ink printer HP Deskjet 920c and the optical setup of the projection moiré.
In case of symmetric loading of polymeric film, the load was distributed symmetrically with respect to the centre line of the tape of the polymeric film by loading both of its sides with the equal load. Meanwhile for un-symmetrical loading the load at the left side of the polymeric film was bigger than at the right side. In the experiment projection moiré was implemented by projecting thin parallel lines of high contrast with light ray’s incident to the surface of the vibrating polymeric film.
In the process of investigation sinusoidal longitudinal vibrations of the chosen frequency were generated in the setup for analysis of vibrations that generated eigenmodes in the polymeric film.
The ends of the investigated sheet of polymeric film were fastened between pressing tapes. One of the pressing tapes was fastened to the exciter of vibrations while the other pressing tape was loaded symmetrically by the force of 25.5 N. In case of un-symmetrical loading the force at the left side was 22.5 N and at the right side was 27.5 N. Vibroexciter was generating longitudinal vibrations of sinusoidal shape of chosen frequency, which excited eigenmodes in the analysed polymeric film. For the visualization of modes of propagating waves, the method of projection moiré was used. The grid of thin parallel lines of high contrast of specially chosen step was projected at a definite angle to the surface of the investigated material. In this method, the eigenmodes were photographed by a digital camera and then processed in the monitor of a personal computer.
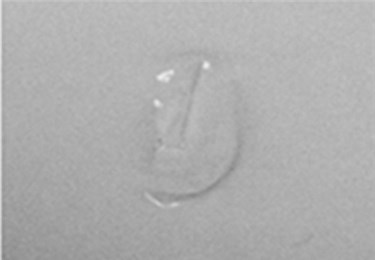
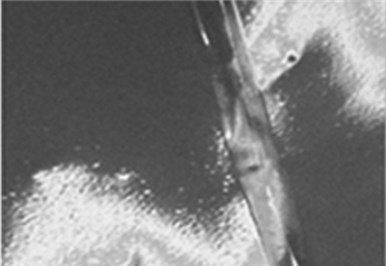
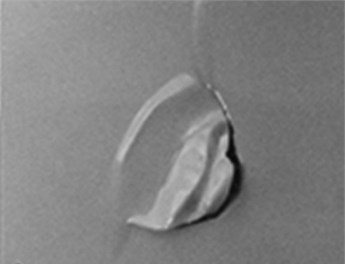
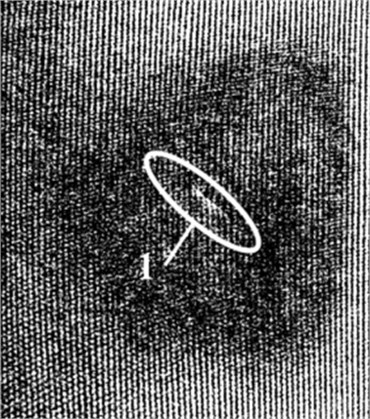
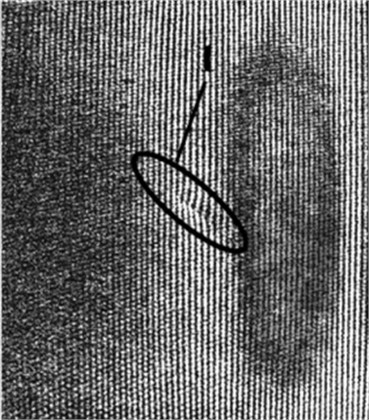
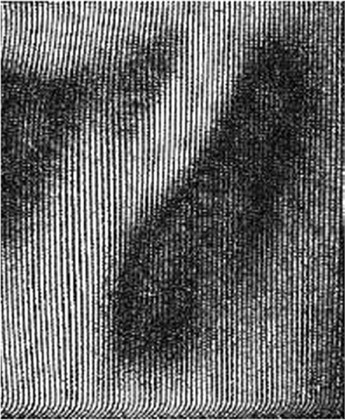
In the experimental tests, samples of polymeric film and multi-layered material of rectangular geometrical shape (0.2 × 0.05 m) were produced. The views of defects of the polymeric films are presented in Fig. 1.
For the study of defects, the following polymeric films were chosen: HDPE, PP, as well as multilayered material PET+LDPE. Main characteristics of the materials are presented in Table 1.
Table 1Main technical characteristics of the polymeric materials
Qualities | HDPE | PET+LDPE | PP |
Surface density, g/m2 (by ISO 536) | 61 | 101 | 137 |
Thickness, μm (by DIN 534) | 60 | 90 | 130 |
Surface morphology Ra, μm | 0.18 | 0.17 | 0.14 |
Gloss (45°), % (by ISO 14086) | 14.3 | 67.7 | 46.4 |
The tests were carried out at the temperature 22° C and air humidity 50 ± 2 %.
Fig. 1Upper views of defects of the polymeric films: a) polymeric film HDPE with puckered surface; b) segregation of the clear upper layer (PET) of the multi-layered material PET+LDPE; c) upper view of the polymeric film PP with a hole
a)
b)
c)
3. Experimental results by using the method of projection moiré
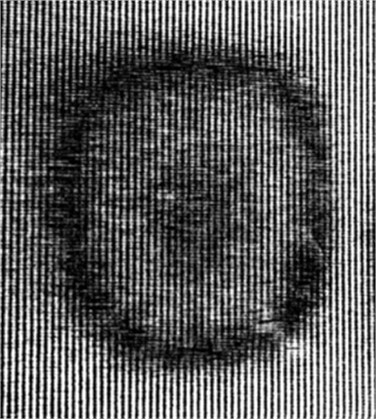
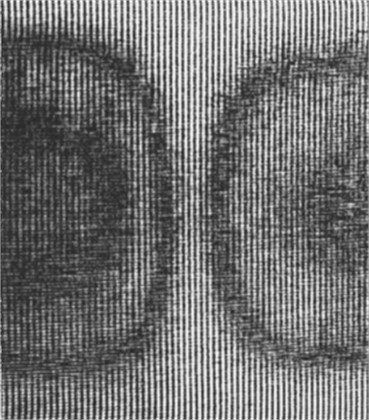
The dynamical characteristics of polymeric film PP with and without defects under symmetric loading were acquired by using a projection moiré experimental setup. The images of the first and second eigenmodes without defects (Fig. 2(a) and Fig. 2(c)) and the images of the eigenmodes of the tape of polymeric film with defects (Fig. 2(b) and Fig. 2(d)) are shown for comparison.
As can be seen from Fig. 2 by exciting the polymeric film PP (without defects) by periodic longitudinal vibrations of sinusoidal shape the images of eigenmodes obtained by using the method of projection moiré are sharp and clear with definite contours. When there is a cut located in the centre of the polymeric material, the images of eigenmodes are not so clear (Fig. 2(b) and Fig. 2(d)) and it is more difficult to determine the number of the eigenmode from the obtained image. For those defects, supplementary moiré clouds are observed, they sometimes may be considered as a number of a lower or higher eigenmode. By comparing the moiré clouds occurring in Fig. 2(a) and Fig. 2(c) one can note that the image of the first eigenmode (Fig. 2(a)) consists of one sharp moiré cloud and in Fig. 2(c) one can count already two moiré clouds. In this case in order to identify the number of the eigenmode it is insufficient to have the moiré images only. One is to have in mind the frequency of vibrations and their amplitude. When analysing the changes of frequency and amplitude in the polymeric material PP without defects with the change of the number of the eigenmode one can note that for higher numbers of eigenmodes the frequency of vibrations increases and the amplitude becomes a little smaller (compare Fig. 2(a) and Fig. 2(c): the frequency of vibrations increases from 96 Hz up to 124 Hz, and the amplitude decreases from 1.5∙10-5 m up to 1.3∙10-5 m). By comparing the frequencies and amplitudes of vibrations of the same eigenmode one can note that the frequency of vibrations becomes smaller and the amplitude of vibrations increases (compare Fig. 2(a) and Fig. 2(b): the frequency of vibrations decreases from 96 Hz up to 92 Hz and the amplitude of vibrations increases from 1.5∙10-5 m up to 2.5∙10-5 m) in the presence of the defects.
Fig. 2The eigenmodes of the polymeric film PP under symmetric loading: a) first eigenmode without defects – frequency of vibrations 96 Hz, amplitude 1.5∙10-5 m; b) first eigenmode with the hole in the centre – frequency of vibrations 92 Hz, amplitude 2.5∙10-5 m; c) second eigenmode without defects – frequency of vibrations 124 Hz, amplitude 1.3∙10-5 m; d) second eigenmode with the hole in the centre – frequency of vibrations 120 Hz, amplitude 1.8∙10-5 m; 1 – the cut
a)
b)
c)
d)
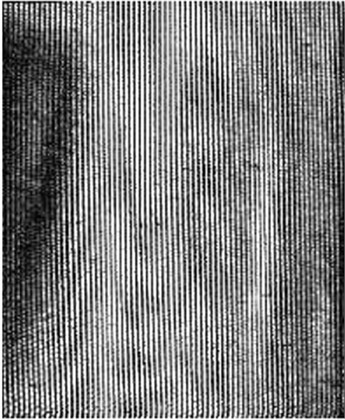
In the case of un-symmetric loading the polymeric film performs vibrations of more unstable character than under symmetric loading (see Fig. 3). The moiré clouds are more scattered in the images of eigenmodes, also there are more unstable ranges of frequencies. Thus, un-even motion due to un-symmetric tension of polymeric film in the printing machine and other defects can be assessed knowing that the shape of the eigenmodes and the amplitude and frequency of vibrations change due to the occurrence of defects.
Fig. 3The eigenmodes of the polymeric film PP under un-symmetric loading: a) first eigenmode: frequency of vibrations 61 Hz, amplitude 1.2∙10-5 m; b) second eigenmode: frequency of vibrations 80 Hz, amplitude 4.2∙10-5 m
a)
b)
4. Investigation of smoothness of fringes in time averaged moiré measurements of vibrations
4.1. Investigation of the time averaged measurement of vibrations for smooth fringes
This investigation is based on the use of the one dimensional model.
Intensity of the time averaged image is represented as:
where is the intensity of the time averaged image, is a number of images used for averaging, determines the width of moiré lines, is the coordinate of a point of a one dimensional structure in the status of equilibrium, is the displacement and it is assumed that:
where is a constant.
In the presented investigations parameters have the values: and .
when is graphically shown in Fig. 4. when is graphically shown in Fig. 5. when is graphically shown in Fig. 6.
From the presented results it is seen that 64 images are required for averaging in this problem.
The envelope function has the form:
where is the zero order Bessel function of the first kind.
Fig. 4I- when m=16
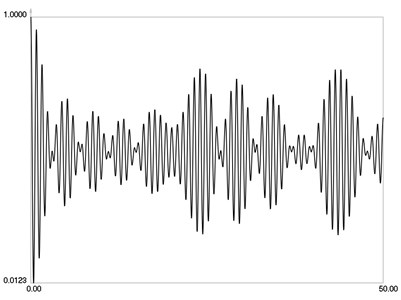
Fig. 5I- when m=32
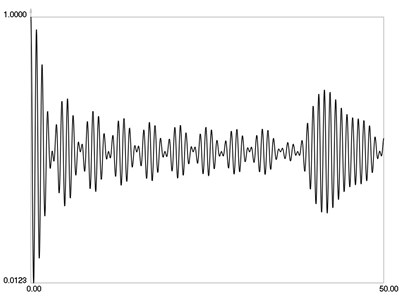
Fig. 6I- when m=64
4.2. Investigation of the time averaged measurement of vibrations for stepwise fringes
Intensity of the time averaged image is represented as:
where is the intensity of the time averaged image and:
when is graphically shown in Fig. 7. when is graphically shown in Fig. 8. when is graphically shown in Fig. 9. when is graphically shown in Fig. 10. when is graphically shown in Fig. 11. when is graphically shown in Fig. 12. when is graphically shown in Fig. 13.
From the presented results, it is seen that much higher number of images is required for averaging in this problem with stepwise variation of intensity than for the previous problem.
The envelope function has the form:
where is the rectangular zero order Bessel function of the first kind.
From the presented graphical relationships it is seen that qualities of the rectangular zero order Bessel function of the first kind are similar to the conventional zero order Bessel function of the first kind.
This one dimensional model of geometric moiré with linear variation with respect to longitudinal coordinate of amplitude of vibrations is useful for investigations of moiré techniques because it provides convenient graphical representations. But the obtained results can be generalized for two dimensional models, for more complicated variations of amplitude of vibrations and for projection moiré.
Fig. 7I-r when m=16
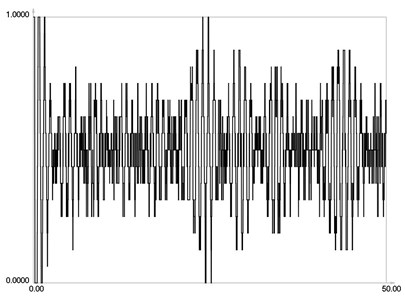
Fig. 8I-r when m=32
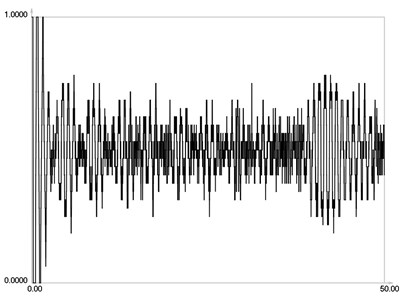
Fig. 9I-r when m=64
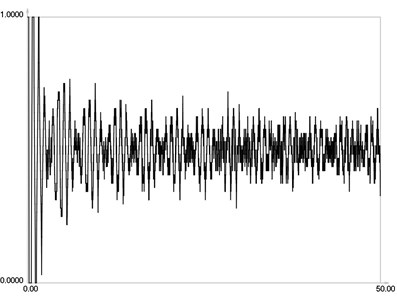
Fig. 10I-r when m=128
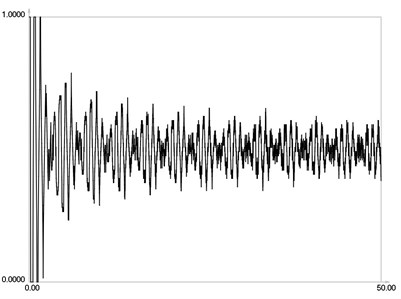
Fig. 11I-r when m=256
Fig. 12I-r when m=512

Fig. 13I-r when m=1024
5. Conclusions
Experimental investigations of thin polymeric films under symmetric and un-symmetric loading have been carried out for problems when the material is non-defected and is with defects. The shapes of eigenmodes and surface defects are established using the method of projection moiré. It was determined that depending on the type of defect in the polymeric film the frequency of vibrations decreases and the amplitude increases. The obtained findings can be used to develop a database that has the ability to compare the vibration modes of non-defected and defected polymeric films for qualitative manufacturing and printing of packaging.
Smoothness of fringes by using the method of time averaged geometric moiré is investigated. On the basis of a one dimensional model graphical relationships for linear variation with respect to longitudinal coordinate of amplitude of vibrations are obtained. They provide the background for the choice of the required number of images in a period of oscillations for different smoothnesses of moiré fringes.
From the presented results, it is seen that much higher number of images is required for averaging in the problem with stepwise variation of intensity than for the problem with smooth variation of intensity.
The envelope function is investigated for both problems. For the problem with stepwise variation of intensity the rectangular zero order Bessel function of the first kind is introduced. From the presented graphical relationships, it is seen that qualities of the rectangular zero order Bessel function of the first kind are similar to the conventional zero order Bessel function of the first kind.
Experimental investigations indicate that for grayscale gratings with smooth variation of intensity it is easier to obtain time averaged projection moiré images of acceptable quality, than for black and white (not grayscale) gratings. The same conclusion holds when there are high frequency disturbances (external noise) acting to the experimental setup. Thus, on the basis of experimental investigations grayscale gratings with smooth variation of intensity are recommended for projection moiré.
The obtained results are used for the analysis and measurement of vibrations of mechanical devices, especially when high precision is required.
References
-
Gamage P., Xie S. Q. A real-time vision system for defect inspection in cast extrusion manufacturing process. International Journal of Advanced Manufacturing Technology, Vol. 40, 2009, p. 144-156.
-
Prakash O. Defects in multilayer plastic films I: interface defects in extrusion. Computers and Material Science, Vol. 37, 2006, p. 7-11.
-
Prakash O., Moitra A. Defects in multilayer plastic films II: streak formation in extruded films. Computers and Material Science, Vol. 37, 2006, p. 12-14.
-
Barlow C. Y., Morgan D. C. Polymer film packaging for food: an environmental assessment. Resource Conservation and Recycling, Vol. 78, 2013, p. 74-80.
-
Tartakowski Z. Recycling of packaging multilayer films: new materials for technical products. Resource Conservation and Recycling, Vol. 55, 2010, p. 167-170.
-
Dong S., He B., Lin C., et al. Calibration method for a structured light measurement system with two different focal length cameras. Measurement, Vol. 73, 2015, p. 462-472.
-
Luo H., Xu H., Binh N. H., et al. A simple calibration procedure for structured light system. Optics and Lasers in Engineering, Vol. 57, 2014, p. 6-12.
-
Ragulskis M., Maskeliūnas R., Saunorienė L. Identification of in-plane vibrations using time average stochastic moire. Experimental Techniques, Vol. 29, 2005, p. 41-45.
-
Mironova T. V., Sultanov T. T., Zubov V. A. Digital photography in measurements of shifts of object surfaces with formation of the speckle structure in white light. Journal of Russian Laser Research, Vol. 25, 2004, p. 495-510.
-
Scharstein D., Szeliski R. High-accuracy stereo depth maps using structured light. IEEE Computer Society Conference on Computer Vision and Pattern Recognition (CVPR), Vol. 1, 2003, p. 195-202.
-
Han L., Voloshin A., Emri I. Study of the multilayer PCB CTEs by moiré interferometry. Optics and Lasers in Engineering, Vol. 42, 2004, p. 613-626.
-
Malamas E. N., Petrakis E. G. M., Zervakis M., et al. A survey on industrial vision systems, applications and tools. Image and Vision Computations, Vol. 21, 2003, p. 171-188.
-
Ragulskis M., Maskeliūnas R., Ragulskis L., Turla V. Investigation of dynamic displacements of lithographic press rubber roller by time average geometric moire. Optics and Lasers in Engineering, Vol. 43, 2005, p. 951-962.
-
Ragulskis K., Maskeliūnas R., Zubavičius L. Analysis of structural vibrations using time averaged shadow moire. Journal of Vibroengineering, Vol. 8, Issue 3, 2006, p. 26-29.
-
Saunorienė L., Ragulskis M. Time-Averaged Moire Fringes. Lambert Academic Publishing, 2010.
-
Huimin X., Guotao W., Fulong D., Guangjun Z., Xingfu L., Fangju Z., Aiming X. The dynamic deformation measurement of the high speed heated LY12 aluminium plate with moire interferometry. Journal of Materials Processing Technology, Vol. 83, Issues 1-3, 1998, p. 159-163.
-
Deason V. A., Epstein J. S., Abdallah A. Dynamic diffraction moire: theory and applications. Optics and Lasers in Engineering, Vol. 12, Issues 2-3, 1990, p. 173-187.
-
Kokaly M. T., Lee J., Kobayashi A. S. Moire interferometry for dynamic fracture study. Optics and Lasers in Engineering, Vol. 40, Issue 4, 2003, p. 231-247.
-
Timoshenko S. P., Goodier J. N. Theory of Elasticity. Nauka, Moscow, 1975, (in Russian).
-
Soifer V. A. Computer processing of images. Herald of the Russian Academy of Sciences, Vol. 71, Issue 2, 2001, p. 119-129, (in Russian).
-
Vest C. Holographic Interferometry. Mir, Moscow, 1982, (in Russian).
-
Han B., Post D., Ifju P. Moire interferometry for engineering mechanics: current practices and future developments. Journal of Strain Analysis for Engineering Design, Vol. 36, Issue 1, 2001, p. 101-117.
-
Field J. E., Walley S. M., Proud W. G., Goldrein H. T., Siviour C. R. Review of experimental techniques for high rate deformation and shock studies. International Journal of Impact Engineering, Vol. 30, Issue 7, 2004, p. 725-775.
-
Dai F. L., Wang Z. Y. Geometric micron moire. Optics and Lasers in Engineering, Vol. 31, Issue 3, 1999, p. 191-198.
-
Liang C. Y., Hung Y. Y., Durelli A. J., Hovanesian J. D. Time-averaged moire method for in-plane vibration analysis. Journal of Sound and Vibration, Vol. 62, Issue 2, 1979, p. 267-275.
About this article

This research was supported by Lehigh University (USA) and Kaunas University of Technology (Lithuania) Memorandum of Understanding to collaborate on a Project “Development of Novel Optical Methods for Defectoscopy of Polymer Films for Polygraphic and Packaging Manufacturing” (Partnership Agreement No. F4-90-87, 15 May 2013).
All authors declare that all of them have made contributions to the paper. So, contributions of all coauthors are acknowledged.
