Abstract
In order to conduct in-depth researches on rationality of air conditioning system equipment of a high-speed train as well as its pipeline system design, working conditions of the air conditioning system and distribution of aerodynamic characteristics including pressure, velocity and temperature in high speed trains should be computed carefully at the design stage. Therefore, the finite volume method was used to solve a governing equation of computational fluid dynamics. The aerodynamic characteristics of pipelines of the air conditioning system and the complete high speed train were computed, so the indoor distribution of wind velocity, temperature and gas concentration (carbon oxide, carbon dioxide, nitrogen and so forth) was obtained. The flow field index and the thermal comfort index were used to evaluate the indoor thermal comfort degree. In this way, whether rationality of the air conditioning system design and indoor aerodynamic characteristic could satisfy requirements for design specifications can be analyzed. Results show that: Under winter or summer working conditions, wind velocity was relatively high at the passageway door, where the maximum wind velocity was more than 1 m/s and would make passengers uncomfortable. Air flow velocity outside comfortable regions was more than 0.05 m/s, satisfying UIC553 standards. Velocity distribution was basically the same indoors, where wind velocity was large at positions perpendicular to the air supply hole, and the maximum wind velocity was more than 1 m/s, but wind velocity was uniform in the passenger region, which was basically lower than 0.2 m/s and satisfied UIC553 standards. In summer and winter working conditions, distribution of pressure, velocity and temperature was not uniform, where the maximum temperature gradient was near the air inlet in the compartment. Air components in the compartment satisfied requirements for comfort. The most uncomfortable regions in the compartment were concentrated at the passageway. Air supply holes distributed symmetrically on the train roof caused high air flow intensity, high wind velocity, low temperature and high humidity at the passageway in the compartment, so the thermal comfort was low, and it is feasible to adjust the layout of air supply holes appropriately.
1. Introduction
With the continuously increased train speeds, requirements for comfort in the compartment become increasingly higher. As for a passenger train running at a high speed, the compartment should have high sealing performance. The sealed environment in the compartment mainly depends on air conditioning systems. Problems in the compartment include uneven temperature distribution and cold air sensation, which will seriously influence the comfort [1-3]. Therefore, it is very important to control temperature distribution in order to create a comfortable riding environment and reduce energy consumption and cost. Aerodynamic characteristics including temperature and velocity fields in the compartment are important parameters for assessment. In order to avoid large amount modifications and subsequent waste of fees and resources caused by unreasonable temperature and wind velocity fields of trains, the flow field computation in the train should be conducted before train production.
Some scholars have made a lot of researches to analyze indoor aerodynamic characteristics of trains. References [4-6] mainly conducted a computational analysis on indoor flow fields. Berlitz [7] adopted the numerical simulation method to conduct a simulation analysis on distribution of indoor aerodynamic characteristics, and compared the results with experimental results in order to verify reliability of the results. Zhang [8, 9] analyzed impacts of no-load and loaded states as well as solar radiation on temperature fields in semi-cushioned seat trains with air-conditioning systems and used the PMV index to analyze thermal comfort in the compartment, but failed to consider an air duct structure in the simulation model. Chen [10] conducted a simulation computation of flow fields in semi-cushioned sleeper trains with air-conditioning systems and analyzed human body comfort, where the air duct structure was not considered either. Zhang [11] analyzed real train test data of high-cold trains. Results showed that superficial test point temperature of traction converter, transformer and current converter changed cyclically and had certain correlation with environmental temperatures. Meanwhile, the open operation condition of the high-cold train under 26 °C were studied, where temperature distribution of each equipment in the high-cold train equipment cabin as well as velocity distribution of flow fields outside the train and flow fields in the equipment cabin were obtained. Zhu [12] only conducted a simulation analysis on flow fields in a single compartment. Sun [13] tested air volume of each air supply hole as well as airflow organization of the compartment. It was found through comparison that, CFD simulation values of air volumes of each air supply hole and the compartment were consistent with the experimental test, satisfying engineering requirements. Two indexes including the non-uniform coefficient and air diffusion performance index (ADPI) were used to assess the results. Wang [14] established a computational model of internal flow fields of head trains without a non-waste air duct, and assessed temperature fields and velocity fields of the head train according to UIC553 standards. Liu [15] conducted a numerical computation of indoor aerodynamic characteristics of the train, considered the component of air and evaluated indoor thermal comfort using the aerodynamic characteristic index and the thermal comfort index. Fan [16] analyzed temperature fields and velocity fields in the train using a large eddy model, and compared the results with computational results of the standard - model in order to indicate applicability of the large eddy simulation method in the flow field computation. Muld [17] proposed measures for improving air quality according to influential factors of air quality in trains. According to importance of airflow organizations, the airflow organizations in trains were discussed; problems including physical models, selections of turbulent flow models and selection of boundary conditions were analyzed; related ideas were provided for numerical simulation of airflow organizations. The CFD technology was then applied to assess indoor air quality in order to provide a basis for improving indoor air quality. Cao [18] proposed two optimization models to optimize airflow short circuit problems of trains and conducted a simulation analysis using the numerical simulation method. Powell [19] pointed out that interactions between a train and air were very violent during running of the high-speed train. During development and research of the train, with the increased train speed, a three-dimensional computation model of trains in the open air running was established, and a computational model of flow fields in the equipment cabin under the head train was established. Numerical researches were conducted on temperature distribution in the equipment cabin of the train under environmental temperatures of –40 °C-40 °C, obtaining changing rules of surface temperatures of heat equipment with the environmental temperatures, and providing a basis for rational layout of equipment under the train. Baker [20] analyzed change of indoor air pressures and CO2 concentration with the train meeting pressure wave changes outside the train.
Based on the computational fluid dynamics method, the paper conducted a numerical analysis on a train air conditioning system and fluid characteristics with considering thermal-flow coupling effects, obtaining aerodynamic characteristics including wind velocity, temperature and gas concentration (carbon oxide, carbon dioxide and nitrogen). In addition, the paper also evaluated thermal comfort degree in the compartment using the flow field index and thermal comfort index in order to analyze rationality of the air conditioning system design and provide a simulation basis for optimization analysis on flow fields in high-speed trains.
2. Computational mathematic model for flow fields in high-speed trains
Flow fields in the high-speed train are three-dimensional, incompressible, viscous and unsteady turbulent flow fields. The controllable differential equation [21-25] in the form of Reynolds-Averaged Navier-Stokes equations (RANS), namely the standard - model is as follows:
Continuity equation is:
Momentum conservation equation is:
Energy conservation equation is:
Turbulence dynamic energy equation is:
Equation of turbulence dynamic energy dissipation rate is:
, , are components of flow velocity in , and coordinate directions. is volume density of fluids, assigned with a constant in case of incompressibility. is dynamic viscosity density of fluids. is turbulent flow viscosity. is turbulent flow dynamic energy. is dissipation rate of turbulent dynamic energy. is fluid temperature. is air thermal conductivity. is specific heat at constant pressure of air mass. , , , , are constants, empirical values are 1.44, 1.92, 0.09, 1.0 and 1.3. , , are source items of momentum equations in , and directions:
The RNG - model [26, 27] (Renormalization Group, RNG) indicates small-scale effects in large-scale motion and the modified viscosity item, so these small-scale motions could be systematically removed from the governing equation. Through modifying turbulent flow viscosity, rotation in average flowing is taken into account, and time-average strain rates of main flows could be reflected. Obviously, the RNG - model could effectively treat flow with the high strain rate and large streamline bending degree. In addition, in the flow field computation of a high-speed train, it is more stable and could get converged more easily compared with a standard - model. Therefore, it is widely applied in engineering practice. For these reasons, the RNG - turbulent flow model is selected in the flow field computation of high-speed trains.
3. Computational model of high-speed train compartments
3.1. Geometric model of compartments
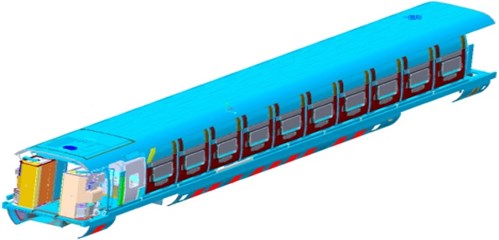
The air conditioning system adopted in the high-speed train includes a ventilator, an air conditioning and complicated pipelines. The ventilator sucks new air from a new air supply hole by virtue of a fan. The new air is mixed with circulation air collected by the air return hole, and is then delivered to the air conditioning system. After temperature is adjusted, the air is delivered to each position of the compartment through the air supply pipeline and the air supply hole. A part of the air in the compartment is taken as the circulation air, so energy sources could be saved. The other part of air is discharged from the train through a waste discharge hole. Air supply modes are different in summer and winter working conditions. Fig. 1 shows a real model of the high-speed train compartment.
Fig. 1Real model of the high-speed train compartment
3.2. Basic conditions and hypotheses
Due to complexity of the real model, it is necessary to conduct necessary simplification on the compartment model and the air conditioning pipeline system model. During simplification, the following factors are taken into account:
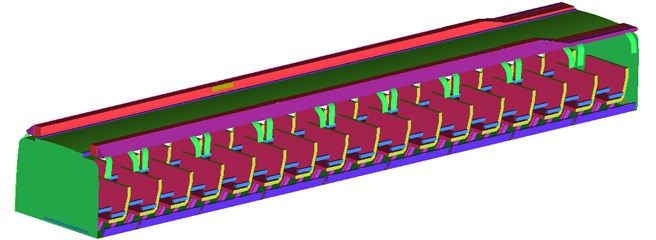
(1) During building the compartment geometric model, it was assumed that the compartment was full-loaded, and there were 85 passengers in the second compartment. Structures on two ends of the compartment were simplified. Regions including toilet and power distribution cabinets were not considered. According to design drawings of the high-speed train compartment, the compartment geometric model was established, as shown in Fig. 2. Geometric model of seats in the second compartment (85 passengers) is shown in Fig. 3.
Fig. 2Geometric model of the high-speed train compartment
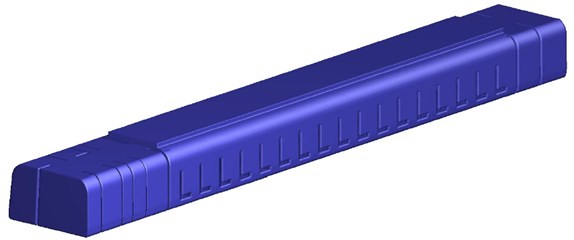
Fig. 3Computational geometric model of compartment seats
(2) It was assumed that the air was composed of CO2, H2O, O2 and N2. Other micro-gases and impurities were not taken into account.
(3) Complicated structures in the fan and air conditioning of the high-speed train were not taken into account. They were replaced by boundary faces with the same functions.
(4) The air conditioning system was composed of a ventilator, two air conditioning units and pipelines. The ventilator led in fresh air and discharged exhaust gas. The air conditioning units mixed the new air with the returned air and then delivered the mixed air to the compartment after temperature is adjusted.
(5) It was assumed that the air supply system and compartment had a good sealing performance. Gas leakage did not exist except for the air supply hole and the air discharge hole.
3.3. Air supply modes of air conditioning pipeline systems
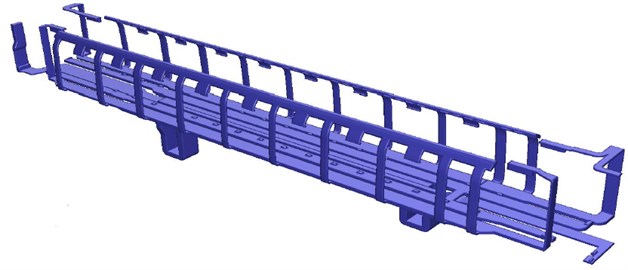
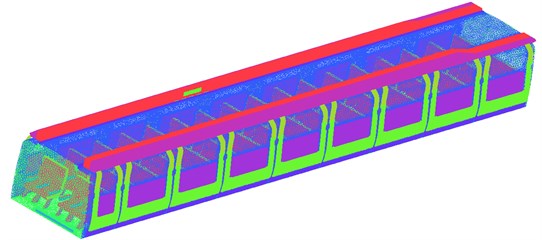
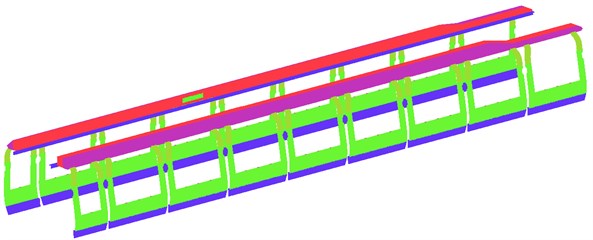
The computational model of the air conditioning pipeline system took a high-speed train as the case. A complete geometric model of the air conditioning pipeline system and internal compartment space was established. The air conditioning system was composed of a new air duct, an air supply duct, an air return duct, a waste exhaust duct, a ventilator and two air conditioning units. Toilets and power distribution cabinets as well as other devices were arranged on two ends of the compartment. Symmetrically arranged air supply holes were formed in two sides of the top part. Adjustable air supply holes were disposed on the train window upper edge. The air return holes were located under the seats. Geometric model of the compartment and air ducts is shown in Fig. 4.
Fig. 4Air conditioning pipeline systems of high-speed trains
3.4. Mesh division
ICEM CFD was used for mesh division. The meshes were non-structural meshes. Sizes of meshes in the model were distributed widely. There were a lot of holes. Therefore, in order to increase mesh quality, faces in the model were divided into large faces and small faces, where different mesh sizes were set respectively. In the complete flow space, the maximum size of solid meshes was 300 mm; maximum size of holes was 8 mm; maximum size of the seat main body was 30 mm; maximum size of the air supply duct was 20 mm; maximum size of the train body was 80 mm; size of detailed structures of the train body was 10 mm; maximum size of the corridor was 30 mm; maximum size of inlet and outlet was 4 mm. Mesh distribution of each part is shown in Fig. 5. Total amount of meshes of the high-speed train was about 67 million.
Fig. 5Surface meshes of high-speed train compartments and pipeline systems
a) Surface meshes of high-speed train compartments
b) Surface meshes of air conditioning pipeline systems
3.5. Boundary conditions
(1) Boundary conditions of inlet and outlet.
Boundary conditions of inlet and outlet depend on external environments of the train. Environmental parameters were different in summer and winter working conditions. In summer working condition, the temperature was 35 °C and the relative humidity was 60 %. In winter working condition, the temperature was –20 °C, and the relative humidity was 45 %. According to computational results, the mass fraction of H2O in air was 2.2 % in summer working condition, and the value was 0.05 % in winter working condition. Mass fractions of other gas constituents were the same as external air: mass fraction of CO2 is 0.05 %, mass fraction of O2 is 23.1 %, and N2 occupies the rest part.
(2) Boundary conditions of air conditioning pipeline systems.
When the train ran at the speed of 350 km/h, the velocity inlet was set as the inlet boundary condition; pressure outlet was set as the outlet boundary condition. Combination of top air supply and lateral wall air supply was taken as the air inlet mode in trains. The total air supply rate was 4400 m3/h. Flow distribution was conducted by two air supply ducts. Inlet flow rate proportions were different in winter and summer working conditions. Summer working condition: top flow rate occupied 75 % and bottom flow rate occupied 25 %, namely 3300 m3/h and 1100 m3/h; winter working condition: top flow rate occupied 25 % and bottom flow rate occupied 75 %, namely 1100 m3/h and 3300 m3/h.
(3) Boundary conditions of human body.
Flow fields in the train would be affected by heat dissipation and respiration of human bodies. Heat dissipation on surfaces of passenger bodies formed the major heat source in trains. Respiration of human bodies would also change contents of gas constituents in the train. In summer working condition, the human body thermal flow rate was 99.17 w/m2; in winter working condition, 77.34 w/m2. In computation, the effective heat conduction area was set to be 0.736 m2.
(4) Wall face thermal boundaries in train body.
The heat convection wall face condition was set for the train body. Heat conduction coefficient of the train body wall faces was 2.0 w/(m2·k). Heat conduction coefficient of train windows was 1.8 w/(m2·k) [20, 28-31].
4. Results and discussions of aerodynamic characteristics in summer working condition
4.1. Pressure distribution in the seat compartment
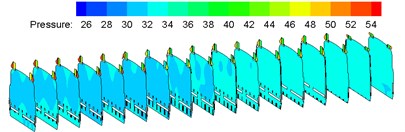
According to mentioned computation models and boundary conditions, flow field pressure distribution of the high-speed train compartment was computed, as shown in Fig. 6. As shown in Fig. 6, pressure contours of each cross section indicate that airflow pressures were distributed unevenly in the compartment; pressures on the end inside the compartment, which was closer to the air supply duct inlet, were lower compared with the remote end of the compartment, and uneven pressure distribution appeared in a large scale; maximum pressure appeared at the inlet of air supply duct; minimum pressure appeared at the waste discharge hole. The major reason was that air supply amounts of each air supply hole were quite different due to different air supply amounts of each air supply pipe.
4.2. Velocity distribution in the seat compartment
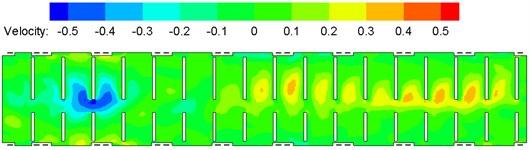
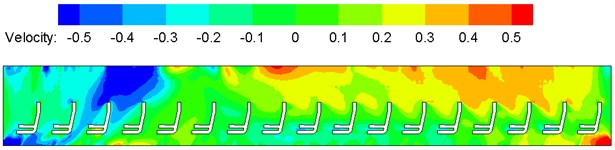
Contours of surface velocity of the compartment were extracted, as shown in Fig. 7. Fig. 8 shows velocity vector of each cross section. It is shown in Fig. 7 that the airflow flow rate was larger at the air supply pipe farther from the air inlet; velocity was low near the corridor end part, and corresponding pressures were large as air trapping appeared in this region and airflow diffusion was retarded; velocity at the corridor was larger than that on the seat, and the maximum velocity appeared on the roof near the air outlet, which satisfied design requirements for air conditioning pipeline systems of the train. It is shown in Fig. 7(d) that airflows could be conveyed effectively by each air conditioning pipelines. As shown in Fig. 8, the velocity vector contour of each cross section indicate that velocity was large at the corridor and at air supply holes of the train roof, and airflows flowed back at the top air supply holes, so airflow flow rates were uneven in the air conditioning system. Major reasons included: cross section regions of air supply pipelines near the train roof air inlet were smaller than other air ducts; air supply ducts and air supply holes were distributed uniformly along the train length direction, and had the same size.
Regarding airflow velocity distribution of flow fields, the flow rates of vertical air supply piles were adjusted to be basically uniform, but airflow velocity distribution of flow fields in the compartment was still not uniform enough, and pressure distribution was very uneven. This might be caused by irrational design of position or size of air supply holes of the compartment.
Fig. 6Contours of pressure distribution on each cross section in the compartment
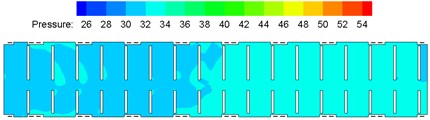
a) Vertical cross section (0.8 m high above the floor)
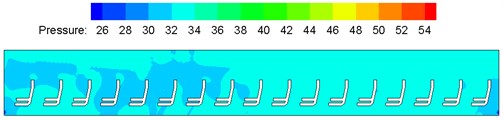
b) Longitudinal center cross section
c) Horizontal cross section
Fig. 7Contours of velocity distribution on each cross section in the compartment
a) Vertical cross section (0.8 m high above the floor)
b) Longitudinal center cross section
c) Horizontal cross section
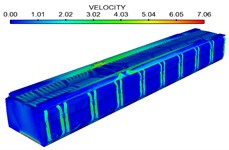
d) Compartment
Fig. 8Vector contours of velocity on each cross section in the compartment
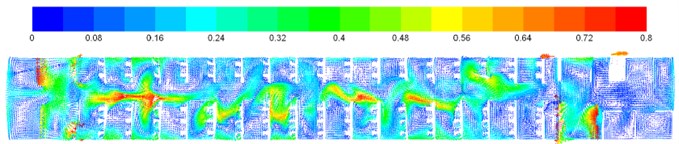
a) Vector contours of vertical planar velocity (2.1 m high above floors)
b) Vector contours of longitudinal center planar velocity
c) Vector contours of longitudinal planar velocity (1.2 m away from center cross section)
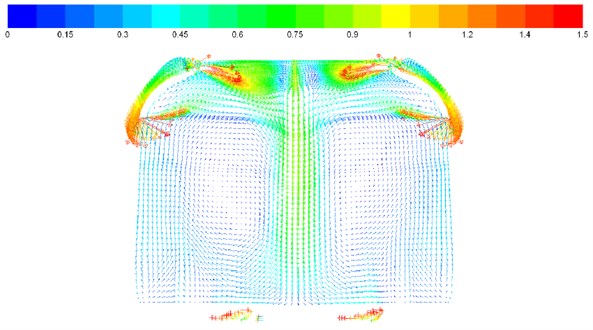
d) Vector contours of horizontal planar velocity (6.5 m away from toilet)
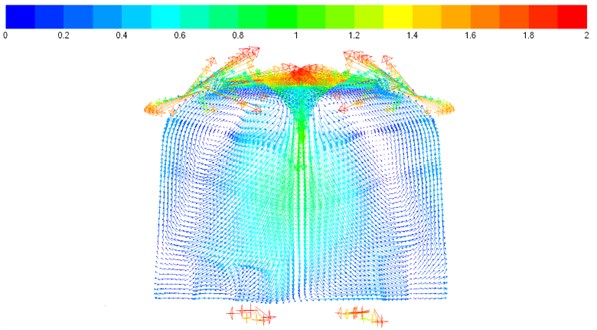
e) Vector contours of horizontal planar velocity (12.5 m away from toilet)
4.3. Temperature distribution in the seat compartment
Severe external environmental temperature in summer working condition was selected: environmental temperature was 35 °C, and humidity was 60 %. Indoor temperature field distribution of the train in summer working condition was computed, as shown in Fig. 9. It is shown in the flow field temperature distribution that temperature distribution was good in summer working condition; minimum temperatures were at the corridor and two ends of the compartment due to lack of heat sources and high wind velocity; temperature above the seats were relatively higher due to effects of the buoyancy lift forces. The temperature gradient was the maximum near the air duct inlet of the compartment due to the small air duct cross section at the air outlet and large distribution spacing, which was caused by irrational design of positions or sizes of air supply holes of the compartment.
Fig. 9Contours of indoor temperature distribution on each cross section
a) Vertical cross section (0.8 m high above floor)
b) Longitudinal center cross section
c) Horizontal cross section
4.4. Temperature distribution in the sleeper compartment
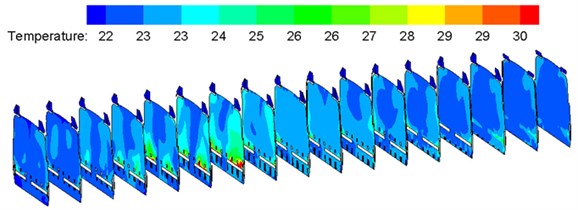
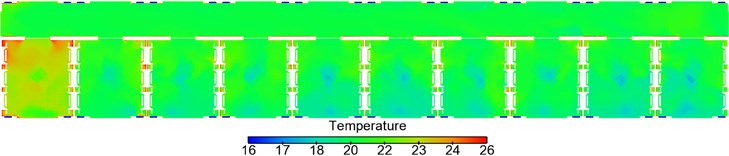
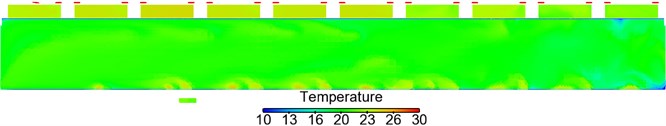
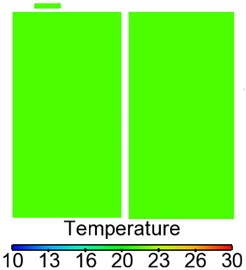
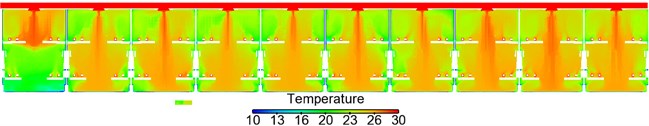
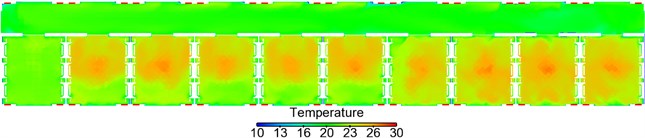
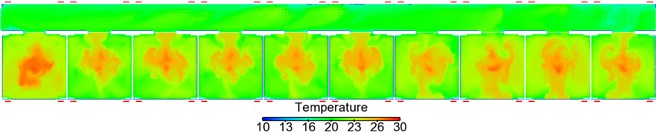
Fig. 10 shows temperature distribution on longitudinal cross section and horizontal cross section of the high-speed train under summer working conditions. It is shown in Fig. 10: temperature distribution was uniform in the large corridor, and the temperatures basically ranged within 20 °C-22 °C; temperature distribution was uniform in the three toilets, and temperatures basically ranged around 22 °C; temperature distribution was uniform in No. 1-9 compartments, the temperatures ranged basically within 20 °C-22 °C, but temperatures in regions perpendicular to the air supply holes were about 1 °C lower than temperatures of other regions; temperatures in No. 10 compartment were higher than those in other 9 compartments, and the temperatures approached 22 °C-24 °C; temperature distribution was uniform in the washing compartment, and temperature approached 22 °C. The maximum temperature difference at the position 1.1 m higher than the horizontal cross section exceeded 3 °C.
Fig. 10Contours of temperature distribution in the sleeper compartment
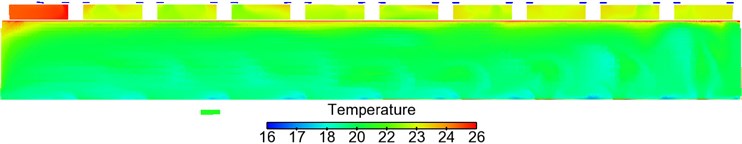
a) Temperature distribution of the large corridor
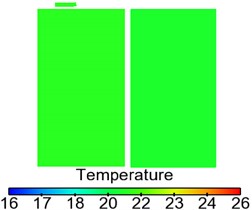
b) Temperature distribution of toilets
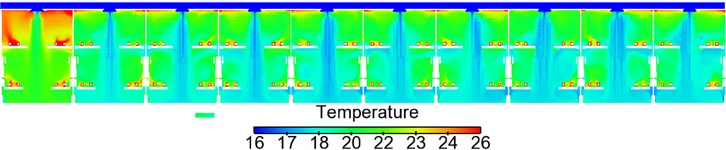
c) Temperature distribution of 10 compartments
d) Temperature distribution at position 1.2 m higher above floors
e) Temperature distribution at position 1.75 m higher above floors
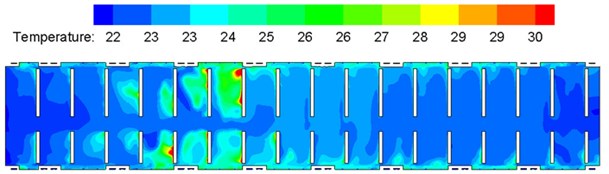
Fig. 11Contours of temperature distribution on horizontal cross section in the sleeper compartment
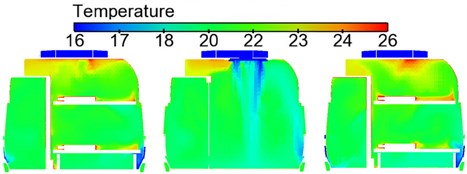
Fig. 11 shows temperature distribution on the horizontal cross section of compartments. It is shown in Fig. 11 that temperature distribution was basically the same in each compartment.
Temperatures were relatively low at middle parts (perpendicular to air supply holes) of the compartments. Temperature distribution was uniform in passenger regions. Temperature distribution was uniform at the first end porch part, where temperatures approached 22 °C-23 °C; temperature was uniform at the second end porch part, where temperatures approached 22 °C.
5. Results and discussions of aerodynamic characteristics in winter working condition
5.1. Pressure distribution in the seat compartment
According to mentioned computation models and boundary conditions, pressure (unit: Pa) distribution of flow fields in the air conditioning system and compartment was computed. Computational results of flow field pressure distribution of the high-speed train under the winter working condition are shown in Fig. 12. As shown in Fig. 12, pressure contours of each cross section indicate that indoor airflow pressure distribution was uneven; pressures at the end inside the compartment, which was closer to the air duct inlet, were smaller than the compartment far end, and uneven pressure distribution appeared in a large scale; the pressure near the air supply duct inlet was the maximum, and the pressure at the waste discharge hole was the minimum. The major reason was that air supply amounts of each air supply hole were very different due to different air supply amounts of each air supply pipe. Compared with indoor pressure distribution in summer working condition, pressure distribution was similar at middle and rear parts indoors, but pressures at the front part were affected by temperatures to different extents.
Fig. 12Contours of pressure distribution on each cross section in the compartment
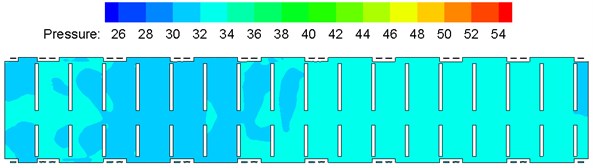
a) Vertical cross section (0.8 m high above floors)
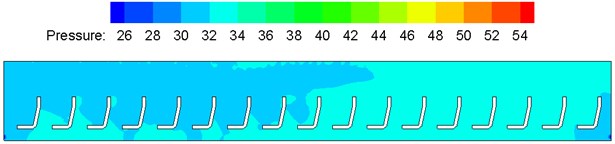
b) Longitudinal cross section
5.2. Temperature distribution in the seat compartment
Severe external environmental temperature in winter working condition was selected: environmental temperature of –20 °C and humidity of 45 %. Indoor temperature field distribution of the train in winter working condition was computed, as shown in Fig. 13. It is shown in the contour of flow field temperature distribution that temperature distribution was good in the compartment; temperature difference was not large on each cross section; most temperatures were controlled within 21 °C-25 °C; The maximum temperature difference of the passenger head and passenger feet did not exceed 1 °C; the minimum temperature appeared at the corridor on end part of the compartment. Therefore, it is thus clear that temperature distribution was good in winter working condition. Nevertheless, the most uncomfortable regions in the compartment were concentrated at the end corridor; air supply holes distributed symmetrically on the train roof caused high air flow intensity, high wind velocity, low temperature and high humidity at the compartment end corridor, so the thermal comfort was low, and it is feasible to adjust the layout of air supply holes appropriately.
Fig. 13Contours of temperature distribution on each cross section in the compartment
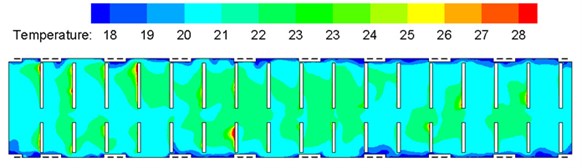
a) Vertical cross section (0.8 m high above floors)
b) Longitudinal center cross section
c) Horizontal cross section
5.3. Temperature distribution in the sleeper compartment
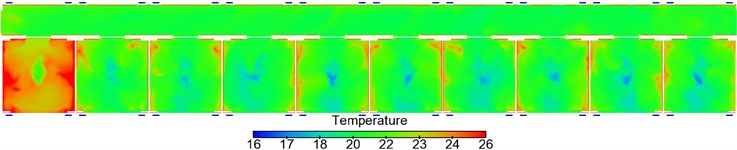
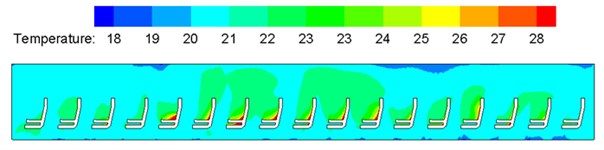
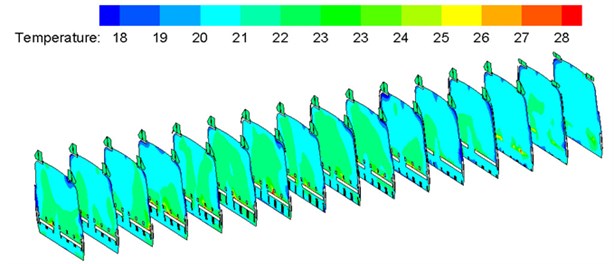
Fig. 14 shows temperature distribution on longitudinal cross section and horizontal cross section of the train body. It is shown in Fig. 14: temperature distribution was uniform in the large corridor, and the temperatures basically ranged within 21 °C; temperature distribution was uniform in the three toilets, and temperatures basically ranged around 21 °C; temperature distribution was uniform in No. 1-9 compartments, the temperatures ranged basically within 23 °C-26 °C, but temperatures in regions perpendicular to the air supply holes were about 1 °C higher than temperatures of other regions; temperatures in No. 10 compartment were lower than those in other 9 compartments, where the temperatures approached 20 °C-24 °C and temperatures of upper sleepers were higher than those of lower sleepers; temperature distribution was uniform in the washing compartment, and temperature approached 21 °C. The maximum temperature difference at the position 1.2 m higher than the horizontal cross section exceeded 3 °C.
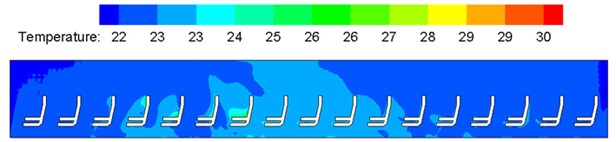
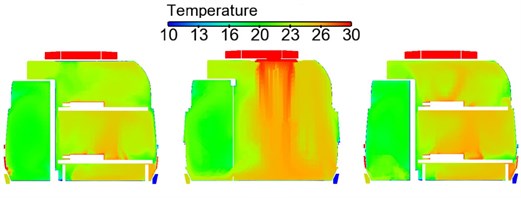
Fig. 15 shows temperature distribution on the cross section of No. 3 compartment (due to the limited length, temperature distribution of other compartments is not listed). It is shown in Fig. 15 that temperature distribution was basically the same in each compartment. Temperatures at the middle part of compartment (perpendicular to air supply holes) were relatively high, and temperature distribution in passenger regions was uniform; temperature distribution was uneven at the first end porch part, and temperatures were low near the floor; temperature distribution at the second end porch was uniform, where temperatures approached 21 °C.
Fig. 14Contours of temperature distribution in the sleeper compartment
a) Temperature distribution of the large corridor
b) Temperature distribution of toilets
c) Temperature distribution of compartments
d) Temperature distribution at position 1.2 m higher above floors
e) Temperature distribution at position 1.75 m higher above floors
Fig. 15Contours of temperature distribution on horizontal cross sections in the sleeper compartment
5.4. Analysis on gas concentrations in the seat compartment
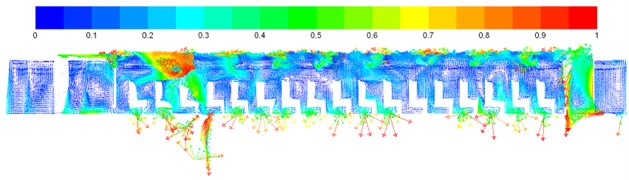
One part of air in the compartment was generated from respiration of human bodies, and the other part was the fresh air brought into the train by the flow guide heat-exchange of the air conditioning system. According to mentioned computation models and boundary conditions, air components of flow fields in the air conditioning system and compartment were computed. Gas concentration in the conditioning was obtained, as shown in Fig. 16. Through analyzing gas components in the train, as shown in Fig. 16, air supply holes on the train roof were distributed symmetrically on two sides of the compartment top part; airflows with the opposite directions output by air supply holes on two sides converged at the middle part and were then delivered downwards to the passenger region. Therefore, air flow velocity was large and temperature was low at the middle corridor part, so that people might feel cold at the corridor part. However, the corridor part did not belong to long-term staying regions of passengers in general. Due to human respiration, CO2 concentration was the maximum on passengers’ faces (Fig. 16(a)) and gradually diffused around. The concentration was the minimum at the corridor part. Due to gas buoyancy lift forces above the passengers, the CO2 concentration was large. According to computational results, the average value of CO2 volume concentrations in the compartment was 0.04 %, far lower than 0.15 % [15]. Therefore, it is thus clear that gas components in the train could satisfy demands for comfort in the train.
Fig. 16Contours of gas concentration distribution in the compartment
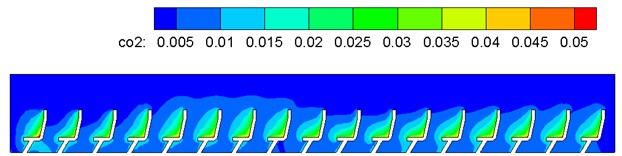
a) CO2 concentration distribution
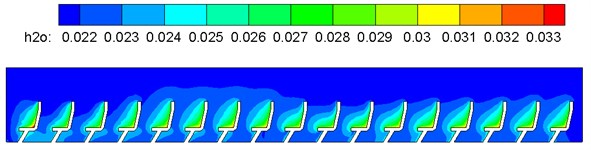
b) H2O concentration distribution
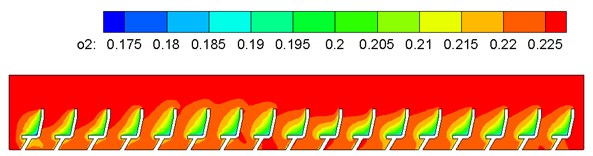
c) O2 concentration distribution
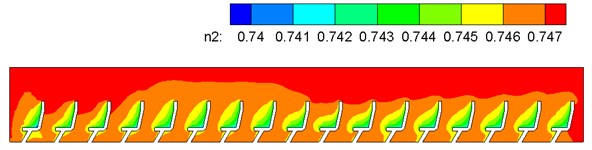
d) N2 concentration distribution
5.5. Velocity distribution in the sleeper compartment
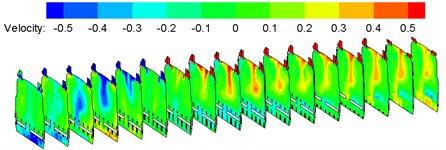
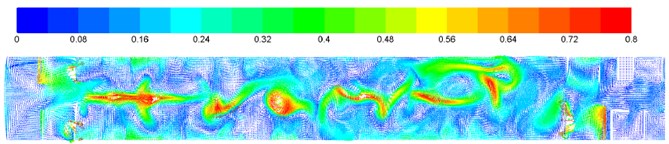
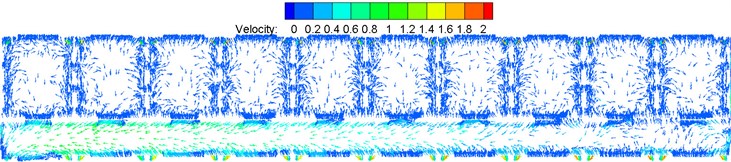
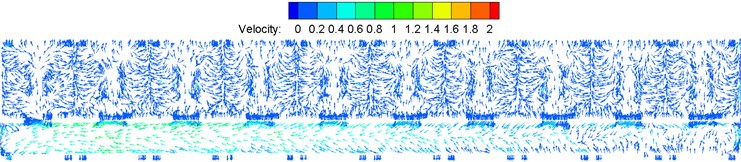
Fig. 17 shows velocity distribution on the longitudinal cross section and horizontal cross section of the train body, respectively. It is shown in Fig. 17: wind velocity was large at the second end porch part of the large corridor, wherein the maximum wind velocity exceeded 1 m/s; wind velocity was uniform in the three toilets, wherein the velocity was basically lower than 0.2 m/s; wind velocity was uneven in the compartments, wherein wind velocity at positions in No. 1-9 compartments perpendicular to the air supply holes was large, the maximum wind velocity exceeded 1 m/s, but wind velocity was uniform in passenger regions and was basically lower than 0.2 m/s; wind velocity in No. 10 compartment perpendicular to the air supply holes was smaller than those of other compartments; velocity field distribution was uneven in the washing compartment, wherein the maximum wind velocity exceeded 1 m/s and might make passengers uncomfortable.
Fig. 17Contours of velocity distribution in the sleeper compartment
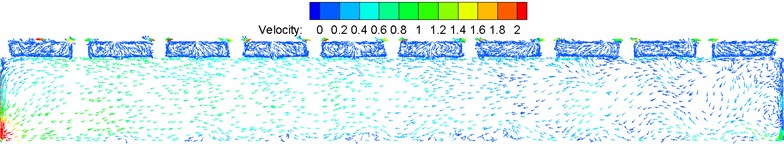
a) Large corridor
b) Toilets
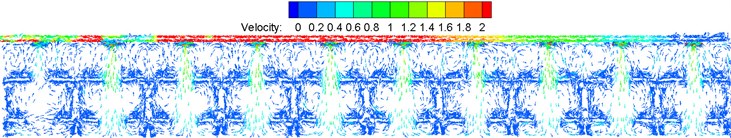
c) Compartments
d) Velocity distribution at position 1.2 m higher above floors
e) Velocity distribution at position 1.75 m higher above floors
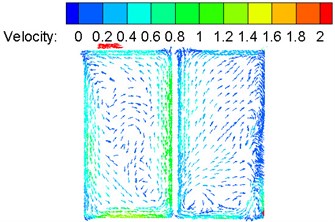
Fig. 18 shows velocity distribution on cross sections of each compartment. It is shown in Fig. 17 that velocity distribution was basically the same in each compartment, but wind velocity was large at middle parts (perpendicular to air supply holes) in each compartment; wind velocity was basically uniform at first end porch parts, but wind velocity was large at positions perpendicular to the air supply holes; wind velocity was large at the second end porch parts as air return holes were at the second end top part and thus airflow flow rate was large there.
Fig. 18Contours of velocity distribution on horizontal cross section in the sleeper compartment
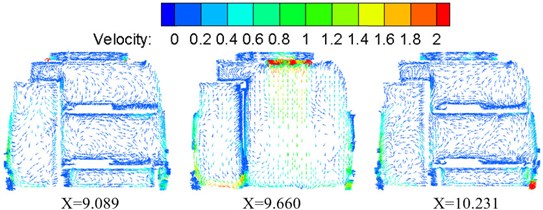
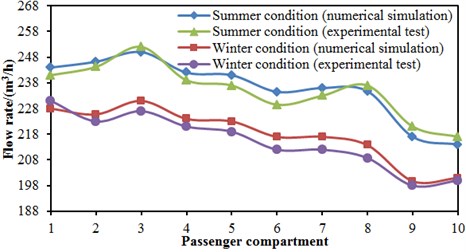
Fig. 19 shows the comparison working condition of air supply amounts of roof air supply holes in each compartment using numerical simulation. It is shown in the figure that under summer and winter working conditions, the No. 3 compartment had the largest air supply amount, and No. 10 compartment had the minimum air supply amount; meanwhile, it could be found that the air supply amount of roof air supply holes was larger during summer working condition of the high-speed train compared with the winter working condition, the maximum difference of each compartment was 20 m3/h, the minimum difference was 13 m3/h, and the average difference was 17.7 m3/h; when the high-speed train ran under summer working conditions, the maximum air supply amount was 252 m3/h; when the high-speed train ran under winter working conditions, the maximum air supply amount was 233 m3/h. It was further found that air supply amounts of No. 9 compartment and No. 10 compartment were smaller than other compartments, and they were hot in summer and cold in winter. Therefore, it is feasible to conduct the structural design for air supply holes in No. 9 compartment and No. 10 compartment, so more uniform air supply could be achieved generally, and different compartments could have the consistent air supply amount. Therefore, it is feasible to modify the cross section region of train roof air supply holes, and take into account the air supply holes positions as well as distribution modes and spacing of the air supply holes in order to make flow fields uniform and reduce temperature gradients near the air supply ducts, etc. In order to validate the correctness of the computational model, the experimental test on air supply amounts of roof air supply holes in each compartment has been also conducted. The experimental results were extracted and compared with those of numerical simulation, as shown in Fig. 20. As can be seen from this figure, the changing trend of the numerical simulation was consistent with that of experimental test well. Regarding two analyzed working conditions, the maximum relative error between numerical simulation and experimental test was only 1.8 %. Therefore, the computational model in this paper is reliable, and the corresponding method is also right.
Fig. 19Air supply amount of each compartment
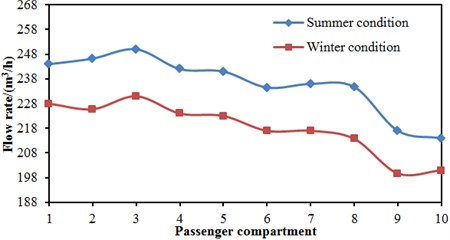
Fig. 20Comparisons between experimental test and numerical simulation
6. Conclusions
Through numerical analysis on the second compartment and air conditioning pipeline system of the high-speed train, the following conclusions are obtained:
1) Temperature distribution was better in summer working condition, while it was good in winter working condition. Distribution of pressure, velocity and temperature was uneven. The maximum temperature gradient appeared near the air inlet of the compartment. Gas components in the train satisfied requirements for comfort in the train.
2) It is feasible to modify the cross section region of train roof air supply holes, and take into account the air supply holes positions as well as distribution modes and spacing of the air supply holes in order to make flow fields uniform and reduce temperature gradients near the air supply ducts, etc.
3) Distribution mode and size of air supply holes seriously affect airflow organization and comfort in the compartment. Rational air supply and air return modes still play an important role in ensuring uniform distribution of flow field parameters and thermal comfort.
4) The most uncomfortable regions in the compartment were concentrated at the end corridor; air supply holes distributed symmetrically on the train roof caused high air flow intensity, high wind velocity, low temperature and high humidity at the end corridor, so the thermal comfort was low, and it is feasible to adjust the layout of air supply holes appropriately.
5) In winter and summer working conditions, wind velocity was large at the second end of the large corridor and the maximum wind velocity was more than 1 m/s, which might make passengers uncomfortable; air flow rate was more than 0.05 m/s at the position outside the comfortable region, satisfying UIC553 standards. Velocity distribution was basically the same in each compartment, wherein wind velocity was large at positions perpendicular to the air supply holes in the compartments; the maximum wind velocity was more than 1 m/s; however, wind velocity in the passenger region was uniform and basically lower than 0.2 m/s, satisfying UIC553 standards. Temperature distribution was uniform in the large corridor, wherein temperatures basically ranged within 20 °C-22 °C in summer working condition and temperatures of seats basically approached 21 °C in winter working condition, satisfying the UIC553 standard that the temperature of the large corridor should not be 5 °C higher than the compartment during cooling, and the temperature should not be 6 °C lower than that of the passenger region during heating.
6) As for high-speed trains, impacts of new air holes with negative pressures caused by train speeds on the train interior could not be neglected. Therefore, it is necessary to establish a complete model of the air conditioning system and compartment interior structure. Because of the complete model, estimation errors of parameters including temperature, wind velocity and CO2 concentration at the air supply holes could be avoided during separated computation of flow fields in the compartment. In case of external environment changes, such as train speed changes, train meeting or access to tunnels, impacts of the special situations on flow fields and thermal comfort in the train could be simulated, as well.
References
-
Cong X. C., Zhang X., Zhang M. Numerical calculation and measurement of the airflow distribution in air-conditioned coach. China Railway Science, Vol. 24, Issue 5, 2003, p. 101-105.
-
Wu J. S. Green wireless communications: from concept to reality. IEEE Wireless Communications, Vol. 19, Issue 4, 2012, p. 4-5.
-
Han H. Y., Jiang J., Cao J. F., Liu Q. Effect of cabin air supply mode on air velocity distribution. Space Medicine and Medical Engineering, Vol. 10, 2009, p. 362-367.
-
Conceicao E. Z. E., Da Silva M. C. G., Andre J. C. S., et al. Thermal behaviour simulation of the passenger compartment of vehicles. International Journal of Vehicle Design, Vol. 24, Issue 4, 2000, p. 372-387.
-
Yang K., Martin S., Xing C. W., et al. Energy-efficient power control for device-to-device communications. IEEE Journal on Selected Areas in Communications, Vol. 34, Issue 12, 2016, p. 3208-3220.
-
Mezrhab A., Bouzidi M. Computation of thermal comfort inside a passenger car compartment. Applied Thermal Engineering, Vol. 26, Issue 14, 2006, p. 1697-1704.
-
Berlitz T., Matschke G. Interior air flow simulation in railway rolling stock. Proceedings of the Institution of Mechanical Engineers, Part F: Journal of Rail and Rapid Transit, Vol. 216, Issue 4, 2002, p. 231-236.
-
Zhang D. C., Weng P. F. Numerical simulation of airflow and temperature fields in railway occupied passenger car. Chinese Journal of Computational Mechanics, Vol. 24, Issue 6, 2007, p. 904-910.
-
Zhang D. C., Weng P. F., Zou S. H. Research of thermal comfort in railway passenger cars. Journal of the China Railway Society, Vol. 28, Issue 5, 2006, p. 35-40.
-
Chen H. X., Zhang D. C. Study of thermal comfort in air-conditioned hard sleeper cars. Journal of the China Railway Society, Vol. 26, Issue 3, 2004, p. 46-50.
-
Li L., Zhang L., Zhang Z. Y., Mou M. F., Wang D. P. Aerodynamics numerical simulation of heat dissipation for high-cold ENU equipment compartment. Journal of Dalian Jiaotong University, Vol. 35, Issue 3, 2014, p. 14-17.
-
Zhu C., Zhang X., Hu S. T. Study on air supply modes in sleeper-berth compartments of railway cars. Journal of the China Railway Society, Vol. 30, Issue 4, 2008, p. 98-102.
-
Sun H., Luo X., Wang J. Feasibility study of a hybrid wind turbine system–Integration with compressed air energy storage. Applied Energy, Vol. 137, 2015, p. 617-628.
-
Wang D. P., Liu Y. D., Huang S. D., Xi W. Numerical simulation on interior flow field of cab and passenger compartment of 250 km/h EMU first carriage. Journal of Dalian Jiaotong University, Vol. 34, Issue 6, 2013, p. 1-5.
-
Liu J., Li R. X., Chen L., Li S. D. Analysis of air flow field in air conditioning system and compartments of high-speed trains. Journal of Southwest Jiaotong University, Vol. 47, Issue 1, 2012, p. 127-132.
-
Fan R., Su Z., Meng G., et al. Application of sound intensity and partial coherence to identify interior noise sources on the high speed train. Mechanical Systems and Signal Processing, Vol. 46, Issue 2, 2014, p. 481-493.
-
Muld T. W., Efraimsson G., Henningson D. S. Flow structures around a high-speed train extracted using proper orthogonal decomposition and dynamic mode decomposition. Computers and Fluids, Vol. 57, 2012, p. 87-97.
-
Cao X. L., Li J., Zeng W., Sun H., Yang Y. Numerical simulation and optimization for the air conditioning and ventilation system in the compartment of urban rail train. China Railway Science, Vol. 34, Issue 6, 2013, p. 105-109.
-
Powell J. P., González Gil A., Palacin R. Experimental assessment of the energy consumption of urban rail vehicles during stabling hours: influence of ambient temperature. Applied Thermal Engineering, Vol. 66, Issue 1, 2014, p. 541-547.
-
Baker C., Jordan S., Gilbert T., et al. Transient aerodynamic pressures and forces on trackside and overhead structures due to passing trains. Part 1: Model-scale experiments; Part 2: Standards applications. Proceedings of the Institution of Mechanical Engineers, Part F: Journal of Rail and Rapid Transit, Vol. 228, Issue 1, 2014, p. 37-70.
-
Gorlé C., Iaccarino G. A framework for epistemic uncertainty quantification of turbulent scalar flux models for Reynolds-averaged Navier-Stokes simulations. Physics of Fluids, Vol. 25, Issue 5, 2013, p. 55105.
-
Stevens R. J. A. M., Wilczek M., Meneveau C. Large-eddy simulation study of the logarithmic law for second-and higher-order moments in turbulent wall-bounded flow. Journal of Fluid Mechanics, Vol. 757, 2014, p. 888-907.
-
Hu H. G., Wu J. S. New constructions of codebooks nearly meeting the Welch bound with equality. IEEE Transactions on Information Theory, Vol. 60, Issue 2, 2014, p. 1348-1355.
-
Yang K., Yang N., Xing C. W., et al. Space-time network coding with transmit antenna selection and maximal-ratio combining. IEEE Transactions on Wireless Communications, Vol. 14, Issue 4, 2015, p. 2106-2117.
-
Ge C., Sun Z. L., Wang N., et al. Energy management in cross-domain content delivery networks: a theoretical perspective. IEEE Transactions on Network and Service Management, Vol. 11, Issue 3, 2014, p. 264-277.
-
Antonov N. V., Malyshev A. V. Inertial-range behavior of a passive scalar field in a random shear flow: renormalization group analysis of a simple model. Journal of Statistical Physics, Vol. 146, Issue 1, 2012, p. 33-55.
-
Benaissa K., Angel P. V. M., Dlolores R. C. M., et al. Predicting initial erosion during the hole erosion test by using turbulent flow CFD simulation. Applied Mathematical Modelling, Vol. 36, Issue 8, 2012, p. 3359-3370.
-
Han F. X., Zhao S. J., Zhang L., et al. Survey of strategies for switching off base stations in heterogeneous networks for greener 5G systems. IEEE Access, Vol. 4, 2016, p. 4959-4973.
-
Xiao P., Sellathurai M. Iterative multiuser detection and decoding for DS-CDMA system with space-time linear dispersion. IEEE Transactions on Vehicular Technology, Vol. 58, Issue 5, 2009, p. 2343-2353.
-
Luo Q. L., Fang W. Reliable broadband wireless communication for high speed trains using baseband cloud. EURASIP Journal on Wireless Communications and Networking, Vol. 2012, 2012, p. 1-12.
-
Serrano P., Costa Perez X. Special Issue: Green Communications. Computer Networks, Vol. 78, 2015, p. 1-3.
Cited by
About this article

This work was supported by the National Natural Science Foundation of China (No. 51674121), by the National Natural Science Foundation of Hebei Province (No. E2017209178), Science and Technology Project of Hebei Province (No. 15214104D), the National Natural Science Foundation of Hebei Education Department (No. QN2016088), and Graduate Student Innovation Fund of North China University of Science and Technology, Graduate Student Innovation Fund of Hebei Province (2017S03, CXZZSS2017071).
Ai-min Yang as a professor provided idea and guided this paper, Yifan Li finished the writing from the beginning to the end, Ling Zhang is responsible for translating this paper, and the other authors checked and submitted this paper to selected journals.
