Abstract
It is crucial to effectively and accurately diagnose fault of rotating machinery. However, high dimension characteristic of features, which are extracted from vibration signals of Rotating machinery, makes it difficult to recognize accurately fault mode. To resolve this problem, t-distributed stochastic neighbor embedding (t-SNE) is introduced to reduce the dimensionality of the feature vector in this paper. Therefore, the article proposes a method for fault diagnosis of Rotating machinery based on local characteristic decomposition-sample entropy (LCD-SampEn), t-SNE and random forest (RF). Firstly, original vibration signals of rotating machinery are decomposed to a number of ISCs by the LCD. Then, feature vector is obtained through calculating SampEn of each ISC. Subsequently, the t-SNE is used to reduce the dimension of the feature vectors. Finally, the reconstructed feature vectors are applied to the RF for implementing the classification of fault patterns. Two cases are studied based on the experimental data of bearing and hydraulic pump fault diagnosis, in which the proposed method can achieve 98.22 % and 98.75 % of diagnosis rate respectively. Compared with the pear methods, the proposed approach exhibits the best performance. The results validate the effectiveness and superiority of the present method.
1. Introduction
Rotating machinery is widely used in many sorts of machinery [1, 2]. If a failure happens to rotating machinery, it may cause breakdown of the machinery system and major loss [3]. Therefore, fault diagnosis of rotating machinery has attracted increasing interest in recent years [4].
Rotating machinery under an abnormal state are usually accompanied with changes in vibration [5]. Therefore, fault detection via vibration monitoring has been proven to be an effective method of enhancing the reliability and safety of machinery.
Local characteristic-scale decomposition (LCD) is a kind of data-driven and adaptive non-stationary signal decomposition method and hence suitable for processing non-stationary signals such as vibration signals of Rotating machinery [6, 7]. The LCD method can self-adaptively decompose vibration signals into a series intrinsic scale components (ISCs) and a residue with a faster running time and a smaller fitting error.
Then, the SampEn is introduced to compress the scale of the fault feature vectors. SampEn, proposed by Richman and Moorman [8], can quantify the degree of the complexity in a time series, which is insensitive to the data length and immunity to the noise in the data [9]. The SampEn of different ISCs can estimate the complexity at multiple time scales.
The LCD-SampEn generates a feature vector with a high dimension. Considering the high dimensionality may result in feature redundancy and a waste of resources for subsequent calculation, it is necessary to reduce the dimensionality of the feature vector. Manifold learning methods are widely used dimensionality reduction methods, which can be divided into two types, linear methods and nonlinear methods. Linear manifold learning methods include principal component analysis (PCA), multidimensional scaling (MDS), etc.; nonlinear manifold learning methods include Isometric Feature Mapping (Isomap), locally-linear bedding (LLE), etc. [10]. As an emerging dimensionality reduction technique, t-distributed stochastic neighbor embedding (t-SNE) can maintain the consistency of neighborhood probability distribution between high-dimensional and low-dimensional space, thus avoiding information loss as much as possible [11]. Therefore, t-SNE is used to reduce the dimensionality of the SampEn feature vectors.
Naturally, after extracting fault feature vectors using LCD-SampEn and t-SNE, the classifier is needed to automatically conduct the fault diagnosis. The RF provides excellent performance in pattern recognition. Hence, this paper attempts to utilize the RF classier to construct a diagnosis model for fault recognition.
The structure of the paper is presented as follows. In the Section 2, the framework of the proposed method is constructed and basic theories of LCD and t-SNE are reviewed. Section 3 conducts two experimental validations based on two commonly used rotating machinery, bearing and hydraulic pump, to evaluate the performance of the present approach. Finally, conclusions are given in Section 4.
2. Methodology
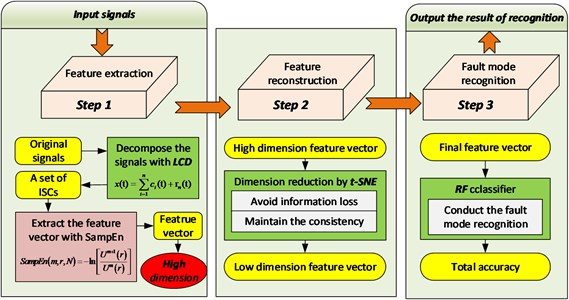
The methodology has three major steps: (1) the LCD is applied to decompose sensor signals into several ISCs and the SampEn of each ISC is extracted as feature vectors; (2) the dimension of the feature vectors is reduced by the t-SNE; (3) feature vectors reconstructed by t-SNE are input into the RF for fault diagnosis. The framework of the methodology can be summarized as Fig. 1.
Fig. 1Framework of the proposed methodology
The LCD method can self-adaptively decomposed a complex signal into a sum of ISCs and a residue with the assumption that any two ISCs are independent of each other. The detail method can be found in [12].
Stochastic neighbor embedding (SNE) is one of the best performed nonlinear manifold learning algorithm whose core idea is to maintain the consistency of neighborhood probability distribution between high-dimensional and low-dimensional space. SNE transfers traditional Euclidean distance-based similarity measurement to conditional probability-based similarity measurement: in high dimensional observation space, the Gaussian distribution is adopted to simulate the similarity relationship between observation samples. Similarity between and is denoted as follows:
where is the bandwidth of the Gaussian kernel function in the observation sample . is the probability of chosen by as its neighbor sample. The parameter obeys a Gaussian distribution in which the variance is and the mean value is . The probability of and being adjacent to each other is:
In low-dimensional space, SNE continues to adopt the Gaussian distribution to measure the similarity between low-distinction samples. However, two obvious shortcomings exist with SNE: (1) the objective function is too complex to optimize, and the gradient is not as concise as desired; (2) the so-called “crowding problem”; that is, when the data are far apart from each other in high-dimensional space, they must be gathered in the process of mapping to low-dimensional space. In response, t-distributed stochastic neighbor embedding (t-SNE) is introduced to alleviate these problems [11].
To solve the first problem, the characteristic of symmetry is adopted to simplify the objective function and optimize the gradient form, which is referred to as symmetric SNE. According to probability theory, the SNE objective function minimizes the sum of distances of the conditional probability distribution (high-dimension) and (low-dimension) for corresponding points. It equals the two following joint probability distributions of (high-dimension) and (low-dimension):
After adopting a joint probability distribution instead of a conditional probability distribution, the formula is more concise and understandable.
As for the second question, the t-distribution function is introduced to alleviate the “crowding problem”. That is, the t-distribution function is used to measure the similarity of points in low-dimensional space. The joint probability distribution function is as follows:
Here, the t-distribution function (DOF is 1) is applied because of its special advantageous characteristic: is the reciprocal of the distance of points far from each other in low-dimensional space to . That means that in low-dimensional space, the presentation of the joint probability distribution is insensitive to the distance of points. In addition, in theory, the t-distribution function offers the same performance as the Gaussian function because the t-distribution function can be express as the infinity Gaussian function. Thus, the gradient of t-SNE is:
3. Case study
As two typical and important rotating machineries, hydraulic pump and bearing are selected to validate the proposed method in case study.
3.1. Fault diagnosis for hydraulic pump
In the first case, the axial piston hydraulic pump is used for analysis. In the experiment, the rotation speed is set as 5280 r/min and the corresponding spindle frequency is 88 Hz. The sampling frequency is 1 kHz. The collected data contains 3 fault modes, normal, piston shoes and swashplate wearing, and valve plate wearing. A sample of 700 points for each team is selected for analysis. 60 samples are collected for each fault pattern, in which 30 samples of each fault pattern are set as the training data and the other 30 samples are set as the testing data.
Table 2 shows an example of feature vectors of each fault mode represented by SampEn of ISCs. As shown in the table 2, due to the high dimension of ISC, the feature vector is usually composed of more than 8 SampEns, which indicates the dimension of the feature vector is over 8 and makes the recognition of fault mode difficult.
Table 3 shows the results of applying the t-SNE to the feature vectors. After using the t-SNE, the feature vectors are reconstructed and reduced automatically to 3 dimensions. Through comparing with Table 2 and Table 3, it is obvious that the reconstructed feature vectors exhibits a strong ability of separability after dimension reduction by t-SNE, which provides a desirable input for the classification.
Table 2Feature vectors represented by SampEn of ISCs
Fault mode | Feature vector | ||||||||
ISC1 | ISC2 | ISC3 | ISC4 | ISC5 | ISC6 | ISC7 | ISC8 | ISC9 | |
Piston shoes and swashplate wearing | 0.918 | 1.626 | 1.269 | 0.602 | 0.281 | 0.077 | 0.068 | 0.025 | 0.003 |
Valve plate wearing | 1.615 | 0.927 | 0.596 | 0.289 | 0.124 | 0.081 | 0.045 | 0.003 | 0 |
Normal | 1.279 | 1.492 | 1.039 | 0.376 | 0.259 | 0.132 | 0.033 | 0.003 | 0 |
Table 3Reconstructed feature vectors using t-SNE
Fault mode | Reconstructed feature vector | ||
Dimension 1 | Dimension 2 | Dimension 3 | |
Piston shoes and swashplate wearing | –84.5229 | 0.3368 | 0.9916 |
Valve plate wearing | 0.9960 | 0.0118 | 0.3499 |
Fig. 2Comparison results of diagnostic methods
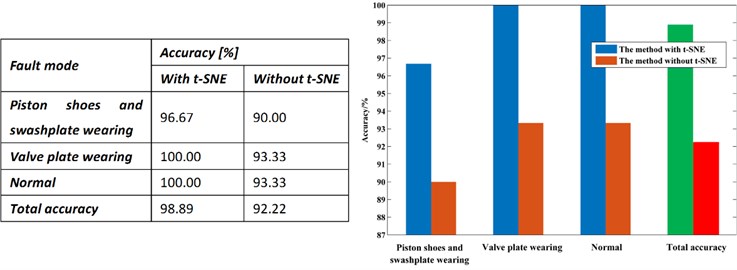
To validate the effectiveness of the t-SNE, the method without t-SNE is used for comparison and the results are shown in the Fig. 2.
From the results diagnosed by the RF, we can see that the proposed method achieves the total accuracy of 98.89 %, in which the accuracy of normal mode, valve plate wearing mode, piston shoes and swashplate wearing mode are separately 96.67 %, 100.00 % and 100.00 %. However, the method without t-SNE only achieve the accuracy of 92.22 %, and the accuracy of three fault mode is 90.00 %, 93.99 % and 93.33. From the results, it is obvious that after dimension by t-SNE, the accuracy improved greatly. This fully demonstrates the effectiveness of the proposed method.
3.2. Fault diagnosis for bearing
In the second case, the data of bearing come from Xian Jiaotong University. In the experiment, the sampling frequency is 20 KHz. The collected data contains four fault modes, normal, bearing inner race, bearing outer race wearing and bearing rollers wearing. A sample of 1024 points for each team is selected for analysis. 100 samples are collected for each fault pattern, in which 40 samples of each fault pattern are set as the training data and the other 60 samples are set as the testing data.
Subsequently, the origin features of the datasets are reduced automatically to 3 dimensions by t-SNE. For comparison, the dimension of the feature vector is also reduced by PCA and LPP as shown in Fig. 3. From the Fig. 3, we can conclude that feature vectors reconstructed by the t-SNE exhibits a stronger ability for separability than PCA and LPP, which provides a desirable input for classification.
Fig. 3Feature vector extracted using a) PCA and b) LPP, c) t-SNE
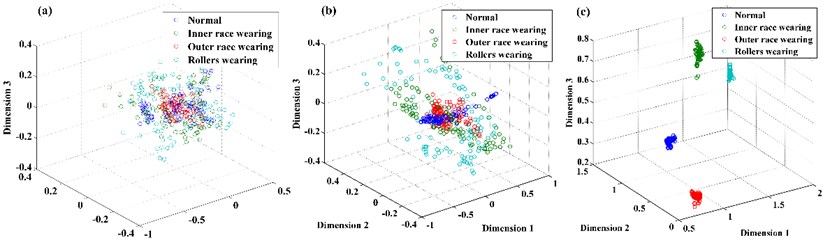
Fig. 4Comparison results of diagnostic methods
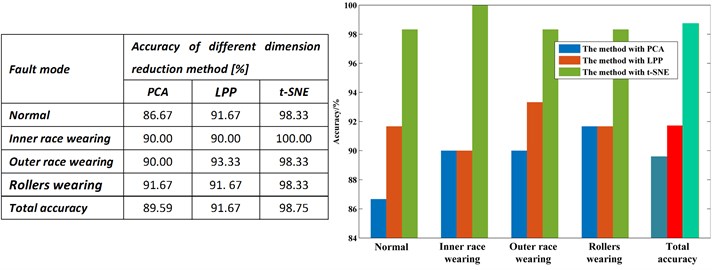
From the results diagnosed by RF showed in Fig. 4, we can see that the PCA method shows the worst performance in the three methods, which the accuracy rates of four fault modes are 86.67 %, 90.00 %, 90.00 % and 91.67 %, and the total accuracy is 89.59 %. That is because the feature is non-linear, and PCA is a typical linear dimension reduction method. For the LPP method, the accuracy of four fault modes are 91.67 %, 90.00 %, 93.33 % and 91. 67 % respectively, and the average accuracy is 91.67 %. The t-SNE method shows the best performance in the three methods, of which the corresponding accuracy is 98.33 %, 100.00 %, 98.33 % and 98.33 %, and the total accuracy is 98.75 %. The result verifies the superiority of the t-SNE method in feature dimension reduction and fault diagnosis.
4. Conclusions
In this paper, t-SNE is introduced to the fault diagnostic method to reduce the dimensionality of feature vectors, which provides a desirable input for classification and helps the classifier achieve a better fault recognition accuracy. The proposed method contains three major steps: firstly, signal decomposition based on CEEMD and feature vector extraction based on SampEn. Then, dimension reduction based on t-SNE. Finally, fault mode recognition based on RF.
In case study, the proposed method is applied to the two-different rotating machinery. In the case of the hydraulic pump, the method with t-SNE and the method without t-SNE are studied for comparison and the accuracy are 98.89 % and 92.22 % respectively. The results illustrate fully that after dimension reduction by the t-SNE, the accuracy of fault diagnosis can be enhanced and the effectiveness of t-SNE is validated. In the second case, we apply three different dimension reduction methods, PCA, LPP and t-SNE, to fault diagnosis of the bearing. The results demonstrate that the accuracy rate of the t-SNE is 98.75 %, which achieves the best result among the three methods. In both case, high accuracy of fault diagnosis is achieved and the results validate the effectiveness and superiority of the present method.
References
-
Chen J., et al. Wavelet transform based on inner product in fault diagnosis of rotating machinery: a review. Mechanical Systems and Signal Processing, Vol. 70, Issue 71, 2015, p. 1-35.
-
Liu Z., et al. A hybrid fault diagnosis method based on second generation wavelet de-noising and local mean decomposition for rotating machinery. Isa Transactions, Vol. 61, 2016, p. 211-220.
-
Zhang Y., Tang B., Xiao X. Time-frequency interpretation of multi-frequency signal from rotating machinery using an improved Hilbert-Huang transform. Measurement, Vol. 82, 2016, p. 221-239.
-
Lin J., Dou C. The diagnostic line: a novel criterion for condition monitoring of rotating machinery. Isa Transactions, Vol. 59, 2015, p. 232-242.
-
Cempel C., Tabaszewski M. Multidimensional condition monitoring of machines in non-stationary operation. Mechanical Systems and Signal Processing, Vol. 21, Issue 3, 2007, p. 1233-1241.
-
Zheng J., Cheng J., Yang Y. A rolling bearing fault diagnosis approach based on LCD and fuzzy entropy. Mechanism and Machine Theory, Vol. 70, Issue 6, 2013, p. 441-453.
-
Zheng J., et al. A rolling bearing fault diagnosis method based on multi-scale fuzzy entropy and variable predictive model-based class discrimination. Mechanism and Machine Theory, Vol. 78, Issue 16, 2014, p. 187-200.
-
Richman J. S., Moorman J. R. Physiological time-series analysis using approximate entropy and sample entropy. American Journal of Physiology Heart and Circulatory Physiology, Vol. 278, Issue 6, 2000, p. H2039.
-
Li Y., et al. A new rolling bearing fault diagnosis method based on multiscale permutation entropy and improved support vector machine based binary tree. Measurement, Vol. 77, 2016, p. 80-94.
-
Bregler C., Omohundro S. M. Nonlinear manifold learning for visual speech recognition. International Conference on Computer Vision, 1995.
-
Laurens V. D. M., Hinton G. Visualizing data using t-SNE. Journal of Machine Learning Research, Vol. 9, Issue 2605, 2008, p. 2579-2605.
-
Wang Y., et al. A centrifugal pump fault diagnosis approach based on LCDApEn and PNN. Vibroengineering Procedia, Vol. 5, 2015, p. 169-174.
Cited by
About this article

