Abstract
This article describes possible ways of measuring rotation irregularities. It focuses on hardware and software equipment necessary for measuring speed irregularities. The article contains examples of measurements and describes the reasons why it is necessary to know about possibilities of evaluating speed irregularities.
1. Speed irregularities
During measurements associated with acoustic or vibration signal diagnostics, determination of exact speed of the device being measured is sometimes essential. For example, vibration measurements on combustion engines or on electrically-powered drives with uneven load (i.e. compressors, presses, variable load hydraulic pumps, etc.) depend on the speed. However, these types of machines do not guarantee even revolutions. Changing the angle of rotation of the shaft during one single revolution is not linear. Diversion of angle is affected by actions inside the drive or its load. In a four-stroke combustion engine, the cycle depends on a single cycle of the combustion engine, which is equivalent to 720°.
Actions inside the drive or load lead to overloading the entire system with additional torsional vibrations, which may lead to shorter life of couplings, cogs or clutch shaft parts. This rotation unevenness has a major impact on the results of frequency analyses performed on drives or loads. Most analyses assume that the speed may vary during the measurement, but each individual revolution is linear.
The following part describes the drawbacks of using classic FFT analysis when measuring devices with irregular speed. The right choice of a current measurement system for the measured shaft is the key factor of correct evaluation of speed irregularity. Complete evaluation of rotational irregularity is a matter of our software solution for the PULSE system. After eliminating synchronization errors in speed measurement, it is possible to perform synchronous averaging of time data followed by FFT analysis.
2. FFT frequency analysis
This commonly used basic frequency analysis does not require specific introduction. This is the frequency analysis that is mostly used in vibrational signal processing. FFT analysis uses a modified Fourier transformation of the time signal. This is a transformation of the time signal into individual harmonic frequencies represented by function. The result is shown in the form of frequency spectrum.
In technical diagnostics, it is advantageous for the frequency to have linear scale with very small step. This is advantageous for exact determination of the first rotation frequency. To set it, it is important to specify the required range of frequency, number of lines, time weighting function, averaging type and overlap.
The disadvantage of the FFT analysis is the need to have a long time signal of the measured signal to be able to perform it. The length of this signal depends on the frequency range and number of lines. The length is usually from 0.25 to 8 s. The signal must be invariable during this time, otherwise a deformation of measured spectrum will occur.
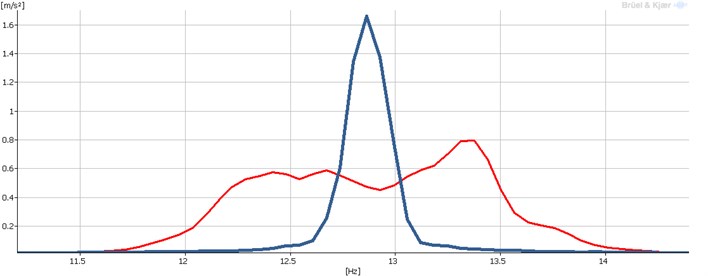
Fig. 1 shows two signals. One signal (thicker blue) was stable during the measurement while the other (thinner red) had irregular speed due to variable load. Application of this result to further analysis is rather limited.
Fig. 1FFT spectrums of a first harmonic frequency
3. Speed measurement options
The speed can be easily detected directly from the measured vibration signal. In majority of cases, there is a disbalance at the first rotation frequency. This is theoretically possible, but in practice, this method of measuring actual speeds is not much used because of very good balance of the measured machine, or poor resolution in the frequency in the measured FFT spectrum. This poor resolution would lead to a major error in speed measurement.
Current speed measurement options:
– from measured FFT spectrum of sound or vibration;
– direct tacho probe measurement (rotational probe);
– non-contact measurement with a Hall sensor [1];
– speed sensor for rotating shaft [2].
From the above-mentioned methods of speed measurement, we will only focus on the use of probes which have a measurable output voltage corresponding to the revolution or its fractions. A suitable option to measure the actual speed is to use a tacho probe. The tacho probe usually works on the optical principle. The reflection of the transmitted signal is reflected from the reflective mark on the shaft and causes a step change in the output voltage. These voltage peaks can be used to display actual speed in the measurement system.
This speed measurement system gives us additional information. The tacho probe responds to the reflection from a particular point on the shaft that has constant angle to the measured system. Therefore, it is possible to state that the tacho probe can be used to determine the moment when the measured shaft is positioned in a particular angle. This is used for example by order analysis, which synchronizes and resamples the measured signal so that the result is independent from the rotation speed.
However, there is a major problem. The tacho probe is often positioned at a greater distance from the measured object, which is often placed on a flexible base. The tacho probe is often attached to a tripod and is usually standing on a common floor. This type of positioning allows relative movement between the shaft with the reflective mark on it and the tacho probe.
Despite this disadvantage, the use of tacho probe has other advantages, such as short installation time, ability to measure speed over longer distances (for example, through the glass in the testing room) and the possibility of focusing the ray of light on the inside parts of the machine (e.g. through a small hole).
In order to minimize relative movement between the measured object and the shaft, the use of measuring systems attached directly on the shaft is therefore more appropriate.
4. Software solutions for PULSE system
Brüel Kjær PULSE measuring system can be adapted to measure the irregularity of the speed. Our software module performs its own measurements. In the next step, it makes appropriate adjustments to the time signal and the individual revolutions. Subsequently, an angle is calculated in relation to the time corresponding to the regular revolution. This assumption based on probability is compared to real-time measured data. The detected differences show as deviations in degrees for given shaft position.
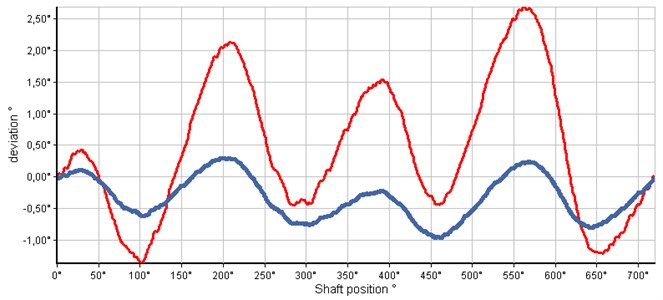
The following illustration shows an example of angle irregularity of the crankshaft during one work cycle. For piston combustion engines, typical crankshaft speed irregularity is 720° length of working cycle. Depending on the load and rotational speed of the internal combustion engine, the irregularity of crankshaft rotation speed varies considerably.
Fig. 2Deviations in degrees depending on the shaft position. One signal (thicker blue) was for a small load and second signal (thinner red) had irregular speed due to variable heavy load
The designed algorithm evaluates the measured differences of shaft rotation from theoretical position which would correspond to a regular rotation of the crankshaft. The evaluation of speed rotational irregularity is also important in cases where torsional vibrations can occur, and it is necessary to know the frequencies and amplitudes of these oscillations. Torsional vibrations may cause additional unnecessary strain on couplings and cogs.
5. Synchronous averaging
Elimination of rotational speed problems enables us, for example, to perform synchronous averaging. The result of FFT analysis is only one spectrum. Classic averaging for FFT analysis is based on the calculation of a certain number of individual spectra, which are then averaged for individual frequencies.
This classic averaging is not always satisfactory. In some cases, it is better to avert the measured time signal itself. It is then possible to perform FFT analysis on this average time signal. By averaging the measured signal appropriately, other sources of vibration on the measured object may be eliminated [3]. For this averaging, we need to define a repeatable trigger (mostly performed by an optical probe responding to a pre-defined shaft rotation position) and a suitable object to be measured. If the measured part of the machine reaches a speed rotation that is no longer present on other parts of the machine, the following effect will occur at each subsequent measured data. Other unsynchronized sources will show in each measured data with a different phase. After some time, their influence is completely eliminated.
This method is particularly suitable for measuring vibrations in gearboxes and various types of drives. All other sources that do not rotate at the same speed rotation as the measured shaft will be eliminated by averaging after a while and their effect on the measured signal will be minimized.
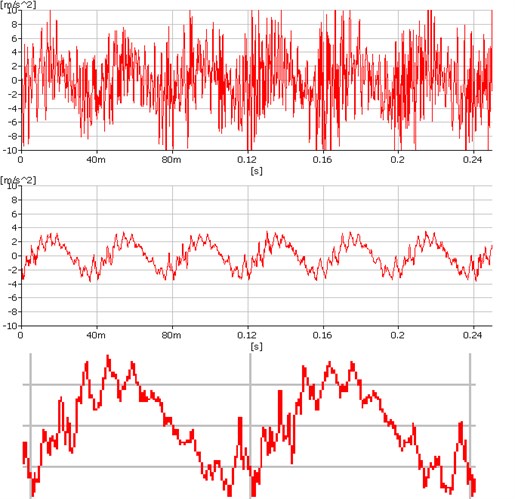
Fig. 3 shows the time course of vibrations of the gearbox in a very poor technical condition. Both the measured time and the resulting spectrum were poorly readable. After applying synchronous averaging of the time measured data, the time in the middle of the image was calculated. It is even possible to identify strokes from individual cogs (bottom zoomed time).
Fig. 3Application of the synchronous averaging on measured data
6. Conclusions
From the findings mentioned above, it is important to measure speed rotation for evaluation in technical diagnostics. This measurement should identify the possible speed irregularities of the shaft rotation. In the case of the speed irregularities, it is inappropriate to use the measurement for FFT analysis with a long-time data record. Torsional vibrations can be identified from measuring of the speed irregularities too.
References
-
Sheu G.-J., Sie Soedel M.-J.-W. Design and application of a novel contactless sensor. IEEE International Conference on Mechatronics and Automation, ICMA, 2012, p. 702-707.
-
Kroening M., Hite J. Velocity sensor for rotating shafts. Sensors, Vol. 15, Issue 9, 1998, p. 89-91.
-
Mark W. D. Time-synchronous-averaging of gear-meshing-vibration transducer responses for elimination of harmonic contributions from the mating gear and the gear pair. Mechanical Systems and Signal Processing, Vol. 62, 2015, p. 21-29.
About this article

This article was written at the Technical University of Liberec, Faculty of Mechanical Engineering with the support of the Institutional Endowment for the Long Term Conceptual Development of Research Institutes, as provided by the Ministry of Education, Youth and Sports of the Czech Republic in the year 2017.
