Abstract
The test of traces prints, or sometimes called as “tests for colour” lie in examining the area where the teeth touch the gearing at a specific load. The mutual prints, which are reached under given corrections of the gearing, are simulated by a practical test. It is the simplest way of practically evaluating the correct grip of cogwheels. This process is used for analysing the problematic gear. Based on the results of this test, it is possible to establish the area of interest for new corrections of gearing which can help to reduce the noise level, improve the grip conditions or durability on the given gearing.
1. Introduction
The tested gear must be degreased and it is first mounted into special housing which has cut holes. Through these holes, a special coating is applied on the tested gear and after the running-in, the test results are recorded with a laparoscopic camera. The complete gearbox is fixed to the relevant engine block and the whole configuration is placed in a test stand by using silentblocks. Everything is done in a way so that the situation is as close to the real vehicle installation as possible. The electric motor driving is provided only from the engine (in both senses of speed – for simulation of engine braking). The half-axes are braked by real disk brakes which simulate the road resistances and load. The braking force is expressed as a load in Newton-meters. The maximum value is 180 Nm. However, the measurement is generally made up to 120 Nm – in dependence on the load capacity of the gearbox. When the values are higher, the trace does not change significantly (by reason of elastic deformation of gearing – full supporting colour appears. The maximum revolution is 30 min-1.
2. Basic types of supporting colours
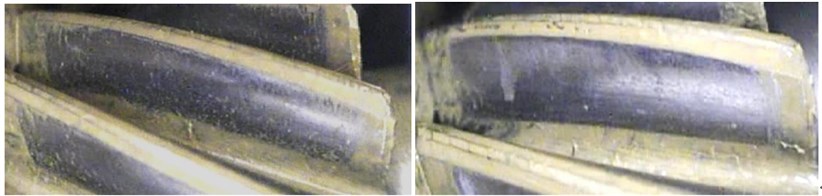
a) Full supporting colour (Fig. 1).
Full supporting colour is characteristic for a heavy load – this effect occurs due to elastic deformations and correctly set corrections and it is not acoustically evident in traffic.
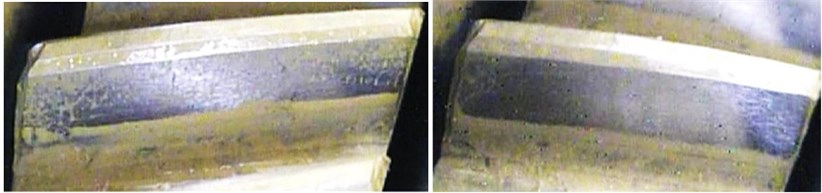
b) Mirror supporting colour (Fig. 2).
Mirror supporting colour has a smaller bearing area than full supporting colour. It usually develops when the load is low (smaller elastic deformations) in normal traffic by reason of barrel gearing ( a ). When the load is heavy, it changes to full supporting colour.
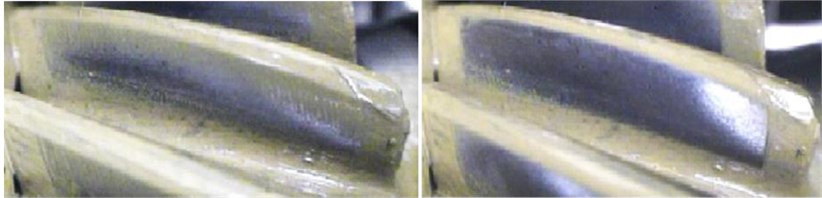
c) Addendum/dedendum supporting colour (Fig. 3)
This type of supporting colour is given by an incorrect profile of the tool. It is being solved by a profile modification. Addendum/dedendum supporting colour is dangerous because of the appearance of pitting (big pressure in a small area – Hertz pressure); and in terms of noise it is one of the worst cases.
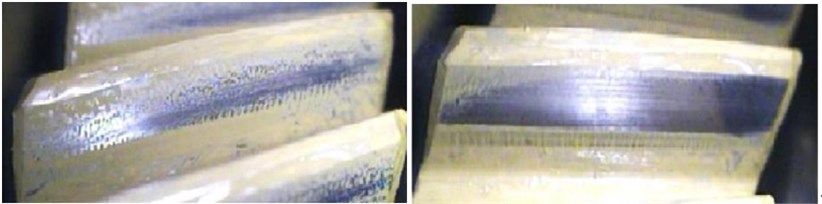
d) Corner supporting colour (Fig. 4).
In this case, the bearing area is situated in the gearing edges. It leads to unsmooth running owing to a small supporting part; again, there is a threat of pitting appearance. The main reason for this is an unsuitable angle of inclination or – from the technological point of view – deviation of the helix slope .
e) Conical supporting colour (Fig. 5).
Conical supporting colour is formed especially because of a badly fixed workpiece in the machine or by a large deformation of a cogwheel.
f) Crossing trace.
Crossing traces can appear along the helix (Fig. 6) but also along an involute. This happens owing to a big circumferential runout . Possible causes: eccentric hole, heat deformations, badly fixed workpiece in the machine. It is demonstrated by a fluctuating character of vibrations.
Fig. 1Full supporting colour [1]
![Full supporting colour [1]](https://static-01.extrica.com/articles/18540/18540-img1.jpg)
Fig. 2Mirror supporting colour [1]
![Mirror supporting colour [1]](https://static-01.extrica.com/articles/18540/18540-img2.jpg)
Fig. 3a) Addendum supporting colour and b) dedendum supporting colour [1]
![a) Addendum supporting colour and b) dedendum supporting colour [1]](https://static-01.extrica.com/articles/18540/18540-img3.jpg)
![a) Addendum supporting colour and b) dedendum supporting colour [1]](https://static-01.extrica.com/articles/18540/18540-img4.jpg)
Fig. 4Edge supporting colour [1]
![Edge supporting colour [1]](https://static-01.extrica.com/articles/18540/18540-img5.jpg)
Fig. 5Conical supporting colour [1]
![Conical supporting colour [1]](https://static-01.extrica.com/articles/18540/18540-img6.jpg)
Fig. 6Crossing trace [1]
![Crossing trace [1]](https://static-01.extrica.com/articles/18540/18540-img7.jpg)
2.1. Evaluation of tracing tests
Traces evaluation is a specific matter where the main factor is especially the evaluator experience. The evaluation output is not any physically measured quantity (except the area of contact ratio). The result is mainly a visual view of colour-coded traces after rolling the cogs.
The problem appears especially in cases where it is necessary to learn how the running-in behaves on a given load. During this test, the low load is changed into the heavy load, and the traces after both these regimes are then visible on sides of the cogs. It is not possible to deduce – in a simple way – for example 50 Nm without lowering the load (and therefore also the relevant print) previously. At present, the solution lies in making the measurement again on a low load – separately – and both traces will, in simple terms, be “deducted” from each other. This will provide a trace after the heavy load. Nevertheless, this solution is not so perfect and the results readability is limited.
It is also necessary to mention that even though the test stand is as close to the real vehicle installation as possible, certain errors still appear in the measurement. It is caused especially by a manual assembly of the gear into the prepared housing. The adjusted housing itself can have a certain influence on it. The cut holes are as small as possible so that they would not have any influence on the housing solidity. It is necessary to degrease the gearing perfectly so that the colour sticks to it. It is not possible to observe the traces on the pinion due to the inaccessibility of the place of the grip of the constant gear. It is possible to analyse only the traces on the driven gear of the final drive – to simplify it, both traces are thought to be the same.
3. Results of tracing on a serial type of construction
Fig. 7Tracing 1° backward – series
a) 0 Nm a 20 Nm, 1° driving (Festrad), right side
b) 0 Nm a 20 Nm, 1° driven (Schaltrad), left side
3.1. Evaluation of tracing results
A zero load does not exist in real traffic. Certain passive resistances which load the gear always appear. In the regime „backward“, the engine brake effect ranging approximately from 6 to 18 Nm is taken into account in practice. Therefore, the prints tracing is by default carried out ranging from 0 to 20 Nm. The issue of the indicated noise level is related to 18 Nm, which means the results of traces are from 20 Nm. Consequently, it can be stated that the rolling trace is not optimal. Even when taking into consideration such a relatively low load, the edge matching in both the longitudinal and lateral directions is visible. In addition, almost full supporting colour appears even when the load is zero.
4. Tracing test results
Fig. 8Tracing 1° backward – proposal
a) 0 Nm a 20 Nm, 1° driving (Festrad), right side
b) 0 Nm a 20 Nm, 1° driven (Schaltrad), left side
4.1. Tracing results evaluation – proposal
When comparing the results of the previously made calculation and the results of the practical tracing test, we can state that the results correspond. Compared with the serial type of the construction, the trace and the edge supporting colour – which negatively influenced the traces on the serial type of the construction – were reduced. Due to the extension of the lateral barrel gearing, the “full supporting colour” was changed into “mirror supporting colour” which is characteristic for big values of barrel gearing.
Especially when simulating the zero load ( 0 Nm), the difference is clearly visible. The trace of the supporting colour was considerably reduced and it also changed its shape from an angular shape of the full supporting colour to an elliptical shape of the mirror supporting colour. In this regime, the edge supporting colour was also completely removed.
Fig. 9Results comparison from EOL – the whole spectrum
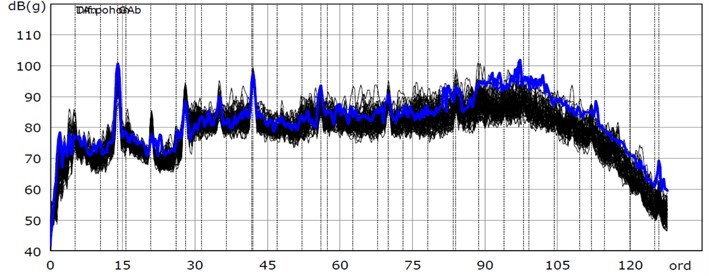
5. Results from the noise level state (EOL)
As well as all the serial gearboxes, also the test ones are assembled on the same assembly line so that the principle of the serial assembling is kept. Within the assembly, each gearbox goes through a so-called test bench (EOL). The following graphs are the results of the order analysis from this noise level in the regime of the first gear on the backward side. The figure allows us to see the differences between the gearbox and new, proposed modifications (blue curve) and serial measuring of safe gearboxes from the same day (black curves).
In the following figures, we can see the comparison of the amplitude size of the first harmonic frequency (Fig. 10) and the second harmonic frequency (Fig. 11) depending on the speed of the gearbox drive shaft.
Fig. 10Results comparison from EOL – amplitude of first harmonic frequency
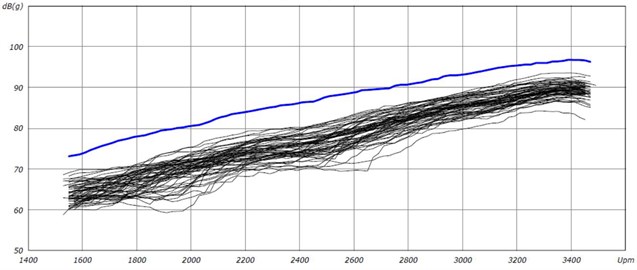
Fig. 11Results comparison from EOL – amplitude of second harmonic frequency
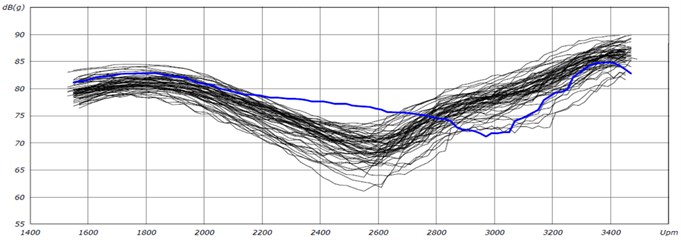
Fig. 12Amplitudes of acceleration comparison: green – first harmonic frequency, blue – second harmonis frequency, yellow – first interharmonic frequency
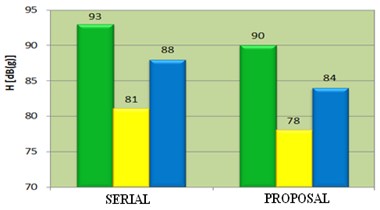
Fig. 13Amplitudes of sound pressure comparison: green – first harmonic frequency, blue – second harmonis frequency
6. Conclusions
The results clearly show that – with increasing speed – the amplitude of the first harmonic frequency increases on a linear basis. Modificated gearing shows the increase of this amplitude by an average of 5 to 10 dB in comparison with the serial type of the construction of the gear.
The second harmonic frequency has a slightly different course. We can observe a local minimum of the values of the amplitude which is – in serial type of construction – ranged between 2400 and 2700 min-1. When considering the modificated type of construction, it is slightly moved to higher speed. As for the amplitude size, the results are comparable in low speed, higher in middle speed and rather lower in high speed – as shown in the graph.
Graphs (Fig. 12 and 13) show the comparison of amplitudes:
1) Graph in the Fig. 12 compares the amplitudes of acceleration of the first and second harmonic frequencies, including the interharmonic one.
2) Graph in the Fig. 13 compares the amplitudes of the sound pressure of the first and second harmonic frequency from the driving test, from the microphone. The first harmonic frequency of the sound pressure in the vehicle cab was reduced by 5 dB. Therefore, the noise impact on the vehicle crew was slightly reduced as well.
From the diagnostic point of view, the amplitude modulation around the first harmonic frequency was also completely removed.
References
-
Documents of Škoda Auto a.s., Mladá Boleslav, (Internal Data Source).
-
Dočkal A. Structural Optimization of the Gearbox with Regard to the Reduction of the Noise Emission. Brno University of Technology, 2003.
-
Moravec V. Construction of Machines and Equipment II Spur Gears: Theory – Calculation – Construction – Production – Control. Ostrava, 2001.
-
Tomeh E. Identify the sources of vibration and noise on cars gearbox by spectral analysis. 54th International Conference of Machine Design Departments, 2013.
-
Tomeh E. Technical Diagnostics: Vibration Diagnostics of Machines and Equipment. Technical University of Liberec, Liberec, 2015.
-
Oudrnický T. Constructional Modification of Gearbox for Noise Reduce. Diploma Thesis. Technical University of Liberec 2016.
About this article

