Abstract
Aiming at achieving early fault diagnosis and tracking the degradation process of bearings, we propose a novel monitoring methodology using a spectrum searching strategy in this paper. Firstly, a vibration signal is collected with appropriate sampling frequency and length. Secondly, the structural information of spectrum (SIOS) on a predefined frequency grid is constructed through a searching algorithm after deriving the single-sided FFT spectrum. Finally, the two-dimensional (2-D) line plot of the frequency grid versus the average power in SIOS is employed to conduct fault detection and the sum of the largest six total-power (SLSTP) of the frequency grid in SIOS is calculated as a health indication to demonstrate the changes in the bearing’s health status. The performance of the proposed scheme is validated with both simulation and bearing data. Experimental results show that the monitoring algorithm could manifest satisfactory behaviors in early fault diagnosis and health assessment of bearings.
1. Introduction
As one of the foremost applied components, rolling element bearing plays a crucial role in the whole safety running process of rotating machinery. Their failures or abnormities could generally cause machine breakdowns and even catastrophic consequence during the production process [1, 2], which necessitates the continuous state monitoring in the whole life-cycle of bearings. Vibration analysis is a generally applied technique in bearing fault diagnosis owing to vibration signal carrying abundant information about failure mode and fault location. Recently vibration-based monitoring is becoming a vital measure in prognostic and health management (PHM), which devotes to collecting and presenting the health state information of a target machine component or an overall system [3, 4].
As is pointed out in [4], an effective PHM system should be dedicated to evaluating the health state of a monitored object using the measured data collected from normal condition to abnormal or failure case. Through employing such a system, the health state of the monitored system can be under control so that the scheduling of preventive maintenance and the inventory of spare parts can be reasonably adjusted or optimized. If so, the goal of cost and time savings can be achieved significantly. Health monitoring is a critical procedure in PHM activities of bearings and mainly consists of the early warning or detection of fault, the assessment of deterioration process and the guidance for prognosis of remaining useful life [5]. Some published literatures are focused on assessing the health state of bearings with features extracted through time-domain, frequency-domain and time-frequency domain methods [5-7]. And for fault diagnosis of bearings, it can commonly be divided into fault classification and fault detection. Fault classification contributes to identifying the health state of bearings with features derived from monitoring signals, and there mainly exists two categories: supervised and unsupervised methods. Supervised methods, such as artificial neural networks and support vector machine [8, 9], are devoted to fault classification only upon the labeled data. While unsupervised methods, such as self-organizing map and cluster approaches [10, 11], are dedicated to fault classification only utilizing the unlabeled data. For instance, an optimized -nearest neighbor (-NN) classifier was employed by Tabaszewski in [12] for the state classification of bearings, and Strączkiewicz et al. [13] performed bearing fault classification in different stage of its development using minimal distance, -NN and -mean-based clustering approaches, etc. Fault detection is applied to localize faults of bearing and its main challenge is how to eliminate or reduce the influence of noise and detect faults in incipient stage successfully. Aiming at these issues, some researchers have also investigated fault vibration responses and properties [14, 15] and signal pre-whitening techniques [16, 17] with regard to bearing fault detection.
In failure stage, the bearing defects can be mainly categorized as local and distributed faults [18]. However, it has been noticed that the localized defects occur more frequently than others in bearing raceway [19]. When a localized fault occurs in a bearing such as the surface of inner-race or outer-race, there commonly generates an impact shock for every rotational period. And this impact shock can excite the resonance of the bearing system to cause a change of the structure of the single-sided amplitude spectrum for frequency-domain analysis, especially nearby the bearing characteristic frequencies (BCFs) and their harmonics. Since the BCFs are usually considered as a prominent indication [20], classical spectrum analysis techniques such as fast Fourier transform (FFT) analysis and envelope analysis are applied to perform the fault diagnosis of bearings [21, 22]. Furthermore, if all the harmonics of BCFs can be searched in the FFT spectrum, the impulse generated by bearing fault could be determined as well [23]. To the knowledge of the authors, the impulse signature presents so weak that the fault detection encounters a greater challenge on account of the presence of noise at the early fault stage. However, the harmonics of BCFs can be detected in the spectrum, but it is not possible to determine the BCFs through simply measuring the spacing of the harmonic series. Furthermore, with regard to the crack formation, growth and deterioration, the power magnitude of the BCFs as well as their harmonics generally served as an indicator could make a difference on the degraded degrees of bearing [24]. Therefore, focusing on constructing a novel feature to depict the bearing degradation, the authors propose a vibration-based methodology for health state assessment of bearings using the structural information of spectrum (SIOS) algorithm demonstrated in literature [25].
In this article, a novel health monitoring strategy is presented by deeply digging the context of the single-sided amplitude spectrum in frequency domain. First, vibration signals are acquired with appropriate sampling rate and length and then transformed into frequency domain to acquire the single-sided amplitude spectrum. Then, the SIOS algorithm is adopted to construct the projected spectrum on a predefined frequency grid. Finally, the two-dimensional (2-D) line plot of the frequency grid versus the average power in SIOS is employed to perform fault diagnosis and the sum of the largest six total-power (SLSTP) of the frequency grid in SIOS is regarded as a health indicator to capture the degradation trend. Simulation and experimental studies are presented to evaluate the performance of the proposed method in early fault diagnosis and state assessment of bearings.
The remainder of this paper is organized as follows. Section 2 describes the health monitoring methodology detailly, including the construction of SIOS and health index. Sections 3 and 4 are dedicated to evaluating the proposed monitoring scheme with simulation and experimental data. Finally, some conclusions are drawn in Section 5.
2. Health monitoring methodology
In order to trace the evolutional process of the health state of bearings, we formulate a novel index focusing on the power variability of the spectrum derived in frequency domain. To begin with, the SIOS of the current analyzed signal is constructed with a simple searching and projection strategy. Then the average power and the so-called SLSTP in SIOS are exploited to conduct fault diagnosis and to capture the changing process of bearing health state, respectively. Next the proposed health monitoring scheme will be illustrated in detail.
2.1. The SIOS algorithm
Conversely to other methods, the SIOS algorithm presented in [25] seems a promising strategy for bearing fault diagnosis just through simple searching and projection of the FFT spectrum. The main idea of the SIOS for bearing fault diagnosis is that the energy magnitude around the BCFs as well as their harmonic components will change when faults take place. Obviously, these changes also run through the entire life-cycle of the bearing’s degradation. Hence, we establish a health monitoring framework based on the SIOS algorithm, which is illustrated as follows.
For clarity, some nomenclatures are appointed in advance. is defined as the th single-side power amplitude of FFT spectrum; and is the corresponding frequency of in Hz.
(1) Search local peaks of spectrum. First, the vibration signal collected with sampling rate is converted into frequency domain through FFT algorithm to acquire the single-sided amplitude spectrum, whose resolution is denoted as . Then local peaks of the spectrum are searched and labeled if inequality(1) is satisfied:
where is a nonnegative integer and is a nonnegative constant. Having done these procedures, we can obtain local peaks from the FFT spectrum.
(2) SIOS construction. In order to build the SIOS, a frequency grid must be assigned in advance and it is predefined as:
where represents the resolution of the frequency grid. Generally, is equal or less than . Next, all the labeled local peaks are projected onto the frequency grid one by one. Finally, the total power of local peaks projected onto the every component of is utilized to represent the SIOS as follows:
where represents the total number of peaks projected onto and .
Otherwise, to ensure all the labeled local peaks can be projected onto , there is a critical restriction to be emphasized that the resolution of the original spectrum must satisfy the following condition:
More detailed descriptions about the SIOS algorithm can be found in [25].
2.2. Health indicator construction based on SIOS
In order to monitor the running state of bearings immediately, we propose a novel health monitoring strategy with the SIOS obtained in previous subsection. And this monitoring index is called as “SLSTP” in our research. The main procedures of the proposed scheme can be summarized as follows.
Step 1: With a preset sampling rate , vibration signal is collected from the monitored bearing with an appropriate length according to to satisfy the frequency-resolution condition.
Step 2: The vibration signal is then transformed into frequency-domain using FFT algorithm to acquire the single-sided amplitude spectrum.
Step 3: Determine parameter and , then search local peaks of the spectrum according to inequality (1). Finally, local peaks are found from the spectrum.
Step 4: Project the local peaks onto the predefined frequency grid to construct the SIOS.
Step 5: For each frequency grid , compute the total number of the projected peaks, i.e. , and the total energy, i.e. , of the SIOS.
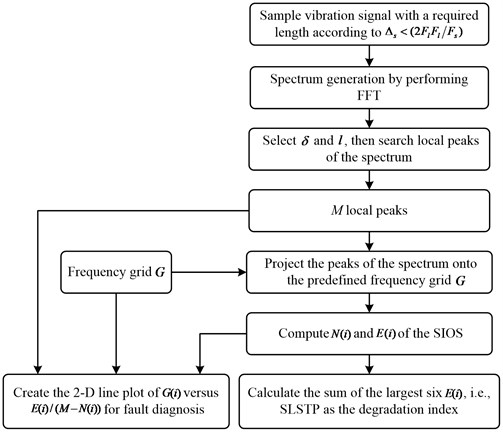
Step 6: Create the 2-D line plot of (frequency grid) versus (called “average power” in this paper) for fault diagnosis and compute the SLSTP, i.e., the summation of the largest six amplitudes of , as the degradation index of bearings.
Fig. 1 depicts the framework of the proposed health assessment methodology for bearings detailedly.
Fig. 1The framework of the proposed health assessment methodology
3. Simulation analysis
In this section, a simulation experiment is designed to validate the effectiveness of the proposed methodology for health monitoring. We simulate the vibration signals along the whole degradation process of the bearing. Herein, the flowing parameters are considered in the simulation: pitch diameter 23 mm, roller diameter 8 mm, pitch angle 0° and the number of rollers 9. The bearing has an outer-race defect, its shaft rotational frequency 30 Hz (i.e., the corresponding shaft rotational speed 1800 rpm) and the bearing-induced resonant frequency 3500 Hz. Then the ball-pass frequency of the outer raceway can be calculated as:
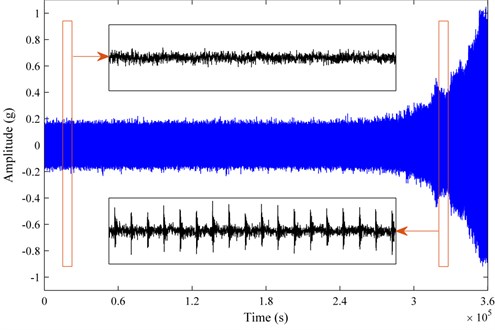
The sampling frequency 12000 Hz, and each sample consists of 18000 data points, i.e. 1.5 s, and the sampling is triggered every 10 minutes. To simulate the whole degeneration process of the bearing, vibration samples in normal stage are repeated 400 times and the vibration samples in failure stage are repeated 200 times with the increasing fault severity. That is to say, an incipient outer-race fault occurs in the 401st sample (about at the time of 2.4×10⁵ second). And the vibration signal produced by the out-race fault in failure stage is generated according to the simulation model presented in [26]. The simulated vibration signals of the whole lifetime and the zoomed-in views of the normal and failure stage are shown in Fig. 2.
Fig. 2The simulated vibration signals of the whole lifetime
In this simulation analysis, we predefined the frequency grid as [70 Hz, 170 Hz). Then the resolution of the FFT spectrum must satisfy:
Hence, the signal length can be set as 214 to carry out sampling due to the resolution 12000/214 0.7324, which satisfies the above limiting condition. Moreover, the resolution of the frequency grid is assigned as 0.25 . The SLSTP of the simulated signals is presented in Fig. 3.
Fig. 3The SLSTP evolution of the simulated vibration signals
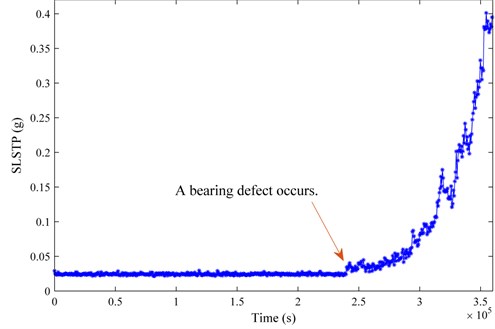
Examining the SLSTP process in Fig. 3, an explicit change is detected at the time of 2.4×10⁵ second (the 401st data sample), which means that a bearing defect may occur in that monitoring sample. Therefore, the fault detection is triggered after monitoring an anomaly warning during runtime. The time waveform of the 401st simulated sample is shown in Fig. 4, where periodic characteristics cannot be observed directly due to the heavy noise. With the proposed method, the corresponding diagnostic spectrum is plotted in Fig. 5.
Fig. 4The time waveform of the 401st simulated sample
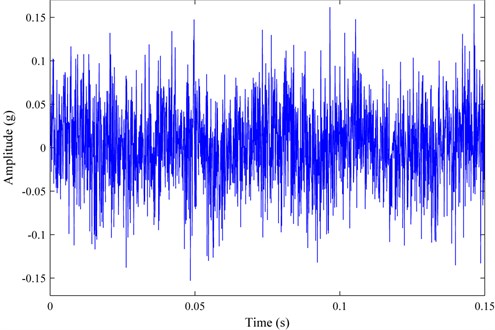
Fig. 5The spectrum of E(i)/(M-N(i)) versus Gi of the 401st simulated sample
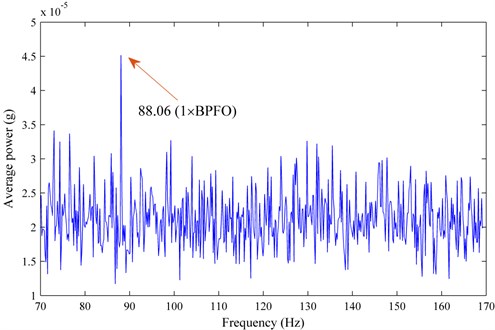
From the spectrum in Fig. 5, it can be seen that there exists a large-amplitude at 88.06 Hz, which corresponds to the ball-pass frequency of the outer raceway of the bearing thanks to utilizing the proposed fault detection approach. This illustrates that the proposed method can be applied to the bearing fault detection in weak defect stage.
The simulation results show that the proposed strategy seems a very promising approach for the health monitoring of bearings. Next, bearing vibration data sets obtained from a run-to-failure test are employed to further evaluate the performance of our methodology.
4. Experimental analysis
4.1. Experimental setup
To assess the capability of our proposed methodology, vibration data sets provided by the NSFI/UCR Center for Intelligent Maintenance Systems (IMS) [27], are applied to perform the experimental validation. As shown in Fig. 6, four testing bearings support one shaft which was loaded with 6000 lbs in the radial direction. The rotation speed was set to 2000 rpm with assistance from an AC motor and all bearings were lubricated during the experiments. Vibration signals were acquired using acceleration transducers that installed on the bearing housings. In order to guarantee the safe running of the mechanical system, a magnetic plug mounted in the oil feedback pipe was utilized to collect metal debris produced by the bearing system so that the bearing run-to-failure tests could be stopped until the debris accumulated to a certain level. More detailed instructions on this test rig and can be found in [27].
Fig. 6Accelerated degradation test bench of breaings
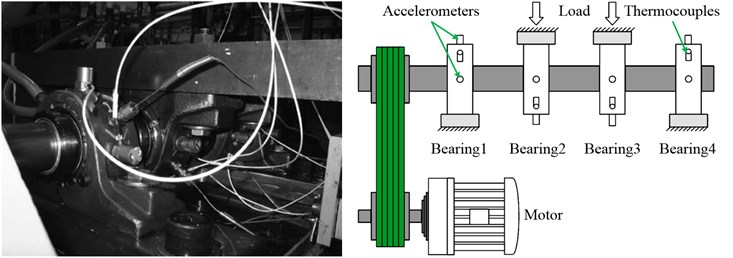
In this research, two vibration data sets (testing 1 and testing 2) are applied for the validation of the proposed health monitoring strategy. Vibration data in testing 1 and 2 were collected every 10 minutes with data-acquisition equipment. The sampling frequency was set to 20000 Hz and each signal with 20480 data points was sampled and stored in an ASCII file. At the end of testing 1, an inner race failure and a roller element failure occurred in bearing 3 and bearing 4 respectively; and as for testing 2, an outer race failure was found in bearing 1 after the life test. Next the above-mentioned vibration data sets are applied to validate the performance of our proposed scheme.
4.2. Health monitoring with the proposed methodology
4.2.1. Degradation assessment based on the health indicator
To investigate the capability of SLSTP in assessing degradation of bearings, the SLSTP in SIOS is calculated as an indicator using the collected vibration signals in our investigation. According to the data sets, the sampling rate 20000 Hz. Moreover, the frequency grid is selected as [200 Hz, 300 Hz), which covers the BCFs of common defects, however the resolution of the FFT spectrum must meet the following condition:
Therefore, the sampling length is set as 214, and 20000/214 1.2207, which satisfies the above restriction.
In addition, the resolution of the frequency grid is assigned as 0.5 . The SLSTP of bearing 3 and bearing 4 in testing 1 are computed and plotted in Fig. 7 and Fig. 8, respectively. Meanwhile, the SLSTP of bearing 1 in testing 2 is presented in Fig. 9.
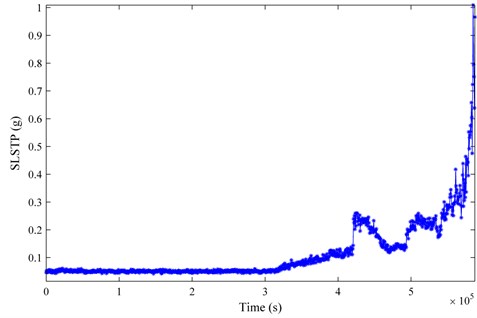
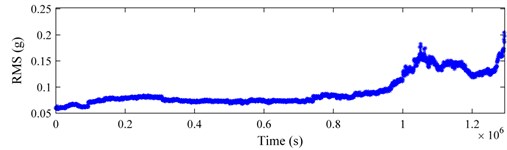
Intuitively, our proposed health monitoring indicator, SLSTP, shows a statistical monotonically increasing trend, which can track the degradation process of the bearing instantly. From Figs. 7-9, some remarks can be concluded that: (1) the proposed SLSTP can illustrate different health stage of bearings from health, early degradation, severe degradation to failure. Notably, the SLSTP increases as bearing performance degenerates continuously until failure; (2) a relative stable period of SLSTP is consumed so that the buffer time is sufficient for condition-based maintenance, which is pretty significant in PHM activities; (3) the proposed SLSTP is capable of prognosticating the weak or early anomaly of bearing and it is sensitive to fault development.
Fig. 7The SLSTP evolution of bearing 3 in testing 1
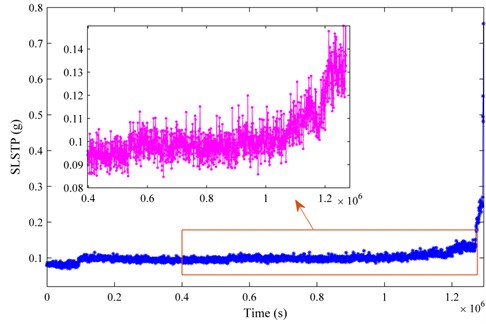
Fig. 8The SLSTP evolution of bearing 4 in testing 1
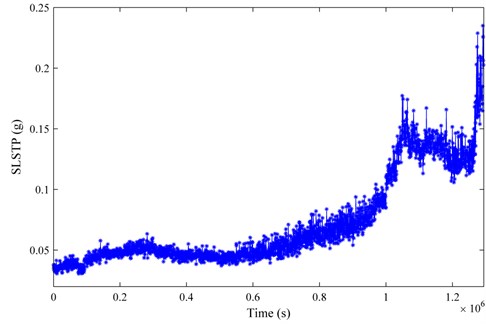
Fig. 9The SLSTP evolution of bearing 1 in testing 2
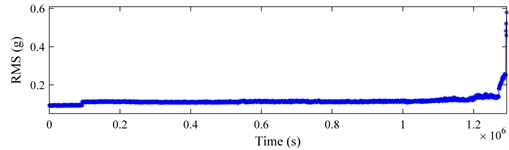
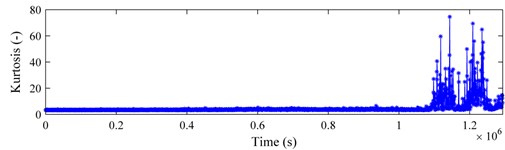
To depict the monotonic trend of the SLSTP and compare its performance, we draw a comparison between SLSTP and root mean square (RMS), and kurtosis in bearing health assessment. First, brief mathematical descriptions on these two time-domain indexes are given as follows. For a discrete signal with points, the RMS is defined as:
And the kurtosis is defined as:
where denotes the mean value of the discrete series.
Figs. 10-12 present the tracking curves of the aforementioned bearings by plotting RMS and kurtosis. Compared Figs. 10-12 with those derived previously, the SLSTP draws a better performance in tracing the changes of the health state of bearings, especially for the bearing 4 of testing 1 and the bearing 1 of testing 2. Therefore, the health indicator presented in this paper can highlight the bearing degradation behavior preferably and can be utilized for its health assessment.
Fig. 10Bearing 3 in testing 1: a) RMS curve; b) kurtosis curve
a)
b)
Fig. 11Bearing 4 in testing 1: a) RMS curve; b) kurtosis curve
a)
b)
Fig. 12Bearing 1 in testing 2: a) RMS curve; b) kurtosis curve
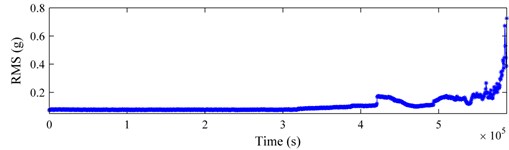
a)
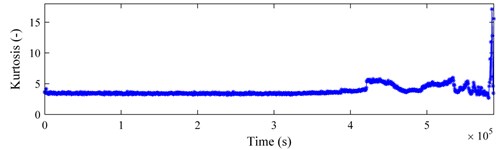
b)
4.2.2. Fault assessment with the average power of SIOS
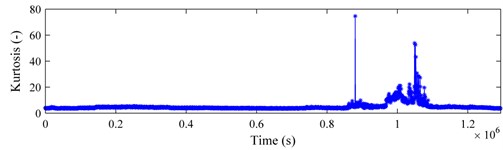
In order to demonstrate the ability of the proposed health monitoring method in fault detection, the vibration signals of bearing 1 in testing 2 is applied to further test our method. Three different-stage statuses shown in Fig. 13 corresponding to serious defect, early defect and weak defect (statuses A, B and C), are taken into consideration for fault detection analysis.
Fig. 13Three degeneration stages of bearing 1 in testing 2
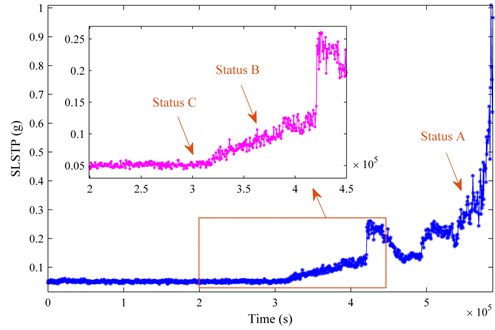
Examining the SLSTP degenerative process, we can observe that the degradation trend begins to be emerged by about the 500th record. Next the performances of our method in three health states are presented separately.
4.2.2.1. Bearing at serious defect stage (status A)
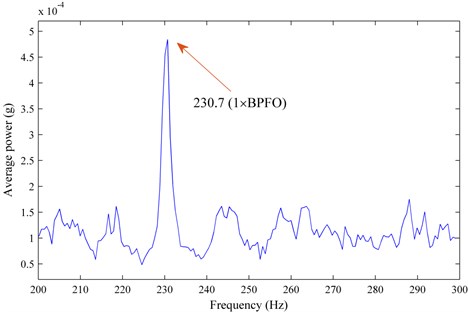
From the change trend of the proposed health indicator, the vibration data at serious defect stage (the 923rd record) is employed to analyze. Fig. 14 shows the vibration measurements of status A which was collected nearby the end of the bearing test and the corresponding spectrum generated with the proposed method is presented in Fig. 15. From the spectrum in Fig. 15, an obvious local peak related to the ball pass frequency on bearing outer race (BPFO) at 230.7 Hz is highlighted and detected, which illustrates that a local fault has existed in the outer ring of the monitored bearing. It is clear that the fault of bearing is detected successfully when serious defect appears.
Fig. 14The time waveform of the 923rd record at serious defect stage
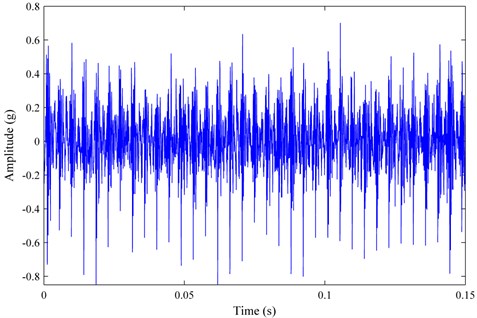
Fig. 15The spectrum of E(i)/(M-N(i)) versus Gi of the 923rd record
4.2.2.2. Bearing at early defect stage (status B)
Fig. 16 displays the vibration signals of status B (the 616th record) sampled near two more days before status A. From Fig. 16, the periodical impulses generated by the early fault could not be observed from the time-domain waveform due to the heavy background noise, which leads to a low signal-to-noise ratio. To investigate its performance in early fault diagnosis, the proposed diagnostic scheme is utilized to process the measured signals and the corresponding diagnostic spectrum is depicted in Fig. 17.
Fig. 16The time waveform of the 616th record at early defect stage
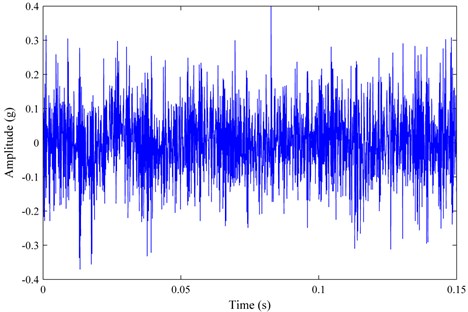
Fig. 17The spectrum of E(i)/(M-N(i)) versus Gi of the 616th record
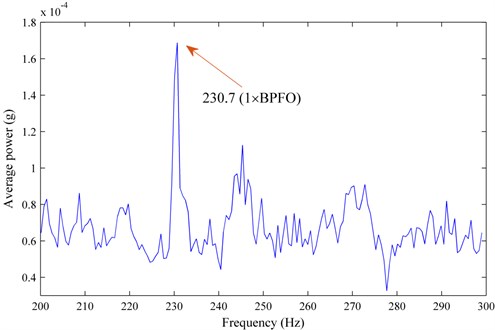
In spite of the low signal-to-noise ratio, a dominant peak at 230.7 Hz, which corresponds to BPFO, is also accentuated, thus bearing fault in this phase can be effectively diagnosed using our monitoring method as well. Therefore, the proposed monitoring methodology is suitable for bearing fault detection in early defect stage.
4.2.2.3. Bearing at weak defect stage (status C)
Here a more complicated monitoring time-point is considered, i.e. the weak defect stage. Examining the degradation curve shown in Fig. 13, the health index, SLSTP, begins into rising trend around 5000 minutes (namely about the 500th record). Hence, we take the 500th record as a representative at the weak defect stage. Compared with status A at the serious defect stage, the weak fault characteristics are almost totally inundated by the noise so that periodic characteristics cannot be intuitively observed in Fig. 18. After processing with the proposed method, we present the diagnostic result in Fig. 19.
Fig. 18The time waveform of the 500th record at weak defect stage
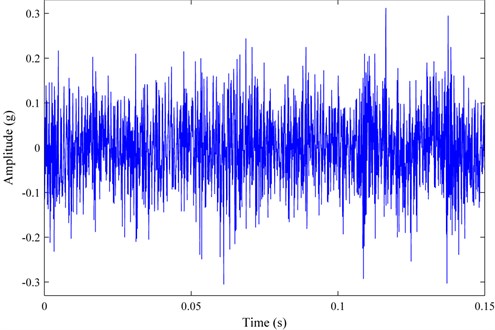
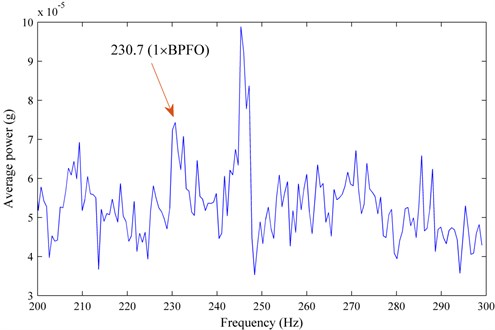
Although a local component round 247 Hz dominates the spectrum, the outer race fault frequency of the bearing as another dominant component is found at 230.7 Hz thanks to utilizing the average power of the SIOS, which is of great importance for fault warning in practical applications.
In this experimental case, vibration signals at three degeneration phases are employed to explain the effectiveness of the health monitoring scheme proposed in this study. All the presented monitoring and diagnostic results prove that it cannot only detect the fault at an early deteriorated phase, but also track the degenerative process of bearings.
Fig. 19The spectrum of E(i)/(M-N(i)) versus Gi of the 500th record
4.3. Results and discussion
The health statuses of bearing are monitored or tracked with indicators generated with energy variation in SIOS on a frequency grid in this research. Though vibration signals at a serious stage (e.g. status A in Fig. 13) exhibit evident periodicity, it is of great significance to detect the incipient defect at the early phase and perform an advanced fault warning in due time so that sufficient buffer time can be available for equipment maintenance. The proposed monitoring indicator, SLSTP, can provide degeneration or failure warning in real applications. As demonstrated by the results presented earlier, the SLSTP could commendably capture the variation trend of the condition characteristics for the health assessment of bearings (see Fig. 8 and Fig. 9). However, it shows a relatively poor performance in the tracing progress of bearing 3 in testing 1 (see Fig. 7). Since bearing faults occurred in two bearings at the end of the life experiment, the poor presentation may be caused by the rolling element fault in bearing 4, which installed on the same shaft with bearing 3. Fortunately, the degradation trend of bearing 3 could still exploited in its life cycle. Furthermore, the SLSTP is superior to time-domain indicators such as RMS and kurtosis so that it is more applicable to the health monitoring of bearings.
Moreover, in the early fault diagnosis, the outer-race fault of bearing can be detected after around 3.47 running days (the weak fault is diagnosed in the 500th data record) in bearing 1 of testing 2. By comparison, our health monitoring approach can highlight the fault signs earlier than the method demonstrated in [28], in which the fault detection is achieved after about 3.8 running days.
In addition, there still exist some recommended suggestions when applying the proposed health monitoring methodology. One thing is about the determination of the frequency grid, which is a critical parameter of the SIOS. Considered the failures of bearing commonly occurring in inner-race, outer-race, roller and cage, the frequency grid of SIOS can be determined by the range of the BCFs if the geometrical parameters of bearing are given. Otherwise the frequency grid could be selected as that of the original spectrum. In this case, all harmonics in the whole range are taken into consideration while constructing the SIOS. Another thing is about defined in inequality (1). This controlling parameter is introduced to effectively restrain the effect of noise for the searching algorithm. Since the harmonics of BCFs usually have relatively larger amplitudes especially in the resonance frequency band, a recommendation about the selection of is given as: make sure 0.5 %-2.1 % of amplitudes are searched as local peaks, which is also declared in [25].
5. Conclusions
A novel health monitoring approach for rolling element bearings is presented in this paper. The purpose of this investigation is to put forward an approach for bearing fault diagnosis and its health assessment so as to provide advanced anomaly warning during runtime. Firstly, the SIOS is constructed using a searching algorithm based on the FFT spectrum of the original vibration signals. Then the 2-D line plot of the frequency grid versus the average power in SIOS is employed to perform fault detection. Finally, a health index is computed as the summation of the largest six total-power of the predefined frequency grid in SIOS to assess the degradation severity. Simulation data and bearing life-test data are applied to validate the performance of the proposed monitoring scheme. It is shown that the proposed method could exhibit strong behaviors in detecting the weak local defect and tracing the degeneration process of rolling bearings.
Otherwise, the SLSTP seems a promising monitoring indicator for remaining useful life prediction of bearings, on which we will pay more attention in the future.
References
-
Liu X., Bo L., He X., Veidt M. Application of correlation matching for automatic bearing fault diagnosis. Journal of Sound and Vibration, Vol. 331, Issue 26, 2012, p. 5838-5852.
-
Zeng M., Yang Y., Luo S., Cheng J. One-class classification based on the convex hull for bearing fault detection. Mechanical Systems and Signal Processing, Vol. 81, 2016, p. 274-293.
-
Heng A., Zhang S., Tan A. C. C., Mathew J. Rotating machinery prognostics: state of the art, challenges and opportunities. Mechanical Systems and Signal Processing, Vol. 23, Issue 3, 2009, p. 724-739.
-
Lee J., Wu F., Zhao W., Ghaffari M., Liao L., Siegel D. Prognostics and health management design for rotary machinery systems – reviews, methodology and applications. Mechanical Systems and Signal Processing, Vol. 42, Issues 1-2, 2014, p. 314-334.
-
He W., Miao Q., Azarian M., Pecht M. Health monitoring of cooling fan bearings based on wavelet filter. Mechanical Systems and Signal Processing, Vol. 64, Issue 65, 2015, p. 149-161.
-
Prieto M. D., Cirrincione G., Espinosa A. G., Ortega J. A., Henao H. Bearing fault detection by a novel condition-monitoring scheme based on statistical-time features and neural networks. IEEE Transactions on Industrial Electronics, Vol. 60, Issue 8, 2013, p. 3398-3407.
-
Jin X., Sun Y., Shan J., Wang Y., Xu Z. Health monitoring and fault detection using wavelet packet technique and multivariate process control method. Prognostics and System Health Management Conference (PHM-2014 Hunan), 2014, p. 257-260.
-
Ben Ali J., Fnaiech N., Saidi L., Chebel-Morello B., Fnaiech F. Application of empirical mode decomposition and artificial neural network for automatic bearing fault diagnosis based on vibration signals. Applied Acoustics, Vol. 89, 2015, p. 16-27.
-
Widodo A., Yang B.-S. Support vector machine in machine condition monitoring and fault diagnosis. Mechanical Systems and Signal Processing, Vol. 21, Issue 6, 2007, p. 2560-2574.
-
Wong M. L. D., Jack L. B., Nandi A. K. Modified self-organising map for automated novelty detection applied to vibration signal monitoring. Mechanical Systems and Signal Processing, Vol. 20, Issue 3, 2006, p. 593-610.
-
Lei Y., He Z., Zi Y., Chen X. New clustering algorithm-based fault diagnosis using compensation distance evaluation technique. Mechanical Systems and Signal Processing, Vol. 22, Issue 2, 2008, p. 419-435.
-
Tabaszewski M. Optimization of a nearest neighbors classifier for diagnosis of condition of rolling bearings. Diagnostyka, Vol. 15, Issue 1, 2014, p. 37-42.
-
Strączkiewicz M., Czop P., Barszcz T. Supervised and unsupervised learning process in damage classification of rolling element bearings. Diagnostyka, Vol. 17, Issue 2, 2016, p. 71-80.
-
Sawalhi N., Randall R. B. Vibration response of spalled rolling element bearings: observations, simulations and signal processing techniques to track the spall size. Mechanical Systems and Signal Processing, Vol. 25, Issue 3, 2011, p. 846-870.
-
Abboud D., Antoni J., Eltabach M., Sieg-Zieba S. Angle\time cyclostationarity for the analysis of rolling element bearing vibrations. Measurement, Vol. 75, 2015, p. 29-39.
-
Figlus T., Stańczyk M. A method for detecting damage to rolling bearings in toothed gears of processing lines. Metalurgija, Vol. 55, Issue 1, 2016, p. 75-78.
-
Borghesani P., Pennacchi P., Randall R.B., Sawalhi N., Ricci R. Application of cepstrum pre-whitening for the diagnosis of bearing faults under variable speed conditions. Mechanical Systems and Signal Processing, Vol. 36, Issue 2, 2013, p. 370-384.
-
Kulkarni S., Bewoor A. Vibration based condition assessment of ball bearing with distributed defects. Journal of Measurements in Engineering, Vol. 4, Issue 2, 2016, p. 87-94.
-
Singh S., Howard C. Q., Hansen C. H. An extensive review of vibration modelling of rolling element bearings with localised and extended defects. Journal of Sound and Vibration, Vol. 357, 2015, p. 300-330.
-
McFadden P. D., Smith J. D. Model for the vibration produced by a single point defect in a rolling element bearing. Journal of Sound and Vibration, Vol. 96, Issue 1, 1984, p. 69-82.
-
Zhang Z., Wang Y., Wang K. Fault diagnosis and prognosis using wavelet packet decomposition, Fourier transform and artificial neural network. Journal of Intelligent Manufacturing, Vol. 24, Issue 6, 2013, p. 1213-1227.
-
Wentao S., Shazali O., Wilson W. An adaptive envelope spectrum technique for bearing fault detection. Measurement Science and Technology, Vol. 25, Issue 9, 2014, p. 095004.
-
Randall R.B., Antoni J. Rolling element bearing diagnostics – a tutorial. Mechanical Systems and Signal Processing, Vol. 25, Issue 2, 2011, p. 485-520.
-
Gebraeel N., Lawley M., Liu R., Parmeshwaran V. Residual life predictions from vibration-based degradation signals: a neural network approach. IEEE Transactions on Industrial Electronics, Vol. 51, Issue 3, 2004, p. 694-700.
-
Li, W., Qiu, M., Zhu, Z., Jiang, F., Zhou, G. Fault Diagnosis of Rolling Element Bearings with a Spectrum Searching Method. arXiv Preprint, 2015.
-
Wang D., Tse P. W., Tsui K. L. An enhanced Kurtogram method for fault diagnosis of rolling element bearings. Mechanical Systems and Signal Processing, Vol. 35, Issues 1-2, 2013, p. 176-199.
-
Lee J., Qiu H., Yu G., Lin J. Rexnord Technical Services. Bearing Data Set, IMS, University of Cincinnati, NASA Ames Prognostics Data Repository, 2007.
-
Zhang C., Li B., Chen B., Cao H., Zi Y., He Z. Weak fault signature extraction of rotating machinery using flexible analytic wavelet transform. Mechanical Systems and Signal Processing, Vol. 64, Issue 65, 2015, p. 162-187.
About this article

This work was supported by National Natural Science Foundation of China (51475455), Natural Science Foundation of Jiangsu (BK20141127), the Fundamental Research Funds for the Central Universities (2014Y05) and the Project Funded by the Priority Academic Program Development of Jiangsu Higher Education Institutions (PAPD). The authors would like to thank Intelligent Maintenance System, University of Cincinnati, USA, for sharing the bearing degradation data and appreciate the Editor and anonymous reviewers for their valuable comments and suggestions.
Mr. Qiu, Prof. Li and Prof. Zhu conceived and designed this research, as well as contributed to writing manuscript. Dr. Wu’s contributions include experimental designs and analysis. Prof. Zhou was responsible for editing manuscript. All authors read and approved the manuscript.
