Abstract
Fretting fatigue is most likely to occur in the dovetail joint of aero engine compressor resulting in small amplitude displacement of a few micrometers. This leads to degradation of the material in the form of fatigue strength and corrosion. This paper reports optimal conditions of blade geometrical parameters such as flank length, flank angle and coefficient of friction in order minimize the failure due to fretting fatigue. ANOVA indicated that Von-mises stresses, deformation, contact pressure and sliding distance were influenced by coefficient of friction and flank angle. While deformation, contact pressure and sliding distance decreased with increase in coefficient of friction and increased with increase in flank angle and flank length. Von-mises stress increased with increase in coefficient of friction. Response surface methodology results indicated that the optimum value of Von-mises stress (328.24 MPa), deformation (153.87 µm), contact pressure (275.48 MPa) and sliding distance (80.66 µm) were found at coefficient of friction 0.35, flank angle 65° and flank length of 12 mm which were in agreement with those of grey relational analysis results.
1. Introduction
Aeroengine compressor rotates at very high speed of 10000-17000 rpm and induces high centrifugal stresses [1]. A typical compressor disc is subjected to centrifugal, bending and thermal loads [2]. One of the weakest parts of aeroengine compressor is the dovetail joint between a rotor disc and compressor blade. Due to the complexity of loading and interaction between two surfaces in dovetail joint, high stresses are induced which leads to crack and subsequent failure due to fretting fatigue phenomenon. Fretting fatigue describes the situation where slip between the two contact surfaces is present at the micron level [3]. Eden et al. [4] were the first to identify the fretting fatigue between two contact surfaces of the specimen. They found the layer of oxide formation in the areas contacting the grip of the test machine. Papanikos et al. reported that coefficient of friction, flank angle and flank length influenced the maximum stress concentration below the lower contact point of the blade and disc interface. Nandish et al. carried out contact stress analysis of the dovetail attachment with and without friction along the contact length using theoretical and finite element formulation for IMI685 material. It was concluded that the contact stress was maximum in the lower point of contact region due to the contribution of the bending stresses. Hammouda et al. analyzed the macro mechanics behavior of the fretted surfaces in dovetail joints in aero engine compressors using two dimensional elasto-plastic finite element analysis. As a result of a study the edges of the common surfaces nearest of the dovetail notch base found as the sites of the initiation of fatigue failure. Tiago et al. [5] analyzed the hexa multi and tetra elements to carry out a comparative study on normalized maximum stress in ANSYS tool. Maximum stress was found in hexamulti 1 mm element across the thickness in frictionless condition. Malay et al. [6] investigated variation of stresses and crack growth assessment in the dovetail joint of compressor disc. It was observed that SIF (Stress Intensity Factor) and crack growth rate increased with increase in crack length. Witek [7] investigated finite element numerical analysis of the turbine casing of an aero engine to present stress and deformation contour considering both mechanical and thermal loads. It was concluded that the stress at first fatigue crack zone called critical zone, was 180-190 MPa. Also, thermal stresses were two times larger than mechanical stresses. Anandavel et al. [8] reported that skew angle dovetail slot subjected to blade airfoil loading increased the peak contact pressure, stresses and slip when compared to a straight dovetail slot.
Hammouda et al. [9] analyzed the macro mechanics behavior of the fretted surfaces in dovetail joints in aero engine compressors using two dimensional elasto-plastic finite element analysis. The authors reported that edges of the surfaces nearest to the dovetail notch base was found as the fretting failure initiation sites. Jabbar et al. [10] analyzed the first stage rotor blade of gas turbine made from titanium alloy, stainless steel and aluminum alloy for structural and thermal loads. The maximum temperature was found at blade tip section and fundamental frequency of titanium alloy was found to be 35 Hz which was highest as compared to all other materials. Kotresh et al. [11] investigated aero engine dovetail blade disc joints by finite element simulation methods for fretting fatigue responses for dovetail model of different thicknesses and skew angles. The peak stresses observed at the bottom of blade surfaces and these values decreased along the flank length, and also skew effect increases stress values.
From the review of literature, it was found that the researchers have adopted experimental, numerical and analytical methods for analyzing the failure stresses and fracture of dovetail joint at blade disc interface. The dynamic nature of blade disc parameters selected for a single fretting fatigue objective deteriorates the other, results in conflicting objectives. This presents a challenge for the optimization problem, since the parameter settings (decision variables) selected for given multiple choices may be in conflict with each other. Hence this paper investigates the effect of blade disc geometrical parameters such as flank angle, flank length and coefficient of friction on fretting fatigue responses such as Von-Mises stress, deformation, contact pressure and sliding distance adopting Taguchi’s orthogonal array technique. Grey relational analysis (GRA) and response surface methodology (RSM) was adopted to identify the optimum settings of the blade parameters in order to minimise the effect of fretting fatigue. The confirmatory tests were performed to confirm the optimal parametric combination.
2. Static structural analysis of dovetail joint
2.1. Selection of material for compressor disc/blade
Titanium alloy (Ti-6Al-4V) [4] was selected since it had high tensile strength and high fatigue strength at extreme temperatures. The properties are as shown in Table 1.
Table 1Material properties of Ti-6Al-4V [4]
Material properties | Values |
Young’s modulus | 114 GPa |
Poisson’s ratio | 0.33 |
Density | 4429 kg/m3 |
Tensile yield strength | 930 MPa |
Tensile ultimate strength | 1070 Pa |
2.2. Contact and target
Contact and target surfaces are generated if two bodies are not attached to each other but still transmit forces. Since Aeroengine blade is press fitted in the disc, surface to surface contact was adopted. The blade surface was modeled as a contact surface with element CONTA174 and disc surface with the target element TARGE170.
2.3. Formulation
Augmented Lagrange was adopted to represent nonlinear contact between the two bodies. The contact pressure () was calculated using Eq. (1) [12]:
As shown in Fig. 1, contact stiffness was directly related to the penetration (). Due to extra term , the normal force is less sensitive to the contact stiffness (). In interface treatment, initial contact behavior was defined as offset or adjust to touch [12]. Adjust to touch (Fig. 2) determines the contact offset necessary for closing the gap and establish initial contact.
Fig. 1Augmented Lagrange formulation [12]
![Augmented Lagrange formulation [12]](https://static-01.extrica.com/articles/18270/18270-img1.jpg)
Fig. 2Interface treatment [12]
![Interface treatment [12]](https://static-01.extrica.com/articles/18270/18270-img2.jpg)
2.4. Update stiffness
To update the stiffness after each equilibrium iteration, the contact input “update stiffness” at “each iteration”, was set in the ANSYS code. This option was adopted to achieve better results without the use of normal stiffness factor [12].
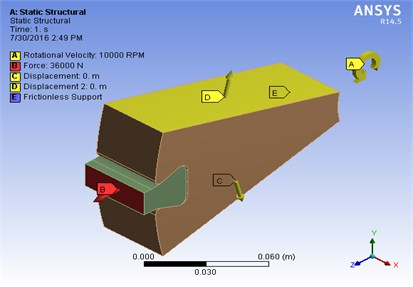
Fig. 3a) Meshed model, b) boundary conditions
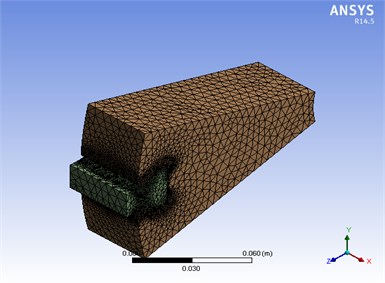
a)
b)
In the present study straight dovetail joint and compressor disc with twelve blades were considered. Solid modelling of the blade root and compressor disc was carried out in CATIA V5R19 as per the geometry described by [1, 5]. In the view of symmetry only 1/12th part of the blade/disk modeled to save computational time as shown in Fig. 3(a). In order to analyse the model using ANSYS workbench 14.5 nonlinear static structural analysis was performed. 10 node, SOLID 187 elements was selected for analysis. Centrifugal force was taken into account at 10000 RPM as shown in Fig. 3(b) [3].
From nonlinear static structural analysis fretting fatigue responses variables have been such as von-Mises stress, deformation, contact pressure and sliding distance were recorded.
Table 2L16 orthogonal array with responses
COF | Flank angle (deg) | Flank length (mm) | Von-Mises stress (MPa) | Deformation (μm) | Contact pressure (MPa) | Sliding distance (μm) |
0.1 | 64 | 12 | 340.24 | 175.85 | 347.41 | 99.53 |
0.1 | 66 | 12 | 343.22 | 180.81 | 369.83 | 106.29 |
0.1 | 68 | 14 | 340.82 | 190.84 | 415.46 | 115.74 |
0.1 | 70 | 14 | 363.81 | 207.52 | 456.64 | 131.23 |
0.2 | 64 | 12 | 323.07 | 165.79 | 310.05 | 92.82 |
0.2 | 66 | 12 | 330.47 | 168.21 | 306.56 | 89.62 |
0.2 | 68 | 14 | 329.96 | 175.05 | 355.75 | 100.68 |
0.2 | 70 | 14 | 355.86 | 186.48 | 386.06 | 113.25 |
0.3 | 64 | 14 | 334.27 | 157.41 | 277.65 | 83.67 |
0.3 | 66 | 14 | 323.71 | 158.46 | 292.29 | 86.22 |
0.3 | 68 | 12 | 329.10 | 163.03 | 314.81 | 91.00 |
0.3 | 70 | 12 | 343.12 | 173.43 | 334.21 | 101.77 |
0.4 | 64 | 14 | 342.40 | 150.62 | 252.42 | 77.19 |
0.4 | 66 | 14 | 337.55 | 151.01 | 266.74 | 80.15 |
0.4 | 68 | 12 | 341.57 | 154.05 | 285.46 | 83.42 |
0.4 | 70 | 12 | 350.48 | 162.76 | 297.89 | 92.41 |
3. Design of simulation runs by Taguchi method
Three geometrical parameters such as coefficient of friction, flank angle and flank length were considered as input factors. Coefficient of friction for Ti-6Al-4V was varied from 0.1 to 0.4 during the fretting fatigue life of the component at room temperature [4]. Flank angle of the dovetail joint was varied from 64° to 70°. Decreasing the flank angle below 64° resulted in distortion of the geometry and increase in flank angle above 70° lead to a new stress point. Flank length of the dovetail joint was selected on the basis of feasible geometry suitable with other parameters. Based on the selected levels and factors, orthogonal array was adopted to perform the simulation runs which is shown along with measured fretting fatigue responses in the Table 2.
4. ANOVA (analysis of variance) of fretting fatigue responses
ANOVA was performed to identify the most significant blade geometrical factors that affect fretting fatigue responses, by considering pooled sum of errors at 95 % confidence level. The assessment was made based on F and p distributions as shown in Table 3.
Table 3ANOVA for fretting fatigue responses
Factor | Von mises stress | Deformation | Contact Pressure | Sliding Distance | ||||||
COF | 3 | 7.21 | 0.012 | 132.1 | 0.002 | 157.58 | 0.00 | 103.4 | 0.000 | 2.64 |
Flank angle | 3 | 13.59 | 0.002 | 49.56 | 0.001 | 61.4 | 0.00 | 58.04 | 0.000 | 2.64 |
Flank length | 1 | 1.79 | 0.218 | 10.65 | 0.01 | 16.8 | 0.003 | 9.6 | 0.015 | 2.64 |
Error | 8 | |||||||||
Total | 15 | |||||||||
5. Grey relational analysis (GRA) of measured fretting fatigue responses
GRA was adopted to measure the degree of relationship amongst multiple performance characteristics such as Von mises stresses, deformation, contact pressure and sliding distance, on the basis of gray relational grades. Grey relational analysis started with the normalizing the raw data withdrawn from analysis. The data was normalized to convert the performance characteristics from zero to unity range. The normalized results for ‘smaller the better’ can be expressed by Eq. (2). Grey relational coefficients are computed using Eq. (3):
where is the sequences after data preprocessing, is original data sequence:
where is distinguishing coefficient: 01, this study value is taken as 0.5. is smallest value of , is largest value of .
The average of the gray relation coefficients is used as gray relation grade. The gray relation coefficients, gray relation grade and order for the responses are shown in Table 4.
Table 4Grey relational coefficient and grey relational grade
Trial no | Orthogonal array | Grey relation coefficient | Grade | Rank | |||||
COF | Flank angle | Flank length | |||||||
1 | 0.1 | 64 | 12 | 0.543 | 0.530 | 0.518 | 0.547 | 0.535 | 11 |
2 | 0.1 | 66 | 12 | 0.503 | 0.485 | 0.465 | 0.482 | 0.484 | 13 |
3 | 0.1 | 68 | 14 | 0.534 | 0.414 | 0.385 | 0.412 | 0.436 | 14 |
4 | 0.1 | 70 | 14 | 0.333 | 0.333 | 0.333 | 0.333 | 0.333 | 16 |
5 | 0.2 | 64 | 12 | 1.000 | 0.652 | 0.639 | 0.634 | 0.731 | 6 |
6 | 0.2 | 66 | 12 | 0.733 | 0.618 | 0.653 | 0.685 | 0.672 | 8 |
7 | 0.2 | 68 | 14 | 0.747 | 0.538 | 0.497 | 0.535 | 0.579 | 10 |
8 | 0.2 | 70 | 14 | 0.383 | 0.442 | 0.433 | 0.428 | 0.422 | 15 |
9 | 0.3 | 64 | 14 | 0.645 | 0.807 | 0.802 | 0.807 | 0.765 | 4 |
10 | 0.3 | 66 | 14 | 0.969 | 0.784 | 0.719 | 0.750 | 0.806 | 3 |
11 | 0.3 | 68 | 12 | 0.772 | 0.696 | 0.621 | 0.662 | 0.688 | 7 |
12 | 0.3 | 70 | 12 | 0.504 | 0.555 | 0.555 | 0.524 | 0.534 | 12 |
13 | 0.4 | 64 | 14 | 0.513 | 1.000 | 1.000 | 1.000 | 0.878 | 1 |
14 | 0.4 | 66 | 14 | 0.584 | 0.986 | 0.877 | 0.901 | 0.837 | 2 |
15 | 0.4 | 68 | 12 | 0.524 | 0.893 | 0.756 | 0.813 | 0.746 | 5 |
16 | 0.4 | 70 | 12 | 0.426 | 0.701 | 0.692 | 0.640 | 0.615 | 9 |
6. Response surface methodology (RSM)
The relationship between the fretting fatigue parameters and the responses was modeled using RSM. The general first order RSM model used to predict the influence of fretting fatigue parameters on the response factor is given by Eq. (4):
where is the response factor and are the values of th observation and th level of the parameters. The terms are the regression coefficients. The Response Surface representing the fretting fatigue responses such as Von-mises stress, deformation, contact pressure and sliding distance in terms of geometrical parameters such as coefficient of friction (), flank angle () and flank length () along with -squared value is given in Eq. (5-8):
7. Results and discussion
7.1. Influence of blade parameters on contact pressure
Contact pressure decreased with increase in coefficient of friction (COF) from 0.1 to 0.4 and increased with increase in flank angle from 64° to 70° and flank length from 12 mm to 14 mm as predicted from the main effects plot as shown in the Fig. 4. With the existence of finite friction between contact regions, the contact normal stress was related to coefficient of friction and flank angle as given by Eq. (9) [2]:
Fig. 4Main effect plot for contact pressure
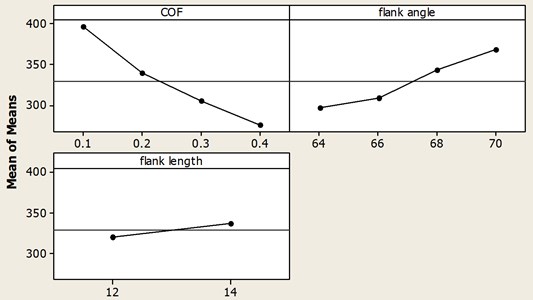
Fig. 5RSM optimization plot to minimize contact pressure
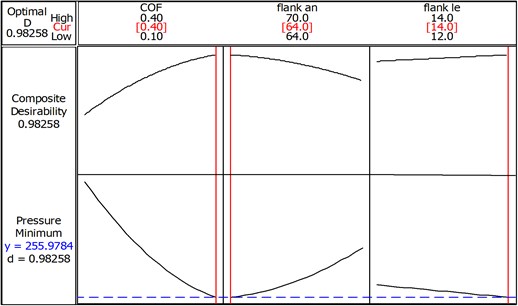
As per ANOVA for contact pressure (Table 3), COF and Flank angle was found to be the most influencing factors since calculated () value was greater than tabulated () value. Response Surface Methodology optimization plot indicated the minimum value of contact pressure as 255.97 MPa at optimum blade parameter settings of coefficient of friction 0.40, flank angle 64° and flank length 14 mm, as shown in Fig. 5.
7.2. Influence of blade parameters on sliding distance
Sliding distance decreased with increase in coefficient of friction (COF) from 0.1 to 0.4. Also, sliding distance increased with flank angle from 64° to 70° as well as flank length from 12mm to 14 mm as shown in Fig. 6. Since friction offers resistance to the motion, variation of the sliding distance can be defined by the Eq. (10) [2]:
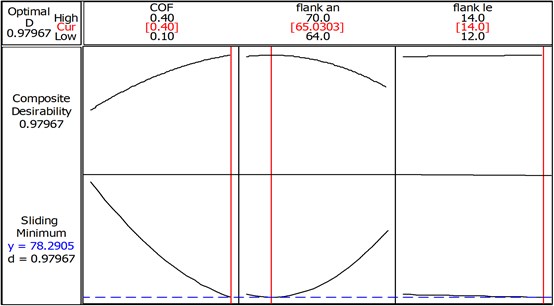
where, is the contact stress, given in Eq. (9). As per ANOVA of sliding distance, COF and flank angle was found to be the most influencing factors because of the higher F-calculated values as 103.4 and 58.0 respectively as compared to F tabulated values. From the RSM optimization plot as shown in the Fig. 7, the minimum value of sliding distance was found to be 78.29 µm at optimum parameter settings of the coefficient of friction 0.40, flank angle 65° and flank length 14 mm.
Fig. 6Main effects plot for sliding distance
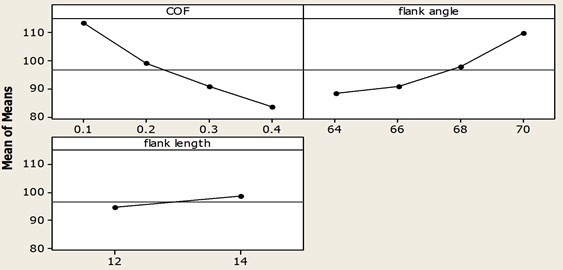
Fig. 7Optimum level to minimize sliding distance
7.3. Influence of blade parameters on Von-Mises stress
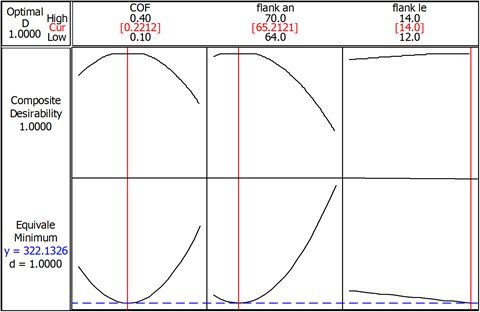
Initially, Von mises stresses decreased with increase in coefficient of friction (COF) from 0.1 to 0.3 then it increased with increase in COF from 0.3 to 0.4 as shown in Fig. 8. Also, Von-Mises stresses increased with increase in flank angle from 64° to 70° and flank length 12 mm to 14 mm. As per the ANOVA of Von-Mises stress, -calculated value was found to be greater than -tabulated value for COF and flank angle. COF and flank angle were found to be the most influencing factors because of the higher -calculated values as 7.2 and 13.5 respectively. From the RSM optimization plot the minimum value of von-Mises stress was found to be 322.13 MPa at optimum parameter setting of the coefficient of friction 0.22, flank angle 65° and flank length 14 mm, as shown in Fig. 9.
Fig. 8Main effect plot for Von-Mises stress
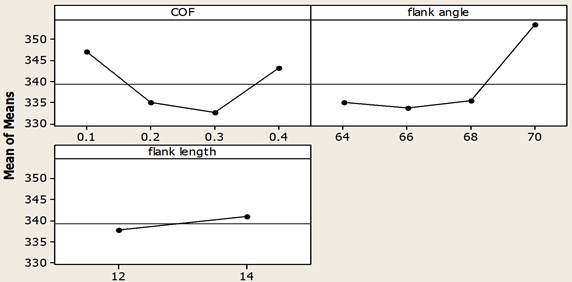
Fig. 9Optimum level to minimize Von-Mises stress
7.4. Influence of blade parameters on deformation
Decrease in deformation resulted an increase in coefficient of friction (COF) from 0.1 to 0.4. Deformation also increased with the increase in flank angle from 64° to 70° and flank length from 12 mm to 14 mm as shown in Fig. 10. As per the ANOVA of deformation, COF and Flank angle was found to be the most influencing factors because of the higher F-calculated values as 132.1 and 49.5 respectively as compared to flank length. As a result of individual optimization plot the minimum value of deformation was found to be 150.0 µm at optimum parameter setting of the coefficient of friction 0.40, flank angle 65° and flank length 14 mm, as shown in Fig. 11.
7.5. Confirmatory test of optimized results
Comparison between the output of the response optimizer (Minitab) and finite element analysis at a geometrical parametric setting of COF 0.35, flank angle 65° and flank length of 12 mm has been shown in Table 5. It can be observed that the calculated values of the optimization process and observed values of finite element analysis are approximately close with very low percentage of error.
Fig. 10Main effect plot for deformation
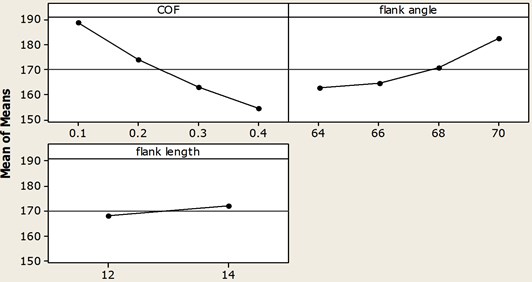
Fig. 11Optimum level to minimize deformation
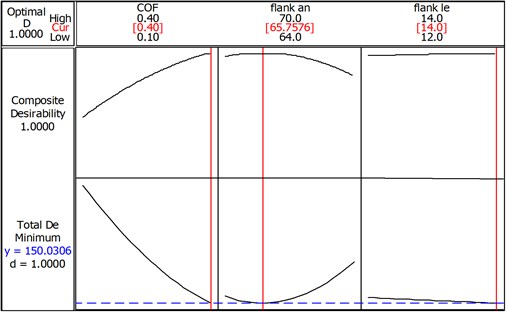
Table 5Comparison between output of response optimizer and finite element analysis
Response | Results (response optimizer) | Results (FEA) | Error % |
Von-Mises stress (MPa) | 328.24 | 347.98 | 5.6 |
Deformation (µm) | 153.87 | 152.72 | 0.7 |
Contact pressure (MPa) | 275.48 | 272.02 | 1.3 |
Sliding distance (µm) | 80.66 | 80.429 | 0.3 |
8. Conclusions
In the present research, nonlinear static structural analysis was carried out to examine the effect of geometrical parameters such as coefficient of friction, flank angle and flank length on fretting fatigue responses such as von-Mises stress, deformation, contact pressure and sliding distance. Based on ANOVA, fretting fatigue responses are highly influenced by coefficient of friction and flank angle whereas flank length had negligible impact on the quality characteristics. Also, contact pressure, sliding distance and deformation decreased with increase in coefficient of friction from 0.1 to 0.4 and increased with increase in flank angle from 64° to 70° and flank length from 12 mm to 14 mm. Von-mises stress decreased with increase in coefficient of friction from 0.1 to 0.3 then increased with increase in coefficient of friction from 0.3 to 0.4. The multi-objective optimization of responses showed the optimum setting at COF 0.35, flank angle 65° and flank length of 12 mm in order to achieve minimum Von-mises stress, deformation, contact pressure and sliding distance as 328.24 MPa, 153.87 µm, 275.48 MPa and 80.66 µm respectively.
References
-
Papanikos P., Meguid S. A., Stjepanovic Z. Three dimensional nonlinear finite element analysis of dovetail joint in Aeroengine discs. Finite Element in Analysis and Design, Vol. 29, 1998, p. 173-186.
-
Nandish R. V., Paul Vizhian S., Gopinath M., Rajeev Jain Elastic contact stress analysis of dovetail attachment in turbine engines. International Journal of Research in Mechanical Engineering and Technology, Vol. 3, 2013, p. 166-170.
-
Hammouda M. M. I., Fayed A. S. Finite element simulation of the mechanics of flat contact pad fretting fatigue tests. Fatigue & Fracture of Engineering Materials & Structures, Vol. 26, 2003, p. 1-13.
-
Eden E. M., Rose W. N. The endurance of metals. Proceeding of the Institute for Mechanical Engineers, Vol. 81, Issue 1, 1911, p. 839-974.
-
Tiago de oliveira Vale, Gustavo da Costa villar, Joao Carlos Menezes Methodology for structural integrity analysis of gas turbine blade. Journal of Aerospace Technology and Management, Vol. 4, 2012, p. 55-59.
-
Malay Kumar Kheto, Mahendra Babu N. C., MadanJ. Fretting fatigue analysis in dovetail joint of compressor though numerical simulation. SASTech Journal, Vol. 8, 2009, p. 71-76.
-
Witek L. Numerical simulation of fatigue fracture of the turbine disc. Fatigue of Aircraft Structure, Vol. 2012, 2012, p. 114-122.
-
Anandavel K., Prakash R. V. Effect of three-dimensional loading on macroscopic fretting aspects of an aero-engine blade-disc dovetail interface. Tribology International, Vol. 44, 1544, p. 1555-2011.
-
Hammouda M. M. I., Fayed A. S. Numerical Approach to the Mechanics of Disc-Blade Dovetail Joints in Aero-Engine Compressors. Materials Engineering Department, Zagazig University, Egypt, 2005, p. 20-25.
-
Jabbar A. A., Rai A. K., Reedy P. R., Dakhil M. H. Design and analysis of gas turbine rotor blade using finite element method. International Journal of Mechanical and Production Engineering Research and Development, Vol. 4, p. 73-94, 2014.
-
Kotresh M., Srihari P. V., Ramachandra K. Fretting fatigue studies of aero engine dovetail roots using contact analysis. International Conference on Computer Aided Engineering CAE, IIT Madras India, 2013, p. 93-98.
-
ANSYS R14.5. Academic, Structural analysis Guide manual, 2014.
About this article

