Abstract
Contact element methods have been widely used in the field of bridge poundings in recent years. For deck-pier poundings of girder bridges, two kinds of contact element methods are commonly used. One is the Lumped Parameter Method (LPM), which simplifies two pounding bodies to be two particles respectively, and the stress wave propagation phenomenon is disregarded. The other one is the Watanabe and Kawashima Method (WKM), whose weakness is that the pounding stiffness introduced to describe the pounding process is supposed and artificial. A new method, named as the Partial Lumped Mass Method (PLMM), was put forward for longitudinal deck-pier poundings of girder bridges and was introduced in this paper. Its applications were discussed in detail at first. Pounding force time histories with different Partial Lumped Factors were derived. The Rational Partial Lumped Factor was suggested theoretically. At last, the analysis results using the PLMM with different Partial Lumped Factors were compared, and the validity of the PLMM suggested in this paper was verified with shaking table test results.
1. Introduction
Pounding is a kind of impact effect, and most poundings of bridges last for a very short moment and are accompanied with a huge force between pounding interfaces. At the same time, a mechanical energy would exchange between two pounding bodies. Many damages caused by poundings have been observed and investigated. And most researches are focused on coaxial poundings between two decks, which are very common phenomena of bridge poundings [1-4].
And in the 2008 Wenchuan earthquake, many expansion joints were damaged by deck-abutment poundings, too [5]. Studies on deck-abutment poundings were involved in some papers. Wang and Shih [6] found that the frictional sliding on bearing pads and plastic deformation in backfill soils was essential for preventing from a deck fall-off disaster during large earthquakes. Ruangrassamee and Kawashima, Won et al. studied the effectiveness of dampers and restrainers on the pounding effects [7, 8]. Dimitrakopoulos investigated the seismic response of short skew bridges with deck-abutment pounding joints and some conclusions about transverse displacements and rotations were drawn [9]. Li and Bi evaluated the influence of abutment excitations on the pounding behaviour of a bridge using three shake tables [10]. The excitations were applied in the longitudinal direction of the bridge span and the spatially varying ground excitations were also simulated.
In addition, deck-pier poundings have also been observed in some earthquakes. In the 1989 Loma Prieta earthquake, poundings between lower decks and piers supporting upper decks of the China Basin viaduct led to a considerable damage because the reserved space of 150mm is not large enough [11]. In the 1994 Northridge earthquake, many piers and expansion joints were damaged badly by poundings at the interstate 5 and State Road 14 interchange [12]. However, there were few researches on the deck-pier pounding issue, and more attention should be paid on it.
It has recently become a hot spot of research for several years to express the pounding process accurately and clearly. Several methods have been suggested for estimating the pounding effects, which can be generally classified into two categories, viz. stereo mechanical methods and contact element methods. And the contact element methods have been usually used because they are suitable for the finite element analysis [13, 14].
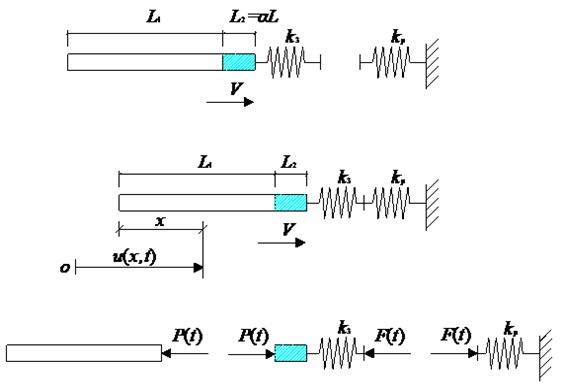
Two kinds of contact element methods can be used for the deck-pier pounding issue as shown in Fig. 1(a), and is the horizontal stiffness of the pier. The first One is the Lumped Parameter Method (LPM), which tries to express the pounding with an impact oscillator [15]. As shown in Fig. 1(b), the deck is simplified to a particle, and the pounding stiffness is the axial stiffness of the deck. The method is very simple and able to describe the pounding process with finite element methods. However, the dynamic characteristics of pounding bodies are changed a lot, and the accuracy for simulation of complicated bridges is affected. Besides, the method can’t describe the motion behavior and the stress state along the deck.
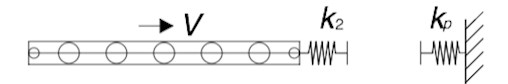
To describe the pounding process accurately, more degrees of freedom have to be considered, such as in the Watanabe & Kawashima Method (WKM) shown in Fig. 1(c) [16]. The deck is meshed in the finite element model and is simulated as several particles connected with springs in series. A gap element is used to simulate the pounding between the deck and pier, and its stiffness is suggested to equal to the axial stiffness of the springs connecting the particles. With the method, the dynamic characteristics of the pounding bodies are unchanged. The main shortcoming of WKM is that the stiffness has no clear and definite meaning.
To overcome the aforementioned shortcomings, a new method, named as the Partial Lumped Mass Method (PLMM), is proposed in this paper and is used to simulate longitudinal deck-pier poundings of girder bridges. The method is put forward based on the thought that only a partial segment of the deck is directly influenced by the pounding and can be simplified to a combination of a particle and spring, as shown in Fig. 1(d). The mass of the partial segment is lumped on the particle, and the stiffness of the spring is the axial stiffness of the partial segment, so the stiffness has a clear and definite meaning. In addition, only a partial segment is simplified, and the most part are not simplified, so the majority of dynamic characteristics of the deck is maintained.
Fig. 1Deck-pier pounding methods
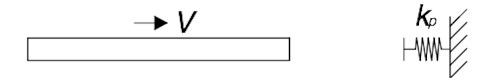
a) The deck-pier pounding
b) The LPM
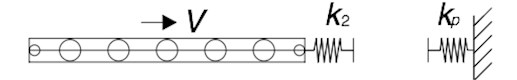
c) The WKM
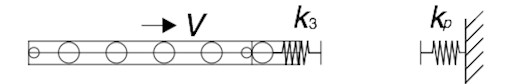
d) The PLMM
In this paper, the PLMM was introduced and studied in detail at first. Then the rational Partial Lumped Factor was suggested theoretically. Analysis results using the PLMM with different Partial Lumped Factors were compared, and the validity of the PLMM suggested in this paper was verified with shaking table test results at last.
2. PLMM introduction
In the PLMM, a partial segment of the deck directly influenced by the pounding is simplified to a combination of a particle and spring. The mass ratio of a partial segment to the total mass of the deck is named as the Partial Lumped Factor and is denoted by . For a deck with the constant cross section, equals the length ratio of the partial segment to the total length. As shown in Fig. 2. and the spring stiffness is . Then, the series stiffness is .
Except the partial segment, the rest of the deck can be simulated as a continuum model as shown in Fig. 2, or a discrete model, such as several particles connected with springs in series as shown in Fig. 1(d).
Fig. 2PLMM with rest of deck simulated as continuum model
In this section, the time history of the theoretical pounding force of the deck-pier pounding is deduced. Meanings of parameters in this section are as follows:
is the Partial Lumped Factor;
, , , are the elastic modulus, cross section area, density and initial deck velocity, respectively;
is the mass of the partial deck segment, and ;
is the ratio of the pounding stiffness to the horizontal pier stiffness, and . Then .
is the displacement time history of the particle which is at a distance of from the non-pounding end of the girder. According to the one-dimensional wave theory, [17]. and are displacement waves propagating in the positive and negative directions, respectively. and are the first order derivatives of and . is the propagation velocity of the displacement wave.
is the dimensionless time, and ;
is the force time history between the rest of the deck and the particle, and that is the force time history at the location of ;
is the pounding force time history;
is the dimensionless pounding force time history and equals the ratio of to the theoretical pounding force, and that is .
For the rest of the deck, initial conditions of the velocity and strain at 0 can be expressed as:
According to the boundary condition that the strain is zero at the non-pounding end, we have:
According to the boundary condition that the strain is at , we have:
According to the one-dimensional wave theory and the assumption that is small enough, the wave propagation expressed according to Eqs. (2) and (3) can be shown in Fig. 3.
Fig. 3Wave propagation along rest of deck
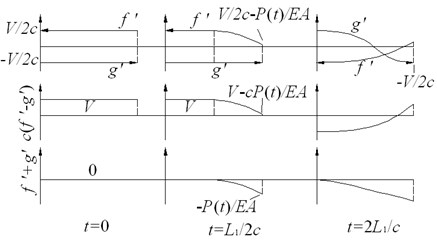
For , the velocity time history of the rest of the deck at the location of can be expressed as:
The velocity time history of the particle is given by:
According to Eqs. (4) and (5), a second-order differential equation of at the location of is derived:
Then the characteristic equation is:
General solutions of Eq. (6) include three situations:
If , the characteristic roots are , and the general solution is:
If 3, the characteristic roots are , and the general solution is:
If , the characteristic roots are , and the general solution is:
According to the initial conditions 0 and , constants in Eqs. (9) to (11) can be obtained, and the displacement time history of the particle is obtained.
If :
If 3:
If :
Then the pounding force time history can be written as:
According to the definitions of and , dimensionless pounding force time histories can be obtained.
If :
If 3:
If :
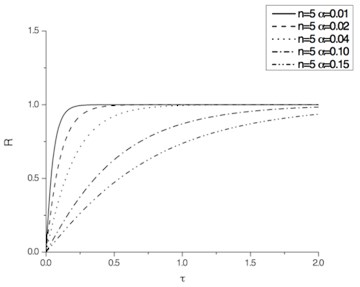
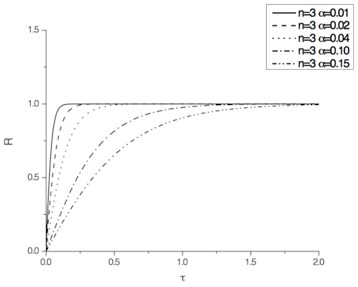
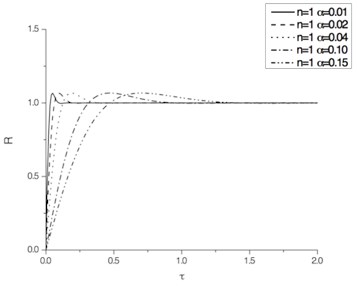
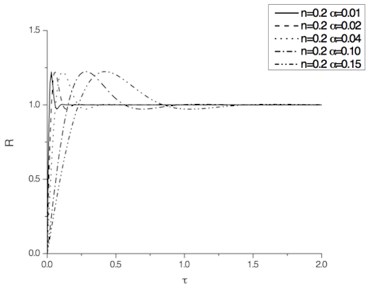
The dimensionless pounding force time histories calculated with Eqs. (13) to (15) are shown in Fig. 4.
As shown, for , the peak value of is larger than 1. The less is , the larger is the peak value of . For or 3, the peak value of is less than 1 and approaches it.
3. Experimental study of deck-pier pounding
Shaking table test was conducted in the State Key Laboratory of Disaster Reduction in Civil Engineering, Tongji University to verify the PLMM for the deck-pier pounding issue. In the test, a simply supported bridge was used as the test specimen. The bridge consists of two piers, four bearings and a deck with an additional mass as shown in Fig. 5. The two piers, named as Pier 1 and 2, were fixed on two shaking tables, which were used to simulate ground motions during earthquakes. The additional mass bolted on the deck was 100 tons.
The configuration of an FPS bearing on Pier 1 is shown in Fig. 6. Steel blocks were installed on the connection plates of the bearing. A certain horizontal distance was designed between the steel block and the side of the upper bearing plate, which was named as the Clearance in this paper.
The El-Centro ground motion as shown in Fig. 7 was selected in the test. Peak acceleration of the record was scaled to 0.143 g.
Bridge responses were measured with a sampling frequency of 512 Hz. Four load transducers were placed on the two piers to measure the pounding force. Bearing displacements were measured by four displacement transducers, and accelerations of the tables, decks and piers were measured by 21 accelerometers. In Fig. 8, the displacement time history, force time history and hysteresis curve of an FPS bearing on Pier 1 are shown.
Fig. 4Pounding force time histories
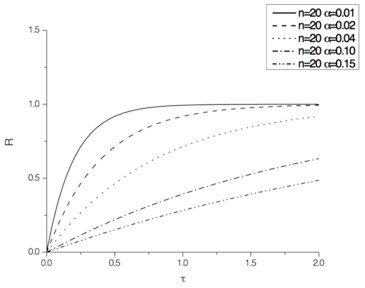
a) 20
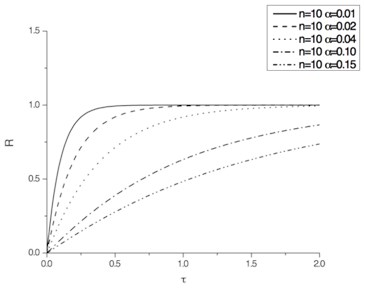
b) 10
c) 5
d) 3
e) 1
f) 0.2
Fig. 5Photo of test setup and specimen
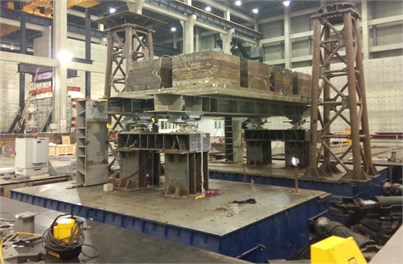
Fig. 6Configuration of FPS bearing with steel blocks
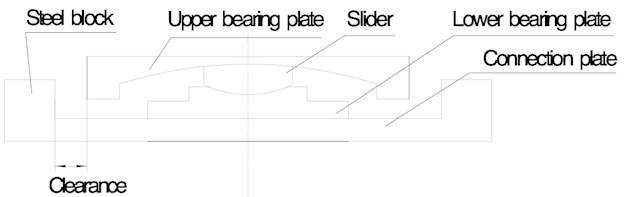
Fig. 7El-Centro ground motion
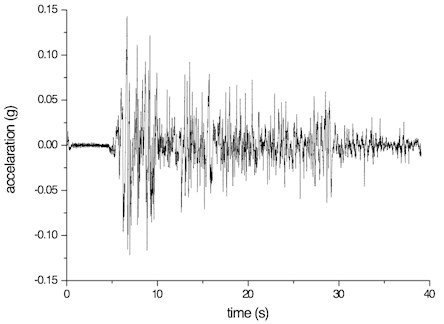
Fig. 8Bearing test results on Pier 1
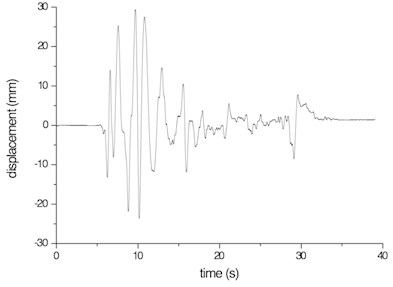
a) Displacement time history
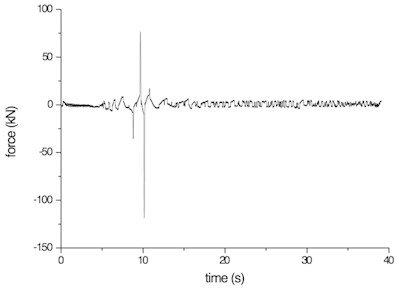
b) Force time history
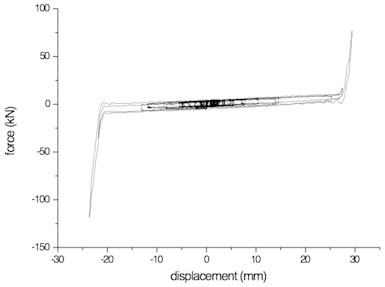
c) Hysteresis curve
4. Simulation of test results using PLMM
To investigate the proper range of the Partial Lumped Factor , the shaking table test is simulated using the PLMM in this section. The finite element software SAP2000 is used to establish a numerical model of the shaking table test model. In the analysis, is adjusted, and then different analysis results and shaking table test results are also compared.
The deck and piers are simulated by frame elements. The actual material, section areas and area moments of inertia of all the components are simulated in the model. The additional mass is simulated by four mass points. Parameters of components are listed in Table 1.
Each bearing on Pier 1 is simulated by a combination of Plastic (Wen), Gap and Hook elements. Each bearing on Pier 2 is simulated only by a Plastic (Wen) element. Plastic (Wen) element is used to simulate the FPS bearing, and Gap and Hook elements are used to simulate the steel blocks. Parameters of bearings are obtained from the test results.
Six analysis models are established by adjusting the Partial Lumped Factor . The corresponding model parameters are listed in Table 2.
Table 1Bridge material and sectional geometric properties
Section location | Section area (m2) | Moment of inertia along transverse axis (4) | Material |
Deck | 0.02 | 1.831×10⁻³ | Steel |
Pier | 0.1408 | 4.838×10⁻³ | Steel |
Table 2Parameters of six analysis models
Model | (m) | (ton) | (kN/m) | ||
1 | 0.005 | 0.03 | 0.3 | 1.33E+08 | 66.7 |
2 | 0.01 | 0.06 | 0.6 | 6.67E+07 | 33.3 |
3 | 0.02 | 0.12 | 1.2 | 3.33E+07 | 16.7 |
4 | 0.05 | 0.3 | 3 | 1.33E+07 | 6.7 |
5 | 0.1 | 0.6 | 6 | 6.67E+06 | 3.3 |
6 | 0.15 | 0.9 | 9 | 4.44E+06 | 2.2 |
The shaking table test and analysis results of all the six analysis models are compared. The displacement and force time histories of bearings on Pier 1 are shown in Fig. 9. As shown, all the displacement and force time histories are almost coincident. The results show that the suggested PLMM is insensitive to the Partial Lumped Factor, especially for bearing displacements.
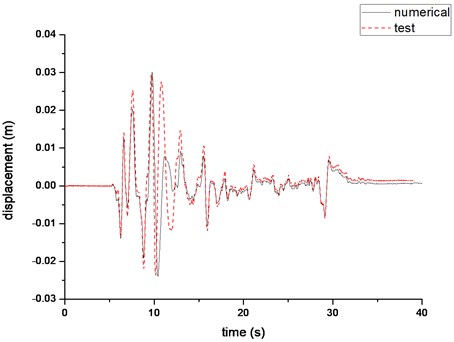
Displacement time histories in Figs. 8 and 9 are compared in Fig. 10, and it can be seen that analysis results match shaking table test results very well. Bearing displacements and forces of all the models are listed in Table 3. Test results are also listed and compared with analysis results. As shown, bearing displacements of six analysis models are very close to each other, and their errors are very small. Bearing forces decrease with the increase of the Partial Lumped Factor . For the model 5, 0.1, and the error is the least. The stiffness ratio of model 5 is 3.3 and is close to the suggested value 3 in section 1. Therefore, the theoretical conclusion is verified.
Table 3Comparisons of bearing displacements and forces
Cases | Bearing displacements (mm) | Bearing forces (kN) | |||
Max | Min | Max | Min | ||
Analysis results | Model 1 | 30.001 | –23.90 | 78.74 | –125.50 |
Model 2 | 30.001 | –23.90 | 78.65 | –125.04 | |
Model 3 | 30.002 | –23.91 | 78.37 | –124.72 | |
Model 4 | 30.006 | –23.91 | 77.71 | –122.59 | |
Model 5 | 30.012 | –23.92 | 76.74 | –119.47 | |
Model 6 | 30.017 | –23.93 | 75.65 | –116.25 | |
Test results | 29.413 | –23.63 | 76.67 | –118.64 | |
Fig. 9Comparisons of analysis results of six analysis models
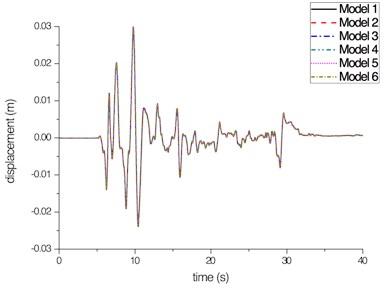
a) Bearing displacement
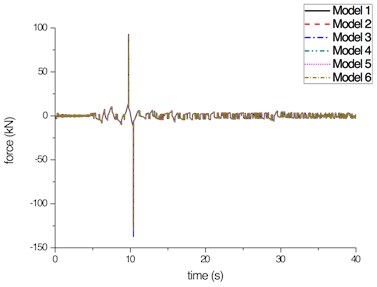
b) Bearing force
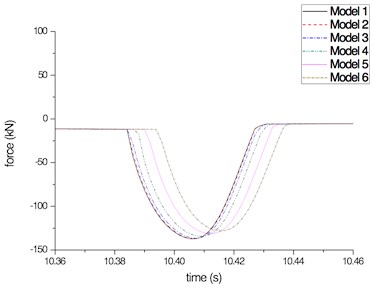
c) Bearing force peaks with different Partial Lumped Factors
Fig. 10Comparison of test and analysis displacement time histories
5. Conclusions
The Lumped Parameter Method disregards the stress wave propagation phenomenon, and the Watanabe and Kawashima Method introduces a supposed and artificial pounding stiffness to describe the pounding process. Therefore, both methods are not proper for the simulation of longitudinal deck-pier poundings of girder bridges. Based on the thought that only a partial segment of the deck is directly influenced by the pounding and can be simplified to a combination of a particle and a spring, a new Partial Lumped Mass Method was put forward and was introduced in this paper. Then rational Partial Lumped Factor was suggested theoretically. Analysis results using the PLMM with different Partial Lumped Factors were compared, and the validity of the PLMM suggested in this paper was verified with shaking table test results at last. The following conclusions are drawn:
According to the one-dimensional wave theory, the theoretical solution of the dimensionless pounding force time history is 1, so the ratio of the pounding stiffness to the horizontal stiffness of the pier is larger than 3 is a better choice to reduce errors of pounding force time histories according to the results of the theoretical analysis. With the decrease of and the Partial Lumped Factor , the convergence speed of pounding force time history approaching 1 is faster. Therefore, 3 is suggested in this paper accordingly.
To investigate the proper range of the Partial Lumped Factor , the shaking table test is simulated using the PLMM. The finite element software SAP2000 is used to establish the numerical model of the shaking table test model, and the analysis results are in good agreement with the test results.
The influence of the Partial Lumped Factor is investigated, and it’s found that bearing displacements calculated with the PLMM are insensitive to the Partial Lumped Factor. The pounding force calculated is sensitive to the Partial Lumped Factor, and the larger is the Partial Lumped Factor, the less is the pounding force calculated.
References
-
Jankowski R., Wilde K., Fujino Y. Pounding of superstructure segments in isolated elevated bridge during earthquakes. Earthquake Engineering and Structural Dynamics, Vol. 27, Issue 5, 1998, p. 487-502.
-
Ruangrassamee A., Kawashima K. Relative displacement response spectra with pounding effect. Earthquake Engineering and Structural Dynamics, Vol. 30, Issue 10, 2001, p. 1511-1538.
-
Desroches R., Muthukumar S. Effect of pounding and restrainers on seismic response of multi-frame bridges. Journal of Structural Engineering, Vol. 128, Issue 7, 2002, p. 860-869.
-
Abdel Raheem S. E. Pounding mitigation and unseating prevention at expansion joints of isolated multi-span bridges. Engineering Structures, Vol. 31, Issue 10, 2009, p. 2345-2356.
-
Lin J., Hung H., Liu K., Chai J. Reconnaissance report of 0512 China Wenchuan earthquake on bridges. Proceedings of the 14th World Conference on Earthquake Engineering, Beijing, 2008.
-
Wang C.-J., Shih M.-H. Performance study of a bridge involving sliding decks and pounded abutment during a violent earthquake. Engineering Structures, Vol. 29, Issue 5, 2007, p. 802-812.
-
Ruangrassamee A., Kawashima K. Control of nonlinear bridge response with pounding effect by variable dampers. Engineering Structures, Vol. 25, Issue 5, 2003, p. 593-606.
-
Won J., Mha H., Cho K., Kim S. Effects of restrainer upon bridge motions under seismic excitations. Engineering Structures, Vol. 30, Issue 12, 2008, p. 3532-3544.
-
Dimitrakopoulos E. G. Seismic response analysis of skew bridges with pounding deck-abutment joints. Engineering Structures, Vol. 33, Issue 3, 2011, p. 813-826.
-
Li B., Bi K., Chouw N., Butterworth J. W., Hao H. Effect of abutment excitation on bridge pounding. Engineering Structures, Vol. 54, 2013, p. 57-68.
-
Priestley M. J. N., Seible F., Calvi G. M. Seismic Design and Retrofit of Bridges. John Wiley and Sons, New York, NY, USA, 1996.
-
Northridge Earthquake Reconnaissance Report. Earthquake Engineering Research Institute (EERI), 1995.
-
Khatiwada S., Chouw N., Butterworth J. W. A generic structural pounding model using numerically exact displacement proportional damping. Engineering Structures, Vol. 62, Issue 63, 2014, p. 33-41.
-
Hao H., Bi K., Chouw N., Ren W.-X. State-of-the art review on seismic induced pounding response of bridge structures. Journal of Earthquake and Tsunami, Vol. 7, Issue 3, 2013, https://doi.org/10.1142/S179343111350019X.
-
Davis R. O. Pounding of buildings modelled by an impact oscillator. Earthquake Engineering and Structural Dynamics, Vol. 21, Issue 3, 1992, p. 253-274.
-
Watanabe G., Kawashima K. Numerical simulation of pounding of bridge decks. 13th World Conference on Earthquake Engineering, 2004.
-
Goldsmith W. Impact. Dover, New York, NY, USA, 2001.
About this article

This work was supported in part by the National Natural Science Foundation of China (No. 51278372) and the Ministry of Science and Technology of China, Grant No. SLDRCE 14-B-15. The authors declare that there is no conflict of interests regarding the publication of this paper.
