Abstract
The article deals with the creation of a transient computational model of rotating shaft deflection. This model is used for analysis of vibrations in the truck powertrain with an 8×8 drive. This vehicle is intended for military or fire purposes. However, issues with powertrain vibrations after reaching a certain vehicle speed appear. It was assumed that it was caused by the revolutions of the powertrain shaft and its deflection. Therefore, the aim is to reduce the vibrations affecting the drive comfort and prepare a computational model of the shaft. The transient computational model was created in Matlab software and compared with the results of a second model with the use of the finite element method. The second computational model works as a control version for the first model. The verification was carried out with the use of measurement of shaft deflection and directional vibrations on the powertrain. The conclusion shows the results of the comparison between the old and the new version of powertrain where vibrations were reduced.
1. Introduction
The vibrations have an impact on the driver, they affect the drive comfort and may also affect the health of the driver. Therefore, an analysis of the vibrations is important not only with the passenger cars but also with trucks [1-4]. The vibrations in trucks may be more intensive and may generate noise which makes the drive unpleasant for the driver. For a vibration analysis of the impact on the drivers, standards which describe vibration measurements and data processing may be used. These subsequently indicate whether or not the vehicle is comfortable for the driver.
This article focuses on the analyses of vibrations of the truck powertrain with an 8×8 drive. Its unique complex dynamic system includes many parts which can cause the vibrations. There was a problem with vibrations whose cause was unclear. Therefore, the authors gathered literature resources [5-8] that describe various sources of vibration and noise of vehicles, however, the character of the above mentioned vibrations did not correspond to any described cases in available literature. It was assumed that the problem was caused by an unbalanced rotating shaft in the powertrain. The truck showed problems with vibrations and noise after reaching a certain speed. This was documented abroad where the limits of the European legislations are not used. Therefore, it was assumed that it was caused by the revolutions of the powertrain shaft because there is a higher shaft speed than during a normal vehicle operation. This shaft unbalance can create a deflection. To analyse the deflection of the longest shaft, transient computational model I were created using analytical and differential equations. The computational model II uses the Finite Element Method (FEM). This second model is used as a control version for the first model. The aim was not to improve some already existing computational models but to create a specific solution for the unique concept of the powertrain. The validation of the computational models was carried out by several measurements on the truck with a 8×8 and 8×4 drive. The measurement was performed on a moving truck and a stationary truck in the laboratory. In the case of the stationary truck, some parts of wheel gears were removed. Then the vehicle vibrations and deflection of the longest shaft were measured too.
The article presents results of the deflection obtained from both the computational models and the measured data. They are used to evaluate the vibration spectrum where the cause of the vibration of the truck powertrain should be visible. Moreover, an analysis of the comfort using an appropriate norm was carried out.
The conclusion describes all the results and searches for the main cause of the powertrain vibration. A further utilization of the computational models is also included and there are also described other possibilities of modification of the individual components of the powertrain.
2. Transient computational models
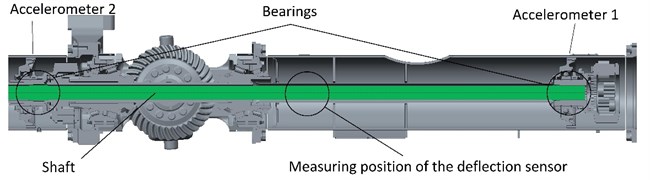
Two computational models of the shaft deflection while rotating was created. They are described in the relevant chapters. The first transient computational model was created using analytical and differential equations. The second computational model, which was analysed by FEM, is described only marginally because it is used only as a control version for the computational model created with the use of analytical and differential equations. Fig. 1 shows the 3D model of the drive shaft used for the FEM analysis and the measuring position.
Fig. 13D model of the drive shaft and the measuring position
2.1. First transient computational model
To verify the vibrations on the truck caused by the unbalanced rotating shaft, a computational model of a rotating shaft had to be created with the use of equations based on [9, 10]. The computational model of the drive shaft includes the part of the shaft between the two bearings (see Fig. 1). This part of the shaft is divided into n mass points. The initial deflection was set by the measurement on the truck in the place of the deflection sensor. The shaft deflection model is based on these equations:
where is deflection in the middle of the analysed shaft length, – deflection in the measured point, – location of measurement, – shaft length, – initial shaft deflection in the individual points based on the given segments of the shaft, and – coordinates of the given shaft cross-section.
Centrifugal forces act on the individual mass points of the shaft. Their values were determined in each step of the simulation because deflection and shaft speed are increased. The following equation was used:
where is centrifugal force in the location of the individual mass points, – mass of the given mass point, – shaft deflection in the location of the given mass point, and – shaft angular speed. The boundary conditions are an important aspect for the shaft. It may be assumed that the boundary conditions will be between the hinged and fixed support because there are different shaft supports on the truck. Therefore, a computational model was created and it is presented in Fig. 2. The centrifugal force and equal zero in the support, therefore, it is not depicted in Fig. 2, n is number of mast point. Moreover, individual forces correspond to individual mass points and deflections.
Fig. 2Boundary conditions of tree tasks
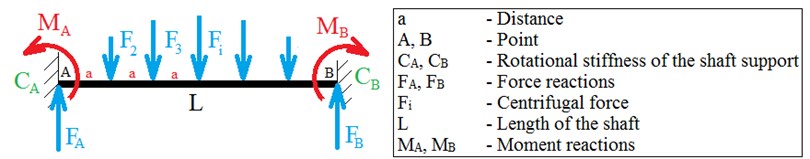
It describes the shaft with rotational stiffness in the support. , are the moment reactions and , the force reactions. For the beam with the defined stiffness in the support the force equation, moment equation and two equations for rotation in points and will be used. However, these rotation equations will not equal zero, but they will be modified to the form of the following equations:
where , are rotations in points and , , – rotational stiffness of the shaft support, – bending moment, – modulus of elasticity, and – quadratic moment of the cross section of the shaft. To gain values of the deflections in the individual steps, the equation of the deflection line is used where the rotation and displacement in the given place is determined by gradual integration. The distance between the mass points is the same as the distance between the forces. The equations of the deflection line are defined as follows:
where is 1, 2, 3, + 2, is 1, 3, 5, + 2, is displacement and integration constants. These constants must be determined from the boundary conditions. Furthermore, the equality of rotation values and deflections between the individual released segments must exist. The results of simulation are presented in Fig. 14.
2.2. Second transient computational model (FEM)
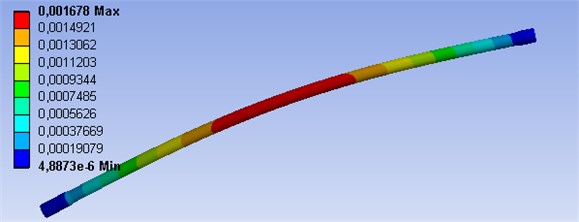
The second transient computational model prefers the utilization of FEM. This model is used for an analysis of the boundary conditions of the hinged and fixed support. There was placed a 3D model of the shaft into the FEM software and subsequently a transient deflection of the shaft was simulated. Examples of results for different shaft speeds are shown in Figs. 3-4. These maximal values of the shaft deflection must be added to the initial deflection of the 3D model and these results correspond with the simulation results of the model I in Fig. 14. This FEM model is not limited by other part of the powertrain, therefore, contact in the middle is not used. Basic parameters of model are number elements of 348, type elements of SOLID186 and material properties are the same as in the model I. These are Young’s modulus of 210000 MPa and Poisson’s ratio of 0.3. This computational model II works as a control version for model I, therefore, there is no need for detailed description.
Fig. 3FEM analysis of 3D model with boundary conditions of the fixed support, shaft speed 2600 min-1
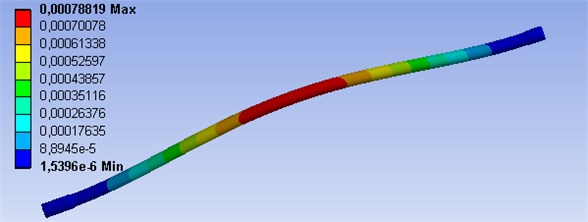
Fig. 4FEM analysis of 3D model with boundary conditions of the hinged support, shaft speed 1300 min-1
3. Measurement of deflection and directional vibration
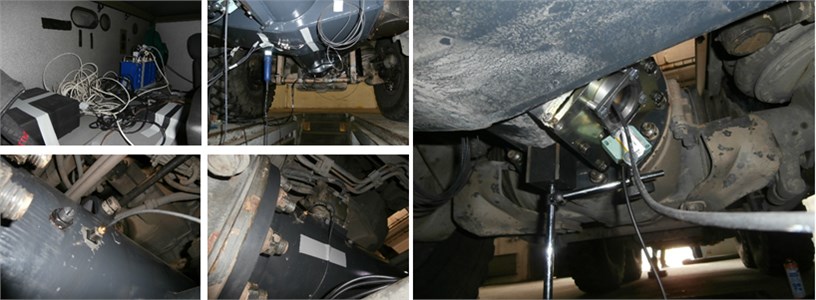
The measurement of the rotating shaft deflections and directional vibrations was carried out with the use of switchboard IMC CRFX 400. Individual cards were used for the connection of sensors. Two three-axial accelerometers, seat three-axial accelerometers, a deflection sensor and a photoelectric reflex switch for speed measurement were connected to the card ICPU2-8, CRFX/ISO2-8 and to the switchboard. During the measurement, the shaft speed was increased from the minimal to the maximal value to gain data from the whole range of the truck velocity. The measurement was carried out on a powertrain of an 8×8 and 8×4 truck on a highway or in the laboratory.
The speed signal was recorded as a mark per rotation from the photoelectric reflex switch. The measurement of the shaft deflections was carried out by a BAW M30ME-UAC10B-S04G sensor. The results of the gained data are shown in Fig. 14 where the states before and after the powertrain modification are compared. To measure the drivetrain vibration, two three-axial piezoelectric accelerometers Brüel&Kjær 4524 were used.
Subsequently, FFT spectrums [11, 12] of measured vibrations, comfort and shaft deflections were evaluated depending on the shaft speed. The measuring position is illustrated in Fig. 1 or Fig. 5.
Fig. 5Sensors and the measuring position
The vibration measurement was also carried out on the driver seat to assess the effects of vibration on the driver with new and old powertrain modification. Sensor EMF-KB103SVD was used. The measured data were analysed according to the information based on the ISO 2631-1 [13]. This norm defines and divides vibrations in relation to human health and comfort, perception of vibration and the occurrence of motion sickness. It also monitors the overall vibration and excludes the effect of tools and vibrations caused by vehicle impact. This contains information and annexes provide the data for the analysis of vibration measurement. The vibration on the monitored object can occur in various directions and include different frequencies. These aspects have biological effects on the human organism and its individual organs. It can cause different sensations and risks.
The standard also defines the ranges of frequencies from 0.5 Hz to 80 Hz for the health and comfort, and 0.1 Hz to 0.5 Hz for motion sickness. There are also defined methods for the position of vibration sensors. In this case, vibrations between the vehicle seat and the driver are analysed. For the measurement of translational vibration, unit m s-2 and rotational vibration rad∙s-2 are used. A weighting curve is recommended to evaluate the various positions of the vibration detection. In the case of vibration measurement on the seat, the weighting curve Wk is recommended in the direction of vibration in the -axis while and axis use the Wd weighting curve. These curves determine the weight of significant frequencies affecting the body. The coordinate system for the measurement is described in [13] where is the frontal direction of a sitting person in the vehicle, is lateral direction towards left of the siting person and is vertical direction. Basic weighted root-mean-square acceleration is used to evaluate the comfort. It is described by the following equation:
where – the weighted acceleration, – time measurement and – time. The suitability of the method is determined by a crest factor. It must be less than or equal to 9. In the case of a higher value of this factor, the following Eqs. (10-13) are used. The first of them (10-11) is the maximum transient vibration value (MTVV) and the second (12-13) is the fourth power vibration dose value (VDV):
where – observation time and – integration time of the averaging. The measurement processing is realized by the basic method, therefore, it is sufficient for this purpose. In this case, script in Matlab software was constructed.
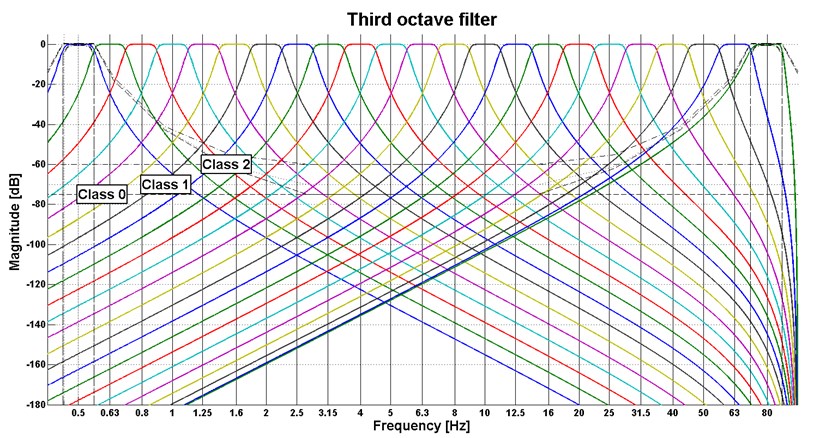
To apply the weights in octave bands, it was necessary to program the third octave filter. It is composed of low-pass and high-pass filter and it includes a filter with a Butterworth characteristic. The characteristics of this filter are described in the ANSI S1.11-2004 [14]. The programmed filter is shown in Fig. 6.
There are also shown three filter classes. The filter must be located between the selected classes. The measured data were filtered in each band. The following equation of frequency-weighted acceleration was used for evaluation:
where is the root-mean-square acceleration for the th one-third octave band and – is the weighting factor for the th one-third octave band. Combined vibrations are calculated by the following equation:
where , , are weighted root-mean-square acceleration values in the respective directions and , , coefficients are determined by the measuring position. For the case of a seat sensor, these coefficients are equaled to 1. In terms of comfort, the combined vibration value can be classified in several levels [5].
Table 1Combined vibration value classification
Less than 0.315 m s-2 | Not uncomfortable |
From 0.315 m s-2to 0.63 m s-2 | A little uncomfortable |
From 0.5 m s-2to 1 m s-2 | Fairly uncomfortable |
From 0.8 m s-2 to 1.6 m s-2 | Uncomfortable |
From 1.25 m s-2to 2.5 m s-2 | Very uncomfortable |
Greater than 2 m s-2 | Extremely uncomfortable |
Individual weighted acceleration can be converted to the acceleration level in decibel. It is described in the Official Gazette No. 502/2000 [15] and the following equation is used there:
where is the reference level of acceleration with a value of 10-6 m s-2. In the Official Gazette, there are also limits of acceleration for eight-hour shifts. Based on these rules, the program was designed for processing the measurement and evaluation of the whole vibration spectra.
Fig. 6The 1/3 octave filter used in the experiments
4. Results of directional vibrations
To interpret the measured vibrations, the FFT analysis from the data representing the given speed was used. From these analyses, FFT spectrums were calculated (see Fig. 7-12). These spectrums are illustrated only for the -axis of the accelerometers. Their measuring position on the truck is shown in Fig. 1 and Fig. 5. The longitudinal axis of the FFT spectrum describes frequency, the transverse axis describes shaft speed and the vertical axis shows values of amplitudes of the FFT analysis. The shaft speed corresponds with the vehicle velocity from 57.7 km/h to 107.7 km/h. The figures show the peak which stands for the 1st shaft speed harmonic order.
Fig. 7Results of directional vibration in the Z-axis (accelerometer 1), drive 8×4, old and new powertrain
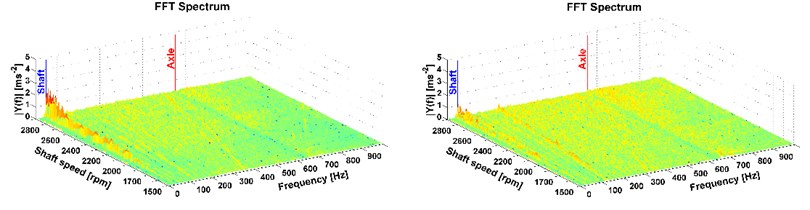
Fig. 8Results of directional vibration in the Z-axis (accelerometer 1), drive 8×8, old and new powertrain
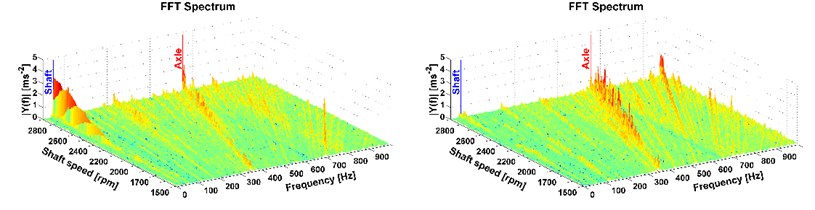
Fig. 9Results of directional vibration in the Z-axis (accelerometer 1), drive 8×8 (the vehicle was stationary), old and new powertrain
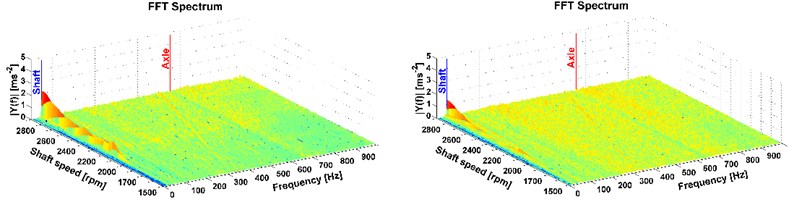
Fig. 10Results of directional vibration in the Z-axis (accelerometer 2), drive 8×4, old and new powertrain
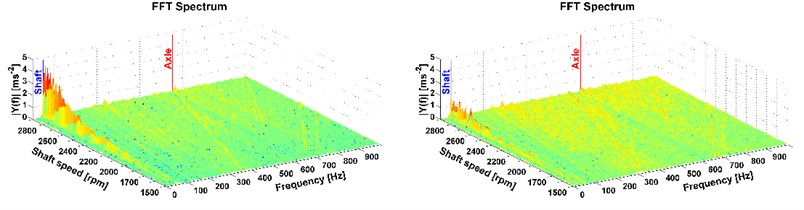
Fig. 11Results of directional vibration in the Z-axis (accelerometer 2), drive 8×8, old and new powertrain
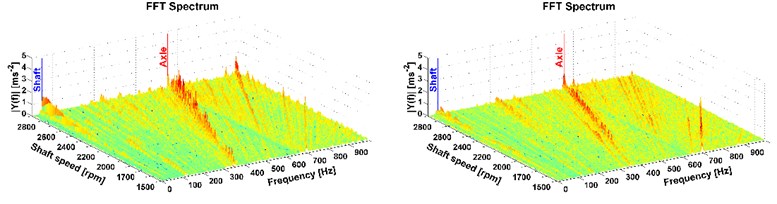
Fig. 12Results of directional vibration in the Z-axis (accelerometer 2), drive 8×8 (the vehicle was stationary), old and new powertrain
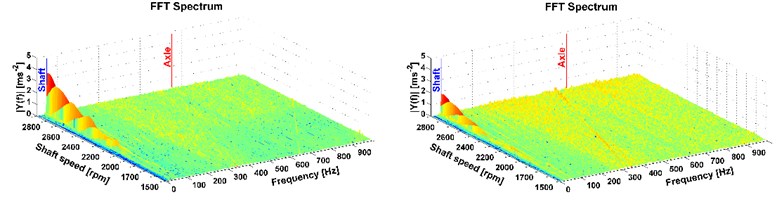
This is the most important part of vibration and it affects the driver. More peaks also occur mainly with the all-wheel drive which reflects the tooth frequency of the axle. But these frequencies are higher than the comfort range [13], therefore, in terms of comfort they cannot be reduced by the modification of the powertrain. The comparison of the two measurements, on the old powertrain (see figures on the left) and on the new modified powertrain (see figures on the right) is also shown. A considerable reduction of vibrations caused by the rotating shaft deflection was reached which is illustrated in Fig. 7-12 on the right. The results of the 1st shaft speed harmonic order correspond with results of shaft deflection obtained by the computational model and measurements.
5. Results of deflection
The results of the computational model and measurements are compared in Fig. 13. The horizontal axis describes the shaft speed and the vertical axis describes the shaft deflection of the measured data and results of computational models. Based on the deflection simulation and measurement, it may be concluded that the computational models were chosen appropriately, therefore, there is no need to extend the first computational model for the whole drive shaft.
Fig. 13Results of measurement and simulation
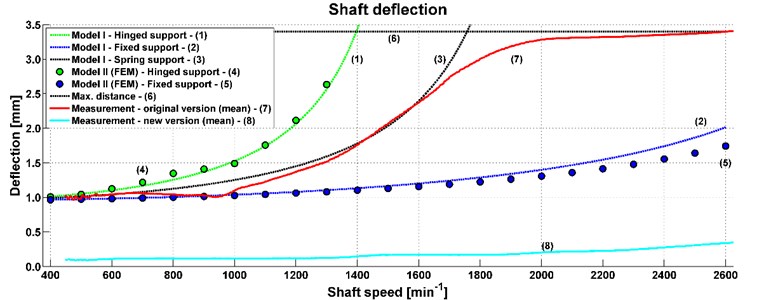
The measured data were in the area of 400-2600 min-1. These values were then averaged (see curve 7). In the first part of the graph, the results obtained by the computational model with rotational stiffness of the shaft support (see curve 3) correspond to the measured data of deflection (see curve 7). In the second part of the graph, results are different because the real shaft deflection limit is 3.4 mm and the computational model does not have any limitation. The measured data show that the shaft deflects to the limit of another part of the powertrain. The graph shows results of other models with different support. Deflection value of hinged support is represented by curve 1 for model I and curve 4 for model II (FEM). Their values are similar and the same case is for the fixed support (see curves 2, 5). Curve 6 represents limitation of other parts of the powertrain.
The results of the deflection measurement, vibration analysis and model simulation show that the deflection of this shaft is the main cause of the powertrain vibration. It is transmitted to the whole structure of the truck. To decrease the truck vibration, it is necessary to minimalize the shaft deflection. Therefore, a modification of the powertrain was designed and carried out before the second measurement. The modification was a constructive solution to the shaft support. The following measurement proved that the shaft deflection was considerably decreased (see curve 8). The impact of the shaft deflection is also shown in the in Figs. 7-12 and it corresponds to 1st shaft speed harmonic order.
6. Results of comfort
The problem with a powertrain shaft was solved, therefore, the measurement of vibrations on the drive seat was conducted and subsequently its comfort was evaluated. The results of the comfort are shown in the following Figs. 14-19. The first three figures evaluate the measurement on the old version of the powertrain and the other three figures evaluate the results of measurement of the new version of the powertrain. The transversal axis represents the shaft speed and the vertical axis describes the acceleration level. The longitudinal axis shows the third-octave bands. These figures also show the maximum value of the combined vibrations and determine the level of comfort. Limits for an eight-hour working time are displayed. The results shown in Figs. 14-19 are for measuring with old and new modification of the truck powertrain.
Fig. 14Analyses of comfort on the seat, drive 8×4, old version of the powertrain
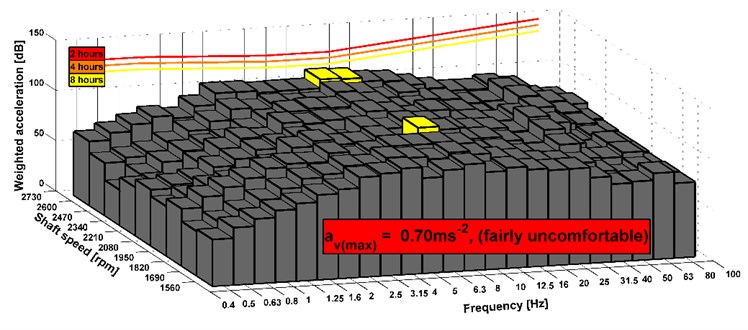
Fig. 15Analyses of comfort on the seat, drive 8×8, old version of the powertrain
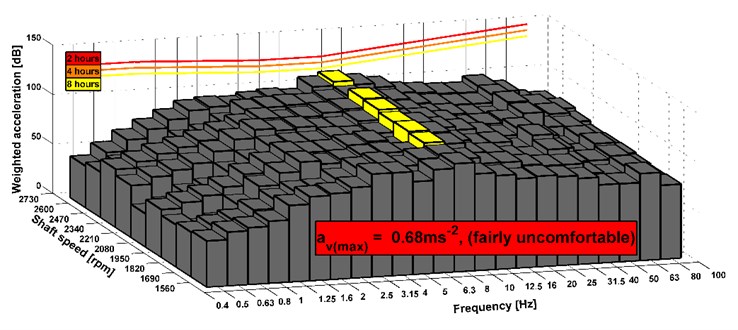
Fig. 16Analyses of comfort on the seat, drive 8×8 (the vehicle was stationary), old version of the powertrain
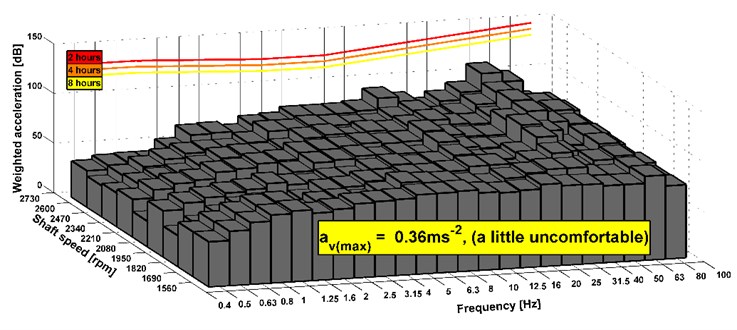
Fig. 17Analyses of comfort on the seat, drive 8×4, new version of the powertrain
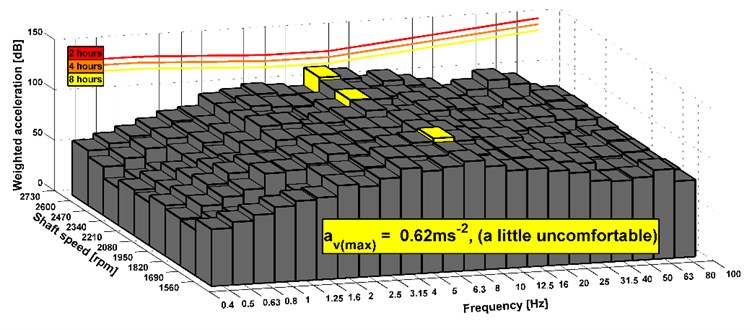
Fig. 18Analyses of comfort on the seat, drive 8×8, new version of the powertrain
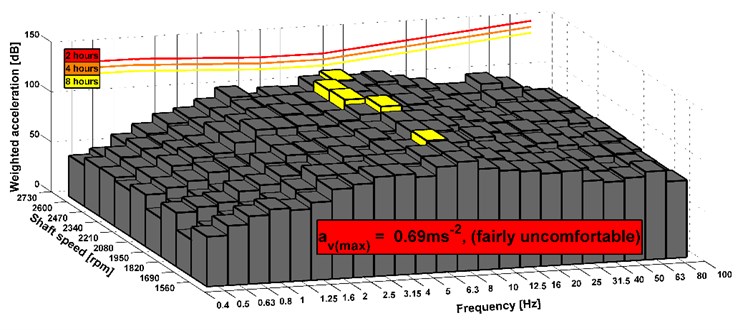
Fig. 19Analyses of comfort on the seat, drive 8×8 (the vehicle was stationary), new version of the powertrain
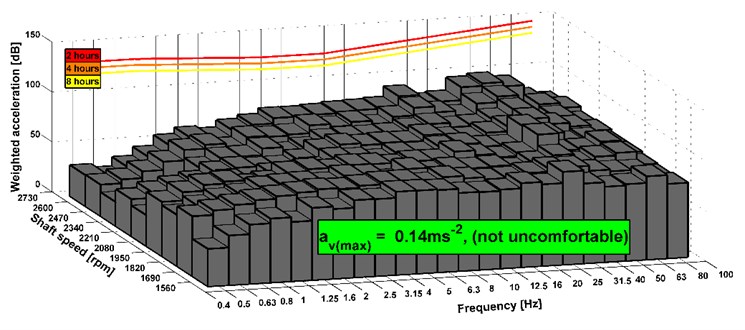
The results show that the level of comfort is improved from fairly uncomfortable to a little uncomfortable. It is an example of measuring of the stationary vehicle. The seat has the elements that dampen vibrations. Therefore, the acceleration value can be also acceptable before the design change of the powertrain. In Fig. 14-19, there are shown maximal combined accelerations and they correspond with over operation mode of the truck. In the area of ordinary operating mode, the combined acceleration is lower. In terms of subjective evaluation of vibration, vibrations were very unacceptable in the operating mode over 85 km h-1 before the design change of the powertrain. This could be confirmed by a sensor which would be placed on the floor of the cab. Subjective and objective evaluations of vibrations show that in the new design of the powertrain the vibrations almost disappeared. The shaft deflection was the main cause of the vibration on the truck. The results of measurement of the driving truck are higher according to the unevenness of the road. It can be seen that the limits for the eight hours per day exceed in any driving mode. However, these conditions appear over the maximal vehicle velocity. The maximal vehicle speed is set by the legislation and operation vehicle speed is still changed during a drive. It means that driver is not limit by vibration because he is in an area of comfort analyses of higher vibration during short time or he is beyond the area.
7. Conclusions
There were some problems with vibrations and noise after reaching a certain speed. Therefore, the measurement and data analyses were carried out. Then their values were compared with the transient computational models. The models were created to analyse the shaft deflection.
In the first, FFT spectrums were evaluated and the cause of the powertrain vibration was searched for. The results show a significant peak of 1st shaft speed harmonic order. It represents a link with the shaft speed. The deflection measurement and utilization of the computational model also show a dependence of the deflection and shaft speed. This was the main cause of the powertrain vibration. Therefore, the translational vibrations caused by the rotating shaft deflection were reduced by the new powertrain design.
Based on these results, it may be concluded that the structure of the computational model is suitable for the analysis of the shaft deflection. These models may be used for further development of the vehicle powertrain.
Moreover, the impact on the comfort of a vehicle was evaluated. The results show that vibrations are satisfactory in both modifications. However, a subjective evaluation of vibration was unacceptable before the new modification. It was caused by the seat damping and it was not clearly shown in the results of comfort.
The support of the analysed shaft led to the decrease of vibrations and a near loss of the 1st shaft speed harmonic order. This corresponds to the analysis of the shaft deflection and it may be univocally concluded that the shaft deflection and its unbalance was the main cause of the vibrations on the truck. The first computational model may be easily used for the development of the drivetrain with long shafts, where with the shaft deflection, some deformation or unbalance may occur.
References
-
Jazar R. N. Vehicle Dynamics: Theory and Application. Second Edition, Springer, New York, 2014.
-
Öchsner A., Silva L. F. M. da, Altenbach H. Design and Analysis of Materials and Engineering Structures. New York, Springer, 2013.
-
Rajamani R. Vehicle Dynamics and Control. Second Edition, New York, Springer, 2012.
-
Dolcini P. J., Canudas de Wit C., Béchart H. Dry Clutch Control for Automotive Applications. New York, Springer, 2010.
-
Genta G., Morello L. The Automotive Chassis: Vol. 1: Components Design. Netherlands, Springer, 2009.
-
Kiencke U., Nielsen L. Automotive Control Systems: For Engine, Driveline, and Vehicle. Second Edition, Berlin, Springer, 2005.
-
Zhang X., Mi C. Vehicle Power Management: Modeling, Control and Optimization. New York, Springer, 2011.
-
Gillespie T. D. Fundamentals of Vehicle Dynamics. Warrendale, Society of Automotive Engineers, 1992.
-
Budynas R. G. Shigley’s Mechanical Engineering Design. Eighth Edition, McGraw-Hill, New York, 2006.
-
Waller H., Schmidt R. Vibration Theory for Engineers: Theory, Simulation, Applications. First Edition, Wissenschaftsverlag, Zürich, 1989.
-
Tůma J. Vehicle Gearbox Noise and Vibration. Wiley, Chichester, 2014.
-
Tůma J. Signal Processing of Mechanical System using FFT. Prague, 1997.
-
International Organization for Standardization. ISO 2631-1. Mechanical Vibration and Shock: Evaluation of Human Exposure to Whole-Body Vibration – Part 1, 1997.
-
The American National Standards institute. ANSI S1.11-2004. Specification for Octave-Band and Fractional-Octave-band Analog and Digital Filters, 2004.
-
The Czech Republic Journal of Laws, No. 502/2000. Government Regulation on Health Protection Against Adverse Effects of Noise and Vibration, 2000.
Cited by
About this article

This work is an output of NETME CENTRE PLUS research activities (Project No. LO1202) and is funded by the Ministry of Education, Youth and Sports under the “National Sustainability Programme I”.
