Abstract
Plate attitude control structures such as rudders and vertical tails of high-speed aircraft are faced with the compound effect of fast time-varying thermal environments and vibration during the high maneuvering flight. In this paper, a thermal/vibration test system was established by combining a transient aerodynamic heating simulation system with a vibration test system. A rectangular plate structure made of nickel-based stainless steel was tested at different heating rates and its modal frequencies in fast time-varying thermal environments were obtained. Numerical calculation was performed accordingly. The calculated results coincide well with the experimental results, verifying the credibility and effectiveness of the experimental methods. The research results can provide an important test method and reference basis for the dynamic performance analysis and safety design for the plate-like structures of high-speed aircraft in fast time-varying thermal environments.
1. Introduction
The aircraft surface is subjected to harsh high-temperature environments during the high-speed flight in air due to the strong compression and friction of the air flowing by the outer shell of the aircraft. In particular, during the period of early launching and high maneuvering flying, this kind of thermal environments will change quickly. Meanwhile, because the flutter structure is usually embedded in the aircraft body at its root, non-uniform temperature will distribute along the wingspan from the root of the flutter with higher temperature gradient.
High-temperature environments caused by aerodynamic heating can change the elastic performance of aircraft materials and structures and the non-uniform temperature can introduce additional thermal stress in the structure. Both of them will change the stiffness of the flutter structure and thus change its vibration characteristics, which will have an influence on the flutter characteristics and controllability of high-speed aircraft. Therefore, studying the variation of the vibration characteristics of plate-like structures such as the wings and rudders in fast time-varying and non-uniform thermal environments is significant for the reliability design of high-speed aircraft.
Because it is difficult to pick the vibration signals correctly in high-temperature environments, the thermal-vibration experimental researches [1-3] are rare compared with the theoretical researches [4-6].
In this paper, a thermal-vibration test system is established by combining a transient aerodynamic heating simulation system with a vibration test setup to perform the thermal-vibration test on a rectangular plate structure in fast time-varying and non-uniform thermal environments. Infrared radiation heating arrangements are used to generate a controlled thermal environment, which is able to simultaneously heat both sides of the plate. Thermal shock experiments on a rectangular plate structure at different heating rates are finished. The highest temperature rising rate is 2.5 °C/s and the highest test temperature is up to 600 °C. During the test, a self-developed high-temperature extension configuration which can transmit the vibration signals and realize measurement at various points is used to obtain the modal frequencies and modal shapes of the plate structure in fast time-varying thermal environments. Moreover, the thermal modal parameters of the rectangular plate are calculated in the present work and a comparison between the numerical result and the test result is performed, verifying the credibility and effectiveness of the proposed test method.
2. Thermal-vibration test
2.1. Specimen
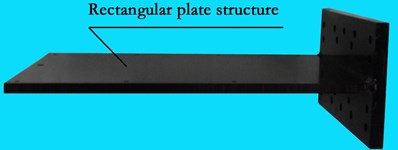
As shown in Fig. 1, the specimen is a rectangular plate structure made of high-temperature nickel-based stainless steel 1Cr18Ni9Ti, with the length of 340 mm, width of 220 mm and thickness of 7.5 mm. The shorter edge of specimen is completely wielded to a mounting bracket perpendicular to the specimen. There are 9 holes on the specimen. Eight of these holes are distributed on the longer edges and used to install the high-temperature-resistant extended measurement components of the vibration signals, with a diameter of 5 mm. The other one hole is distributed on the free edge and used to attach the excitation guiding rod, with a diameter of 8 mm.
Fig. 1Schematic of the specimen (units: mm)
2.2. Experimental apparatus.
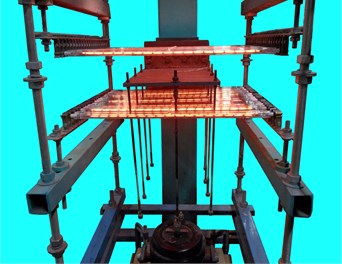
The thermal-vibration test apparatus is shown in Fig. 2. The rectangular plate is horizontally installed and fixed on the vertical beam through the bolts and bracket. A heat-insulation metal plate having water cooled tubes is designed between the mounting bracket and vertical beam. In the test, flowing liquid is running through the tubes to cool down the heat-insulation metal plate. It creates a temperature buffer zone between the specimen’s root and vertical beam, and thus protects the loading setup in high-temperature environments.
Fig. 2Experimental apparatus
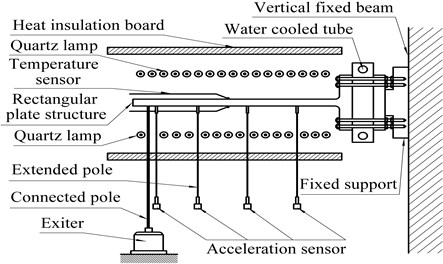
The exciter is set under the free end of the specimen and exerts excitation force to the specimen through the metal pole from the outside of the high-temperature thermal field. Acceleration sensors used to pick the vibration signals are fixed at the lower end of the extended poles. These poles are hollow and made from corundum material, with light mass, high stiffness and strong anti-deforming capability, which all contribute to transmit the vibration signals of the specimen effectively. Being installed out of the thermal environment, the ordinary acceleration sensors are able to be used in the test of this paper to obtain the vibration signals of the specimen in high-temperature environments which are difficult to measure.
2.3. Thermal environments in the test
In this study, 6 kinds of thermal environments with different linear heating rates are preset and the final heating temperatures are 100 °C, 200 °C, …, 600 °C, respectively. During the test, the thermal control system heats both sides of the specimen simultaneously to the end temperatures within 200 s.
2.4. Modal frequency
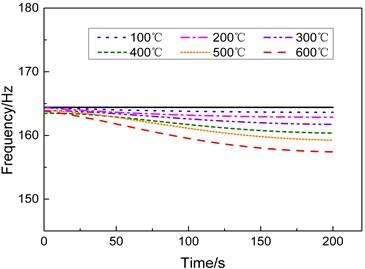
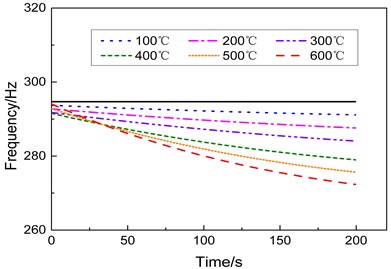
Fig. 3 shows the smoothed curves of the dynamic changes of the first-, second-, and third-order natural frequencies versus time at different heating conditions, in which the black solid line represents the modal frequency at room temperature. Fig. 3 indicates that the modal frequency of each order tends to decrease during heating period. The higher is the heating rate, the faster the changes in the natural frequency and the greater the amplitude of the decrease.
Fig. 3Modal frequencies of the specimen under different heating conditions
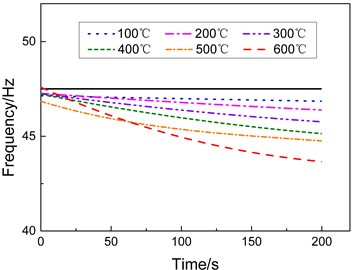
a) First-order frequency
b) Second-order frequency
c) Third-order frequency
3. Numerical simulation
3.1. Boundary conditions
According to the actual installation of the specimen, clamped boundary condition is set on the root edge of the rectangular plate in the numerical calculation.
During the test, non-uniform temperature field forms in the specimen because flowing liquid in the water-cooling device at the root of the specimen cools down the fixed bracket. Thermal stresses introduced by non-uniform temperature field will change the vibration characteristics of the specimen. Therefore, the temperature distribution of the specimen must be taken into consideration in the numerical simulation.
The temperature distribution on the specimen was obtained by measuring during the test. 23 temperature sensors are installed on the upper surface of the specimen and their locations and serial numbers are shown in Fig. 4. One temperature sensor (1#) is installed at the welding position between the rectangular plate and the fixed bracket. Two sensors (23# and 24#) are installed at the center portions of the upper and lower surfaces of the plate, respectively, to control the surface temperature. Seven temperature sensors (1#, 4#, 9#, 14#, 19#, 22#, and 23#) at the center line are used to measure the temperature variation along the x direction of the plate while the 4 columns of temperature sensors are used to get the temperature variation along the y direction near the root of the specimen.
Table 1 and 2 list the temperature data at 100 s (final heating temperature 600 °C) obtained from several typical sensors. It can be seen that the temperature changes much in the direction (Table 2) while keep roughly uniform in the direction (Table 2). For example, along the axis, the temperature at point 23 is 256 % higher than that at point 1; in the y direction, the temperature at point 16 is approximately the same as the temperature at point 14 with relative error 2.1 %. In addition, it is evident that the temperature in direction has no change when 165 mm. Therefore, to simplify the transient temperature field on the specimen surface, this temperature field can be regarded as a function of time t and position coordinate and the coordinate y can be neglected in the numerical simulation.
Fig. 4Temperature sensors on the surface of the specimen
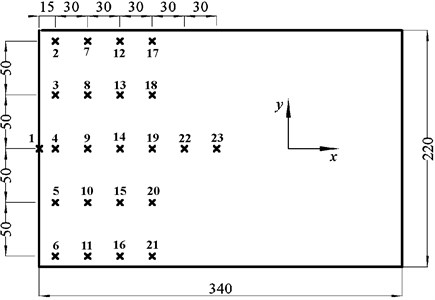
Table 1Temperature data in the direction x
Sensor | 1 | 4 | 9 | 14 | 19 | 22 | 23 |
Temperature/°C | 89.3 | 186.4 | 249.2 | 278.0 | 295.5 | 318.4 | 318.0 |
Table 2Temperature data in the direction y
Sensor | 12 | 13 | 14 | 15 | 16 |
Temperature/°C | 286.3 | 278.4 | 278.0 | 278.3 | 284.1 |
The specimen made of nickel-based stainless steel has a good thermal conductivity and a very thin thickness, so the inner temperature of the specimen is in close agreement with the surface temperature (namely, the temperature doesn’t change along the specimen’s thickness) when the both sides of the specimen are heated simultaneously. Hence, in the numerical calculation, shell element can be employed and the temperature field of the whole specimen can be represented by the surface temperature.
3.2. Comparison between calculated and test results
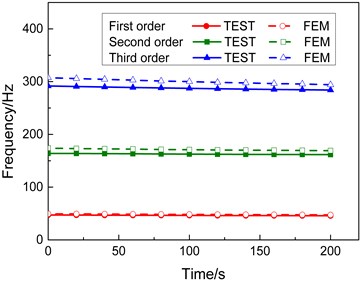
Fig. 5 shows the comparison between the calculated and test results of the first-, second-, and third-order modal frequencies of the specimen under two heating conditions of the end temperatures 300 °C and 600 °C (due to limited space, comparisons under other heating conditions are not put out). The curves in Fig. 5 show the difference between the calculated and test result is not very significant and their change trend is similar. Table 3 lists the calculated and test data of the first three orders modal frequencies of the specimen under the heating condition of final temperature 600 °C. As indicated by the data in Table 3, during the whole heating process, the relative errors between the numerical and test results of the first- and third-order modal frequencies are less than 6.0 % and those of the second-order modal frequencies are less than 8.0 %, suggesting that the numerical results coincide favorably with the test results for the specimen under rapid heating conditions.
From the expression for initial stiffness matrix and additional stress stiffness matrix , it can be known that the data size of the former is mainly related to the elasticity matrix [] while that of the latter is to the thermal stress matrix []. Calculated results show that the highest magnitude of thermal stresses in this test is 109, much smaller than the magnitude of the elasticity matrix because the magnitude of the material’s elastic modulus is 1011. Therefore, the main reason why the modal frequency of the specimen changes during the heating process is that the elastic performance of the structure changes in the high-temperature environments.
Fig. 5Comparison between the calculated and test modal frequency
a) Final heating temperature 300 °C
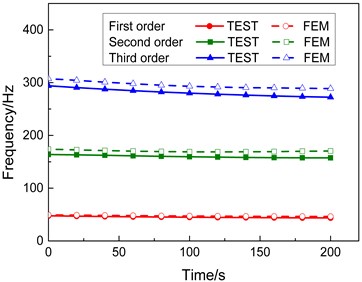
b) Final heating temperature 600 °C
Table 3Calculated and test frequencies
Time s | First order | Second order | Third order | ||||||
TEST Hz | FEM Hz | Error % | TEST Hz | FEM Hz | Error % | TEST Hz | FEM Hz | Error % | |
0 | 47.58 | 49.41 | –3.70 | 163.82 | 173.92 | –5.81 | 294.06 | 307.53 | –4.38 |
20 | 46.94 | 48.96 | –4.13 | 163.16 | 172.58 | –5.46 | 290.63 | 304.31 | –4.50 |
40 | 46.36 | 48.46 | –4.33 | 162.28 | 171.21 | –5.22 | 287.54 | 300.86 | –4.43 |
60 | 45.83 | 48.00 | –4.52 | 161.31 | 170.18 | –5.21 | 284.75 | 297.95 | –4.43 |
80 | 45.36 | 47.56 | –4.63 | 160.37 | 169.33 | –5.29 | 282.26 | 295.17 | –4.37 |
100 | 44.95 | 47.21 | –4.79 | 159.53 | 168.81 | –5.50 | 280.03 | 293.07 | –4.45 |
120 | 44.59 | 46.93 | –4.99 | 158.81 | 168.7 | –5.86 | 278.06 | 291.63 | –4.65 |
140 | 44.28 | 46.71 | –5.20 | 158.24 | 168.8 | –6.26 | 276.32 | 290.53 | –4.89 |
160 | 44.03 | 46.56 | –5.43 | 157.83 | 169.28 | –6.76 | 274.79 | 290.05 | –5.26 |
180 | 43.82 | 46.43 | –5.62 | 157.56 | 169.97 | –7.30 | 273.46 | 289.35 | –5.49 |
200 | 43.66 | 46.33 | –5.76 | 157.41 | 170.49 | –7.67 | 272.30 | 288.76 | –5.70 |
4. Conclusions
1) Aiming at the rapid changing thermal environments faced with the attitude control structures such as the wings and rudders of missiles during high maneuver flight, a high temperature thermal-vibration joint test system is established by combining the transient aerodynamic heating simulation system with the vibration test system, using which the test on the thermal modal characteristics of a rectangular plate under rapid heating conditions is performed.
2) The test results show that during process of temperature rise, the first-, second- and third-order natural frequencies of the specimen decrease and the higher is the heating rate, the greater amplitude of the decrease. During the heating process from room temperature to 600 °C, the first-, second-, and third-order modal frequencies decline 3.92 Hz (8.2 %), 6.41 Hz (3.9 %) and 21.76 Hz (7.4 %), respectively.
3) A good consistency found between the numerical results and experimental results verifies the credibility and effectiveness of the proposed test method.
References
-
Natalie D. S. High-temperature modal survey of a hot-structure control surface. Proceedings of the 27th International Congress of the Aeronautical Sciences, Nice, France, Vol. 3, 2010, p. 2091-2110.
-
Jeon B. H., Kang H. W., Lee Y. S. Free vibration characteristics of rectangular plate under rapid thermal loading. The 9th International Congress on Thermal Stresses, Budapest, 2011.
-
Cheng H., Li H., Zhang W., Liu B., Wu Z., Kong F. Effects of radiation heating on modal characteristics of panel structures. Journal of Spacecraft and Rockets, Vol. 52, Issue 4, 2015, p. 1228-1235.
-
Chakraverty S., Pradhan K. K. Free vibration of exponential functionally graded rectangular plates in thermal environment with general boundary conditions. Aerospace Science and Technology, Vol. 36, 2014, p. 132-156.
-
Fan Y., Wang H. Nonlinear vibration of matrix cracked laminated beams containing carbon nanotube reinforced composite layers in thermal environments. Composite Structures, Vol. 124, 2015, p. 35-43.
-
Jeyaraj P., Ganesan N., Chandramouli P. Vibration and acoustic response of a composite plate with inherent material damping in a thermal environment. Journal of Sound and Vibration, Vol. 320, Issues 1-2, 2009, p. 322-338.
About this article
