Abstract
The purpose of this work is to develop a mathematical model of the dynamics of turning a thin-walled cylindrical shell. It is then possible to obtain estimates of the boundaries of stability of the continuous cutting process. The model is constructed using the theory of shells with application of Galerkin’s method in conjunction with the expansion of the field of displacement in beam and trigonometric functions. On the basis of the developed model, an algorithm designed for constructing boundaries of stability of turning of the thin-walled cylindrical parts is presented.
1. Introduction
In the final stages of the turning process of the parts, which are compliant, there may be different vibrating processes, leading to a negative impact on the product quality [1]. All these make it necessary to select the correct parameters of cutting before machining. The regenerative mechanism of excitation of oscillation is widely used in the method of analysis of the stability of the stationary cutting process, based on the analysis of the characteristic equation with the further construction of the stability diagram [2]. Most of the works devoted to the study of the stability of the process of turning use as an object a cylindrical full workpiece [3] or beams [4]. However, in the literature, though not often, there are works devoted to the study of the stability of turning thin-walled cylindrical parts [5, 6]. The influence of damping on emergence of unstable cutting process was showed. All these works show the influence of damping on the occurrence of vibrations during cutting. Another feature of the turning machining of thin-walled cylindrical parts is a strong change in the dynamic stiffness and in the natural frequencies of the workpiece during the pass.
In this paper, the turning of a thin-walled cylindrical shell using an analytical approach is presented. This model allows to obtaining estimates of the boundaries of zones of instability of the continuous cutting process.
2. Analytical simulation of the turning process
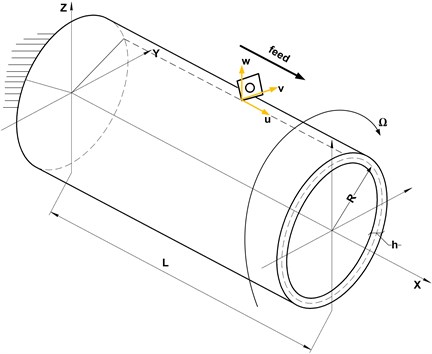
A model of the problem is given in Fig. 1. The cylindrical thin-walled shell is considered to be in rotation around its axis at a constant angular velocity. The shell is loaded with a force mobile and with the angular velocity . The left edge of the shell is fixed; the right one is free. The shell has the following geometric parameters: , , which account for length, radius and thickness, respectively.
The analytical approach is based on theory of the shell of Kirhgoff-Lyava. The system of differential equations of the shell, expressed in terms of the axial, circumferential and radial components of displacement, was conducted by using the method of Hamilton-Ostrogradskii.
The research of solutions of this system is performed by Fourier expansion of the components of displacement along the axial and circumferential directions of coordinates and then using the Galerkin’s method [7, 8]. The assumption of the average area inextensibility is taken into account, with continued use, for the discretization of the system, the beam functions were considered as basic functions [9].
For each harmonic axial and one particular circumferential harmonic we can write final system of differential equations of shell:
where , , are the matrices of mass, damping and stiffness respectively, is the matrix of projection arrived by Galerkin’s method, is a dimensionless coefficient of cutting stiffness, is the vector of solution and is a dimensionless time parameter. The matrix is determined by experience with help of damping of Rayleigh.
The resulting system of Eq. (1) in a matrix form with a retarded argument describes the process of turning a thin-walled cylindrical shell whose interaction with the tool is simulated by the application of a mobile point of force.
Fig. 1Scheme of the model
3. Stability analysis
The stability of the turning process is studied, using the model set above and the procedure described in the book of Cheng [2]. The Laplace transformation of Eq. (1) would yield:
where:
At the frontiers of the stability areas, the solutions of the Eq. (2) are purely imaginary. So the critical parameters of the cut are found by forming the determinant Eq. (2):
By substituting , the characteristic equation is divided in real and imaginary parts (). The parameter represents the oscillation frequency at the limit of the zone of stability, when the characteristic factor becomes purely imaginary. Subsequently, the oscillation frequency will be called chatter frequency.
By solution of the characteristic equation we obtained the following [2]:
where is the angle phase, is the phase difference between the internal and external modulations.
4. Experimental setup and measurements
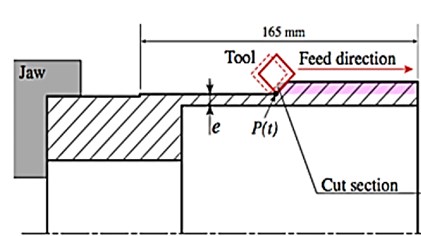
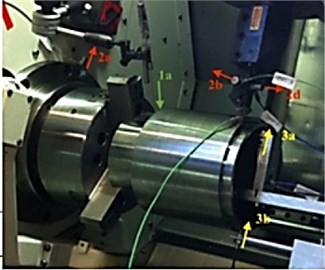
The operation studied in this work is the turning of the outer cylindrical surface of a tubular part, as can be seen on the drawing (Fig. 2(a)). The experimental set up consists of a piece, fixed by a three-jaw chuck to the machine tool, and a set of several types of sensors (Fig. 2(b)).
Fig. 2a) Geometry of the machined tube and b) experimental setup
a)
b)
For the measurement of vibrations of the workpiece in the experiment, the first type of sensors used is the sensors of the displacement (3a, 3b, Fig. 2(b)). The second type of sensors is accelerometers (2a, 2b, 2c, 2d, Fig. 2(b)). For the analysis of the frequency of rotation of the workpiece a sensor of optical displacement was used (1a, Fig. 2(b)). The pass of the tool is repeated several times until occurrence of vibrations of large amplitudes generating significant damage on the machined surface. The last pass concerned by our investigation causes vibrations which were detected. These vibrations generated defects visible on the machined surface.
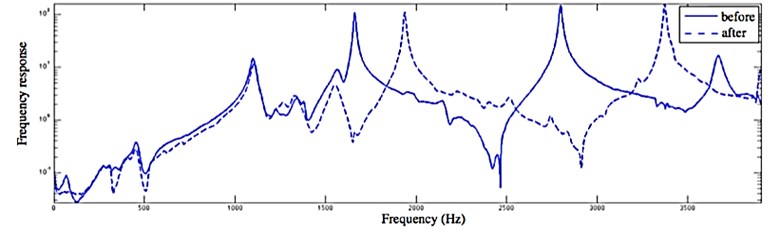
This occurred for a thickness of the tube going from 5.4 mm to 4.4 mm. In the framework of this experiment an impact test was carried out. The main aim of this test was the definition of modal characteristics of the workpiece before and after the turning process. Before and after this last path, a hammer test was carried out, giving the 2 transfer functions which are presented on Fig. 3. The experimental data given in Table 1 and Table 2 are coming from these transfer functions.
In Table 1 and Table 2 are given the values of the eigenfrequencies, and modal damping factors, taken from the experiment (curves on Fig. 3), before and after the last path of the tool.
Table 1Experimental eigenfrequencies before the passage of the tool
Freq. experiment (Hz) | 1108.4 | 1937.2 | 3384.5 |
Modal Damping | 0.0105 | 0.0076 | 0.00051 |
Modal form | 2 lobes | 3 lobes | Flexion 2 |
Table 2Experimental eigenfrequencies after the passage of the tool
Freq. experiment (Hz) | 1100.2 | 1661.1 | 2798 |
Modal Damping | 0.0077 | 0.00070 | 0.00078 |
Modal form | 2 lobes | 3 lobes | 4 lobes |
Fig. 3Transfer function before and after the last tool path
One of the aims of the experiment was to observe vibration of the thin walled structures during the turning process. The eddy current sensor ‘3b’, fixed on the machine frame, was used to record this effect. This sensor is placed in front of the right extremity of the workpiece where the largest displacements are present. The signal of this sensor is presented on Fig. 4.
Fig. 4Signal recorded using the sensor 3b
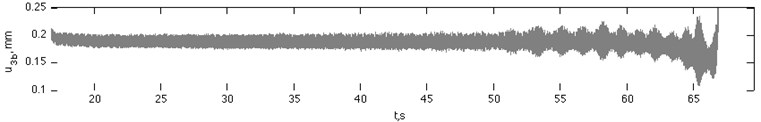
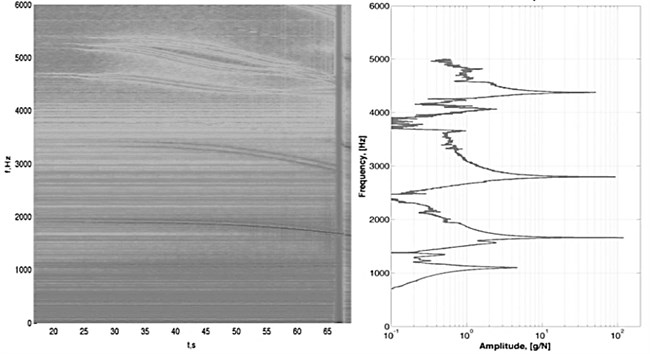
On the right side of this graphic the observed oscillations correspond to those visible on the workpiece surface. On the spectrogram computed from this displacement curve from the ‘3b’ sensor (Fig. 5) one can see the evolution of the resonance of the tube close to the evolution of its eigenfrequencies. On the right of the Fig. 5, the result of the hammer test after the last passage of the tool is given.
And, as shown by the analysis of the spectrogram and FRF (Fig. 5), the system responds to chatter frequencies during the pass that are close to its natural frequency.
Fig. 5Spectrogram issued from the measurement of the magnetic sensor ‘3b’ with the result of hammer test after the final passage.
5. Results of the simulation
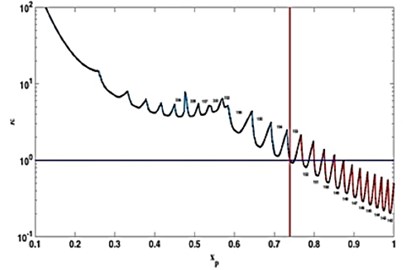
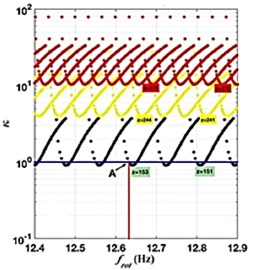
On the Fig. 6(a), one can see how the limit stiffness of the system changes during the pass of the tool and therefore when the continuous cutting process becomes unstable (in the final pass). Fig. 6(a) shows only the lower limit of the zone of stability (for the studied rotational frequency), because ultimately it is the only important one for the stability analysis of the cut. As can be seen, the first loss of stability of the cutting process takes place when the tool is in position . The stability diagram for this position of the tool in the parameters area is shown in Fig. 6(b).
The red vertical line (Fig. 6(b)) represents the rotational frequency of the workpiece, corresponding to the rotational frequency of the experiment 12,63 Hz. On the same line, corresponding to the rotational frequency of interest, there are several different sets of lobes representing the limit of the stability zone. The red vertical line intersects the first set of lobes in point А. To evaluate the stability of the continuous cutting process, the relative position of the point А (the intersection point of the rotational frequency of interest with the lowest set of lobes representing the border of the stability area) has to be estimated by comparing it to the limit value of the stiffness parameter of the system (horizontal blue line). If the point A is above the blue line, then the continuous cutting process is stable. If it is below the blue line, it is unstable. Fig. 6(b) shows that the continuous cutting process is located on the border of the zone of stability and consequently it is a moment of loss of stability of the cutting process.
Fig. 6Changes in the relative rigidity of the system a) during the pass and b) depending on the rotational frequency
a)
b)
6. Conclusions
A mathematical model of the turning was proposed and developed, with a finite number of degrees of freedom for a reliable estimate of the limits of stability of the continuous cutting. Based on the proposed model, an algorithm was developed to define the limits of the stability regions of the turning process of a thin-walled cylindrical part. Since the frequency at which the stability of the cutting process will be lost is not known, as well as the form of vibration corresponding to this frequency, several modes must be taken into account.
References
-
Altintas Y. Manufacturing Automation. Metal Cutting Mechanics, Machine Tool Vibrations, and CNC Design. Cambridge University Press, Cambridge, 2000, p. 286.
-
Cheng K. Machining Dynamics: Fundamentals. Applications and Practices, Springer, 2008.
-
Urbikain G., de Lacalle L. N. López, Campa F. J., Fernández A., Elías A. Stability prediction in straight turning of a flexible workpiece by collocation method. International Journal of Machine Tools and Manufacture, Vols. 54-55, 2012, p. 73-81.
-
Chen C. K., Tsao Y. M. A stability analysis of turning a tailstock supported flexible work-piece. International Journal of Machine Tools and Manufacture, Vol. 46, 2006, p. 18-25.
-
Arnold R. N. Chatter patterns formed on the surface of thin cylindrical tubes during machining. Journal of Mechanical Engineering Science, Vol. 3, 1961, p. 7-14.
-
Lorong P., Larue A., Duarte A. P. Dynamic materials research. Advanced Materials Research, Vol. 223, 2011, p. 591-599.
-
Li Hua, Lam Shin-Yong Rotating Shell Dynamics. Studies in Applied Mechanics, Vol. 50, 2005.
-
Lopatin A. V., Morozov E. V., Shatov A. V. An analytical expression for fundamental frequency of the composite lattice cylindrical shell with clamped edges. Composite Structures, Vol. 141, 2016, p. 232-239.
-
Lam K. Y., Loy C. T. Effects of boundary conditions on frequencies of a multilayered cylindrical shell. Journal of Sound and Vibration, Vol. 188, 1995, p. 363-384.
About this article
The research was funded by the financial support of the Ministry of Education and Science, NIR No. 9.1073.2014K under the design part of the State-guaranteed order in scientific research area. This work was also supported by the Russian Foundation for Basic Research, Grant No. 16-58-150001 NCNI_a.
