Abstract
A test rig is built to simulate the typical fault patterns of rigid hoisting guides and to collect vibration and inclination signals. In this work, we use these signals to perform data mining for fault-pattern recognition. Parameters are initially defined by analyzing collected signals. Then, the importance of each parameter is calculated using the boosting-tree method. Some valuable parameters are retained. To establish a data-mining algorithm that works remarkably for the fault recognition of rigid hoisting guides, six different algorithms including the boosting tree, K-nearest neighbor, MARSpline, neural network, random forest, and support vector machine are compared. Results show that the best performance is that of the boosting-tree algorithm, whose mechanism is then presented in detail.
1. Introduction
Coal is the primary energy source of humans, so coal-production safety is of utmost concern. One safety issue is the avoidance of mechanical accidents caused by faults that occur in hoisting guides [1]. Flexible (rope) guides and rigid guides are the two main types of guides for hoisting systems. Given the longer service and the better smoothness, rigid guides are more widely used in coal mines. Fault recognition of rigid guides is therefore the focus of this paper.
To check the integrity of rigid guides, a number of great methods have been adopted [2]. In early years, static measurement has been used in the performance evaluation of the rigid guides. For example, distances between guides and their perpendicularity were tested and regarded as key parameters to diagnose faults. Some particular instruments were developed to facilitate such measurements later on. All of these methods belong to direct measurement which utilize direct parameters of guides themselves but do not have ideal reliability and efficiency.
Vibration-acceleration-based measurement was then realized, which are actually an indirect way to check guides [3]. The relationship between vibration of cages and performance of guides has drawn considerable research interest and enthusiasm that lead to a great deal of research outcome. Zhanfang Li [4] applied singularity analysis based on wavelet to identify defects of rigid guides. Yuqiang Jiang [5] used fuzzy synthetic method to diagnose faults of rigid guides.
The foundation of vibration-based measurement is the kinetic analysis that has discovered some relationship between vibration characteristics and fault patterns. However, actual vibration of the cage and ropes has complicated results in the coupling of multiple vibrations such as transversal and longitudinal vibrations. To simplify the analysis, previous studies on vibration measurement of rigid guides usually neglect some existing vibrations. Thus, their accomplishments can only be approximate solutions. Moreover, for fault pattern identification, the features and algorithm are selected subjectively, which greatly limits the prediction accuracy. All these factors lead to the imperfection of the current vibration measurement.
Aiming at such inadequacy, this paper focuses on comparison and selection of algorithms to recognize fault patterns. A test rig is built to simulate fault patterns and collect needed signals. Parameters are selected according to their importance in contribution to recognition. Different algorithms are compared. The best one, the boosting tree algorithm, is presented in detail.
2. Construction of a test rig
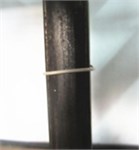
Inclination, local embossment, and joint dislocation are three typical and usual faults that happen to rigid guides. Therefore, the status of rigid guides may be categorized into four patterns that include normal, inclination, local embossment, and joint dislocation, which are shown in Fig. 1.
Fig. 1Patterns of rigid guides

a) Normal

b) Inclination

c) Local embossment
d) Joint dislocation
They can be simulated by the test rig that has been built and shown in Fig. 2. The test rig is made up of head sheave, rigid guides, hoisting container, winding drum, gear box, motor, speed regulator, sensors, signal acquisition device, and so on [6]. A DC motor drives the winding drum through a gear box. The speed regulator is used to adjust the speed. A rope is winded around a head sheave at the top and driven by the drum. The container is lifted up or dropped down through the rope. Vibration and angle sensors are installed on the container to collect signals needed and transfer them to a computer through a data acquisition device. Three fault patterns are simulated artificially as shown in Fig. 1. The parameter of the collected vibrational signals is acceleration. The description of key components of this test rig is listed in Table 1.
Table 1Key components and their specification
Items | Type | Description |
Motor | Z2-11 | D-C, Rated speed: 600 r/min |
Speed regulator | GLJ-01 | For motors of power 0.4-7.5 kW |
Vibration sensor | CA-DR-3005 | Three directions, range: ±50 ms-2 |
Inclination sensor | CXTA-02 | Range: ±20° |
Data-acquisition card | JK-U12 | Four differential channels |
Fig. 2Test rig
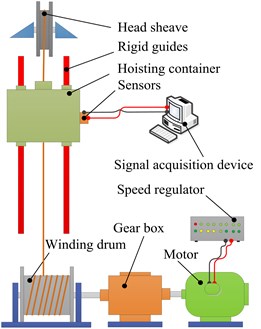
a) Schematic diagram
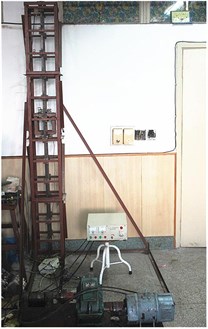
b) Picture of test rig
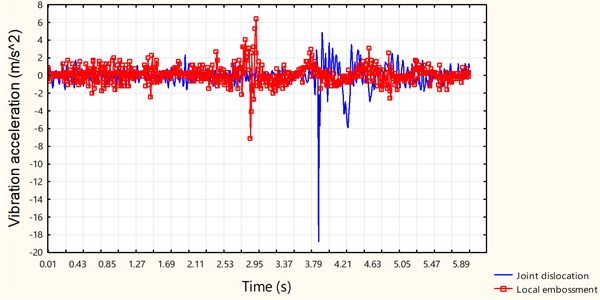
Fig. 3 shows an example of collected vibrational signals from the hoisting container while joint dislocation and local embossment take place. Given that both local embossment and joint dislocation cause sudden change to vibration, some pulses appear in both signals, which are hard to tell one from another. To conduct pattern recognition, some parameters must be put forward through the analysis on collected signals.
Fig. 3Collected vibration signals
3. Characteristic parameters
Different patterns of guides are simulated and then the needed signals are collected during each test. Data set can be obtained through the combination of some parameters of the collected signals and their corresponding pattern. The parameters acquired initially include the following features of collected signals: sampling time, the maximum value (Maximum), the mean value (Mean), the maximum value of wavelet transform modulus maximum ), the area between the curve of wavelet transform modulus maximum and its envelope [7], and inclination angle.
The maximum value (Maximum) and the mean value (Mean) of the signal are calculated with Eq. (1) and Eq. (2):
Wavelet transform of is:
where and are the scale factor and time shift factor, respectively, and is basic wavelet function.
The maximum value of is defined as:
The area between the curve of and can be calculated with Eq. (5):
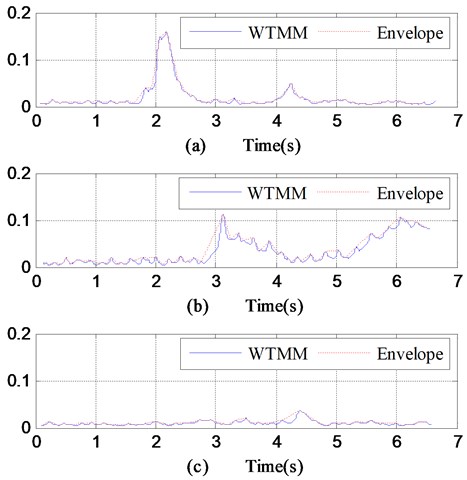
where and represent the beginning and ending moment and is the upper envelope of the curve of . Fig. 4 well illustrates the area . Fig. 4 refer to the three patterns: joint dislocation, local embossment, and normal pattern. The value of the normal pattern is larger than that of the other two patterns. Hence, can be adopted to identify the normal pattern but does not work for joint dislocation and local embossment. However, a deeper investigation has disclosed that the area between and its envelope is obviously different for joint dislocation and local embossment. This is why is calculated and regarded as one of the candidate parameters in the following identification.
Fig. 4WTMMs and envelopes of vibration signals collected while a) joint dislocation, b) local embossment, c) normal
For each experiment, the foregoing parameters and the pattern are recorded to form a dataset, a part of which is shown in Table 2. Actually, not every parameter in this table is able to make important contribution to the final recognition, so those with poor importance need to be found and skipped.
Table 2A part of the acquired dataset
No. | ST (s) | Maximum | Mean | WTMM | S | Inclination (°) | Fault pattern |
1 | 67 | 2.59 | 2.52 | 1.73 | 39.946 | 1.603 | Normal |
2 | 65 | 2.7 | 2.56 | 1.645 | 95.391 | 1.695 | Dislocation |
3 | 81 | 2.41 | 2.171 | 3.269 | 97.007 | 1.679 | Embossment |
4 | 76 | 2.57 | 2.58 | 1.612 | 46.485 | 6.794 | Inclination |
5 | 56 | 3.78 | 2.53 | 2.103 | 65.907 | 1.66 | Normal |
6 | 47 | 2.36 | 2.173 | 3.614 | 101.47 | 1.563 | Embossment |
ST: the sampling time; Maximum: the maximum value; Mean: the mean value; WTMM: the maximum value of Wavelet Transform Modulus Maximum; S: Area between the curve of Wavelet Transform Modulus Maximum and its upper envelop | |||||||
4. Importance and selection of parameters
The boosting-tree algorithm is adopted to evaluate the importance of each foregoing feature [8]. To observe the strength of the relationship between a feature and the dependent variable (fault pattern), chi-square value is used to denote the important index, which can be defined as Eq. (6):
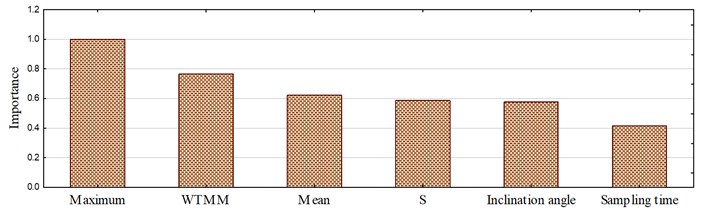
where is an observed value of a feature, and is an expected value of this feature under the null hypothesis that this feature and the dependent variable are completely independent. The larger a Chi-square value is, the more this hypothesis should be rejected, which shows a strong strength of the relationship between this predictor and the dependent. This feature should have a large important index. A bar graph of predictor importance presents the results, which is shown in Fig. 5. Obviously, the parameter of Maximum has the biggest importance index of 1, which illustrates that it contributes most to the classification in comparison with other predictors. In the other extremes, the sampling time of a signal has the smallest importance index of 0.41. While setting a threshold of 0.5, sampling time is skipped. Only those parameters with importance indexes higher than 0.5 are retained as predictors in later prediction models.
Fig. 5Importance of predictors
5. Algorithm selection
There are various algorithms that can be used in the classification. In this paper, classification specifically refers to the fault pattern recognition of guides. Which algorithm works best for this particular issue is the problem that needs to be solved first. For the sake of a higher precision, comparison among algorithms should be conducted [9-13]. In this paper, six algorithms are investigated. They are boosting tree, K-nearest neighbor (kNN), MARSpline, neural network, random forest, and support vector machine (SVM). Parameters for each algorithm are selected or optimized so that the performance comparison can be made under a condition of equitableness and rationality. As an example, for the neural network algorithm, the final network applied is successively obtained through two selections. The first one is performed by the computer, where five networks are retained after the evaluation and comparison of 200 networks that have been trained. The second selection should be made if more than one network is retained during the first selection. Performance and parameters of the retained networks are listed in Table 3. In the table, RBF means radical basis function neural networks, and RBFT refers to its training method. MLP is multi-layer perceptron networks, and BFGS is a quasi-Newton method proposed by Broyden, Fletcher, Goldfarb, and Shanno. Obviously, RBF 6-22-4 and RBF 6-26-4 have very close performance which are better than the others, so either of them can be taken as the final network and RBF 6-26-4 is actually chosen finally. The detailed parameters such as training algorithm and each function can be found in Table 2. Similar work is done for other algorithms. For SVM algorithm, its SVM type is classification type 1 with a capacity of 10, and its Kernel type is radial basis function with a gamma of 0.167.
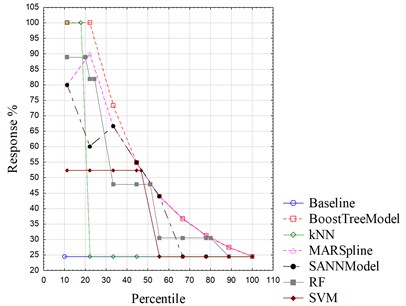
Each algorithm is used to extract a corresponding model from the same data set. Deployment of these six models shows their different precisions upon the recognition of guide patterns. Table 4 lists their different error rates. Apparently, the boosting-tree algorithm outperforms other algorithms with the lowest error rate. The kNN and the MARSpline algorithm are also pretty good in prediction, whereas the other three have obvious worse performance. More importantly, the highest error rate of random forest declares its unavailability for pattern recognition of rigid hoisting guides. Gain chart and lift chart can be used to visualize how well a predictive model works. Gain chart is the track of Gains vs. Percentile, and Lift chart is the track of Response vs. Percentile. Gains, Percentile, and Response are calculated in Eqs. (7)-(9):
where is the number of cases that are actual negative and predicted negative, is the number of cases that are actual negative but predicted positive, is the number of cases that are actual positive but predicted negative, and is the number of cases that are actual positive and predicted positive. “Positive” means that this case belongs to one fault pattern, whereas “negative” means that this case does not belong to one fault pattern. The bigger a Gains or a Response is, the better one model would be. As shown in Fig. 6 and Fig. 7, gain charts and lift charts of six models are plotted within the same boxes. Boosting tree is obviously the model which outperforms the others for it has the highest values of both gains and response. Through the comparison of error rates, gain charts, and lift charts, the boosting-tree algorithm is adopted finally, which takes more presentation in the next part.
Table 3Performance and parameters of the retained five networks
No. | Network | Training | Test | Validation | Algorithm | Error function | Hidden activation | Output activation |
1 | RBF 6-20-4 | 87.87879 | 100.0000 | 100.0000 | RBFT | Entropy | Gaussian | Softmax |
2 | MLP 6-22-4 | 87.87879 | 83.3333 | 100.0000 | BFGS 4 | Entropy | Tanh | Softmax |
3 | RBF 6-27-4 | 90.90909 | 83.3333 | 100.0000 | RBFT | Entropy | Gaussian | Softmax |
4 | RBF 6-22-4 | 90.90909 | 100.0000 | 100.0000 | RBFT | Entropy | Gaussian | Softmax |
5 | RBF 6-26-4 | 90.90909 | 100.0000 | 100.0000 | RBFT | Entropy | Gaussian | Softmax |
Table 4Error rate of different algorithms
Boosting tree | kNN | MARSpline | Neural network | Random forest | SVM |
0.044 | 0.067 | 0.089 | 0.156 | 0.778 | 0.244 |
Fig. 6Gain charts of different algorithms
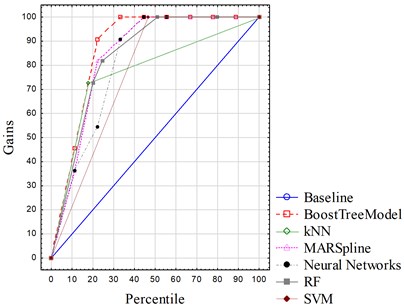
Fig. 7Lift charts of different algorithms
6. Pattern recognition based on boosting tree
The boosting-tree algorithm is actually an application of boosting method on decision trees [14-18], which can be used for both regression and classification prediction. Pattern recognition of rigid guides belongs to problems of classification here. The general idea of the boosting-tree algorithm is the calculation of a sequence of simple trees, among which each successive tree is built on prediction residual of the predicting tree. During each step of boosting, not only the best current partition is determined, but the prediction deviation from observation is also computed. The next tree performs another partition to further reduce this deviation. The only difference between classification and regression is that classification needs logistic transformation function to compute the residual during boosting process.
According to the result of parameter selection by importance, sampling time is skipped, and the other five are retained as continuous predictors to predict the dependent one, which is the pattern of rigid guides. The data set is divided into two parts: training and test. In this particular process, the proportion of random test data is set to 30 percent and the number of additive terms is set to 200. Fig. 8 shows the changing trend of the average multinomial deviance with the increase of tree number. The average multinomial deviance is computed by Eq. (10):
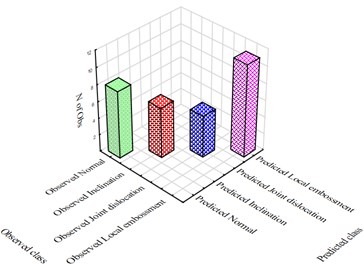
where is the number of training or test cases, is the prediction of the target value, and is the target values of the th case. The number of trees is the number of a series of simple decision trees that the boosting tree model has computed. The model was found to begin to overfit the data somewhere around the fortieth tree, after which the deviance increases gradually. For a balance between training precision and severity of overfitting, the optimized number of successive trees has been determined, which is 134 in this case. Fig. 9 shows the classification matrix . The height of a bar denotes the number of this sort of cases whose observed value is but predicted value is . or can be any one of the four patterns of rigid guides, that is, normal, inclination, joint dislocation, and local embossment. Some bars are only found on the diagonal of this matrix, which means that the recognition made is perfect.
Fig. 8Boosting process
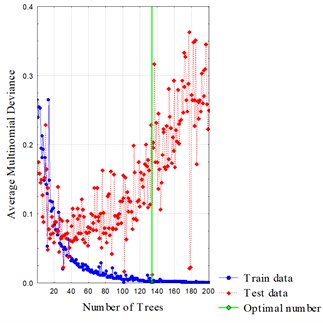
Fig. 9Classification matrix
7. Conclusions
A data-mining approach was applied in the pattern recognition of rigid hoisting guides. Classification was performed to determine whether faults occurred in rigid guides, such as joint dislocation, local embossment, or inclination, or whether the guides were currently in complete normal status. Six parameters were recorded after the analysis on signals collected by a test rig, which were used to form the sample dataset. The boosting-tree algorithm was used to select the parameters according to their importance of contribution to prediction. Then, error rate, gain chart, and lift chart were adopted to determine which algorithm works best among six different algorithms, which include boosting tree, kNN, MARSpline, neural network, random forest, and SVM. The results showed that the boosting tree model outperforms others, which was solely described in more details. As the main conclusion, the boosting-tree algorithm works efficiently with the pattern recognition of rigid guides.
References
-
Khan M., Krige G. Evaluation of the structural integrity of aging mine shafts. Engineering Structures, Vol. 24, Issue 7, 2002, p. 901-907.
-
Xiao X., Li Z., Zhang J. Study on fault mechanism of shaft hoist steelwork. The 6th International Conference on Mining Science and Technology, Xuzhou, China, 2009, p. 1351-1356.
-
Jiang Y., Xiao X., Li Z. Research on time-frequency analysis of steel guide dynamic test signals based on laplace wavelet. The 3rd International Congress on Image and Signal Processing, Yantai, China, 2010, p. 3443-3447.
-
Li Z. Study on Vibration Characteristics and Typical Faults Diagnosis of Hoisting System. Ph.D. Thesis, China University of Ming and Technology, Xuzhou, China, 2008.
-
Jiang Y. Research on Nonlinear Coupling Characteristics and Condition Assessment of Vertical Steel Guide System. Ph.D. Thesis, China University of Ming and Technology, Xuzhou, China, 2011.
-
Galloway L., Tiley P., Tiley G. The performance of fixed guidance systems in mine shafts. CIM Bulletin, Vol. 75, Issue 847, 1982.
-
Tse P., Peng Y., Yam R. Wavelet analysis and envelope detection for rolling element bearing fault diagnosis-their effectiveness and flexibilities. Journal of Vibration and Acoustics, Vol. 123, Issue 3, 2001, p. 303-310.
-
Kusiak A., Verma A. A data-mining approach to monitoring wind turbines. IEEE Transactions on Sustainable Energy, Vol. 3, Issue 1, 2012, p. 150-157.
-
Padhy N., Mishra P., Panigrahi N. The study of data mining applications and feature scope. International Journal of Computer Science, Engineering and Information Technology, Vol. 2, Issue 4, 2012, p. 43-58.
-
Kusiak A., Zheng H., Song Z. Short-term prediction of wind farm power: a data mining approach. IEEE Transactions on Energy Conversion, Vol. 24, Issue 1, 2009, p. 125-136.
-
Kusiak A., Li W. The prediction and diagnosis of wind turbine faults. Renewable Energy, Vol. 36, Issue 1, 2011, p. 16-23.
-
Kusiak A., Zhang Z., Verma A. Prediction, operations and condition monitoring in wind energy. Energy, Vol. 60, Issue 7, 2013, p. 1-12.
-
Kusiak A., Wei X. Prediction of methane production in wastewater treatment facility: a data-mining approach. Annals of Operations Research, Vol. 216, Issue 1, 2014, p. 71-81.
-
Lin G., Shen C., Hengel A. Supervised hashing using graph cuts and boosted decision tree. IEEE Transactions on Pattern Analysis and Machine Intelligence, Vol. 37, Issue 11, 2015, p. 2317-2331.
-
Zheng Z., Webb G., Ting K. Integrating boosting and stochastic attribute selection committees for further improving the performance of decision tree learning. 10th IEEE International Conference on Tools with Artificial Intelligence, Taipei, 1998, p. 216-223.
-
Birkbeck N., Sofka M., Zhou S. Fast boosting trees for classification, pose detection, and boundary detection on a GPU. Computer Society Conference on Computer Vision and Pattern Recognition Workshops (CVPRW), Colorado, USA, 2011, p. 36-41.
-
Grossmann E. AdaTree: Boosting a weak classifier into a decision tree. Computer Society Conference Vision and Pattern Recognition Workshops (CVPRW), Washington, DC, USA, 2004, p. 105.
-
Farid D., Maruf G., Rahman C. A new approach of boosting using decision tree classifier for classifying noisy data. International Conference on Informatics, Electronics and Vision (ICIEV), Dhaka, Bangladesh, 2013, p. 1-4.
About this article

This work was supported by the Fundamental Research Funds for the Central Universities (Grant Number 2014QNB19), A Project Funded by the Priority Academic Program Development of Jiangsu Higher Education Institutions and National Natural Science Foundation of China (Grant Number 51675520). Professor Andrew Kusiak provided the data-mining software, which has substantially contributed to this paper. Sincere appreciation is extended to him and also to the reviewers of this paper for their helpful comments.
