Abstract
With common horseshoe cavern in underground engineering as the prototype, three single-hole blasting model experiments have been carried out. And coupled SPH-FEM approach is adopted for analyzing the limit effect of pre-excavated horseshoe cavern on blasting crater. During the experiment, the blasting vibration signals on the top surface of cemented sand model have been recorded. Then Hilbert-Huang transform has been applied to analyzing the time-frequency characteristics of recorded blasting vibration signals. Both experiment results and numerical cases indicate that the range of blasting crater is controlled effectively by pre-excavating horseshoe cavern, and the limit effect of pre-excavating on blasting crater has a close connection with its length. Moreover, the 50 mm pre-excavated horseshoe cavern presents an amplification effect in blasting vibration effect both along the blasthole direction and perpendicular to the blasthole direction, and it also demonstrates a weaken effect in the main blasting vibration frequency of vertical blasting vibration signal. HHT analyses of vertical blasting vibration signals show that single-hole blasting vibration signals present a centralized distribution in time domain and an uneven distribution in frequency domain. The dominant energy of blasting vibration signal is distributed in several IMF components, where main blasting vibration frequency locates. When cutting the charge, the blasting vibration effect will be reduced, while the main blasting vibration frequency of blasting vibration signal will be increased.
1. Introduction
It is widely acknowledged that engineering blasting is a special method for engineering construction. However, the blasting vibration effect during blasting working is the most drawbacks of the technology and is of great concern to inhabitants in the vicinity of the work [1, 2]. Blasting vibration effect has become an important hazard problem in blasting engineering [3].
Blasting vibration signal analysis is one of the important foundations for studying the control technology of blasting vibration damage. According to the basic features of blasting vibration signal, Ling et al. [4] proposed a new wavelet basis construction method based on separated blasting vibration signal and verified its feasibility by comparing the practical effect with other known wavelets in signal processing. For delay time errors of electric detonators, Han and Ma [5] identified the real delay time in millisecond blasting by time-energy analysis based on wavelet transform. After analyzing the relation between blasting parameters and blasting vibration signal, it was found that reasonable millisecond delay time could reduce the peak particle velocity of blasting vibration effectively. Zhao et al. [6] studied the time-frequency characteristics of blasting vibration signals in milliseconds by combination of RSPWVD and wavelet. The length of delay time affected the energy distribution of blasting vibration signals and duration of energy in frequency bands. Zhong et al. [7] carried out energy spectrum analysis for blasting vibration signal by wavelet packet analysis technology, and the signals were measured under different explosion parameters, such as the maximal section dose, the distance of blasting source to measuring point and the section number of millisecond detonator. To alleviate blasting vibration effect during vertical shaft excavation, Ma et al. [8] carried out millisecond blasting model experiment with two-circle vertical blastholes based on similarity theory. Zhang et al. [9] applied Hilbert-Huang transform (HHT) to analyze the blasting vibration signal. It showed that HHT method could draw time-frequency characteristics form blasting vibration signal and was more adaptive than other methods.
At present, geomechanical model experiment has become a significant way to carry out research work for large geotechnical engineering and underground engineering [10, 11]. With common horseshoe cavern in underground engineering as the prototype, three single-hole blasting model experiments have been carried out with cemented sand similar materials according to Froude’s similarity law. Then numerical simulations have been conducted by coupled SPH-FEM approach. During the experiment, the blasting vibration effect on the top surface of cemented sand model have been monitored. Then Hilbert-Huang transform has been applied to analyzing the time-frequency characteristics of recorded blasting vibration signals.
2. Design of single-hole blasting model experiment
2.1. Preparation of cemented sand model
Common horseshoe cavern in underground engineering is selected as the prototype. According to Froude’s similarity law, the geometrical similarity ratio is 25 and the strength similarity ratio is 36. The height and width of practical horseshoe cavern in underground engineering are 3.88 m and 5.00 m respectively. Thus, the corresponding height and width of model horseshoe cavern are 155 mm and 200 mm respectively.
Cemented sand similar material has been used as a material simulating rock to fabricate experimental models with dimensions of 1000 mm×1000 mm×200 mm [12, 13]. Cemented sand similar material is made with sand as aggregate and P.C 32.5 composite Portland cement and gypsum as binder. The mass ratio of sand, Portland cement, gypsum, and water is 1:0.08:0.05:0.10. After curing 21 days, the single-hole blasting model experiments have been carried out. Before the experiment, the compressive strength of cemented sand similar material is tested, its value is 3.44 MPa.
2.2. Experimental scheme of single-hole blasting model
There is only one blasthole in the geometrical center of horseshoe cavern. The diameter and depth of blasthole are 10 mm and 110 mm respectively. During the experiment, only one electric detonator is charge in blasthole, and the rest length of blasthole is filled with mud. Two kinds of electric detonators are used. One is charged with 1.0 g RDX, and the other is charged with 0.3 g RDX. When electric detonator charged with 1.0 g RDX is used, two experiments have been carried out, with or without 50 mm pre-excavated horseshoe cavern. When electric detonator charged with 0.3 g RDX is used, one experiment has been carried out with 50 mm pre-excavated horseshoe cavern. Experimental scheme of single-hole blasting model is shown in Table 1.
Table 1Experimental scheme of single-hole blasting model
Number of single-hole blasting model | Explosive charge | Length of pre-excavated horseshoe cavern |
S-1 | 1.0 g RDX | 0 mm |
S-2 | 1.0 g RDX | 50 mm |
S-3 | 0.3 g RDX | 50 mm |
2.3. Arrangement of blasting vibration measuring points
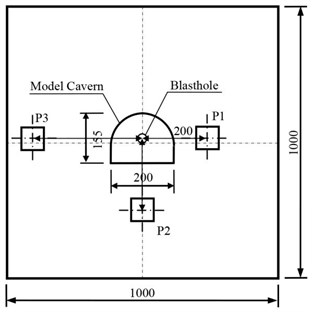
In the experiment, the blasting vibrations induced by single-hole blasting are propagated in cemented sand similar materials. Three NUBOX-6016 intelligent blasting vibration monitors and matching TP3V-4.5 three-dimensional velocity sensors are applied to record the blasting vibration signals in single-hole blasting model experiments [14]. Three TP3V-4.5 three-dimensional velocity sensors are placed on the top surface of cemented sand model, which can be seen in Fig. 1. The distance of three TP3V-4.5 three-dimensional velocity sensors to blasthole are 200 mm, 300 mm, and 400 mm, which are marked as P1, P2, and P3 respectively. In order to record the blasting vibration signals reliably, vaseline is adopted as couplant to fix the TP3V-4.5 three-dimensional velocity sensors on the top surface of cemented sand model [15]. The highest sampling rate of NUBOX-6016 intelligent blasting vibration monitor is 200 kHz, and the maximum achievable sampling rate under floating point mode is 50 kHz. The peak particle velocity range of detectable blasting vibration is from –30 cm/s to +30 m/s. During the experiment, the sample rate and sampling length of NUBOX-6016 intelligent blasting vibration monitor are set as 10 kHz and 1.0 s respectively.
Fig. 1Arrangement of blasting vibration measuring points on top surface of model (Unit: mm)
3. Blasting crater of single-hole blasting model
3.1. Blasting carter of model experiments
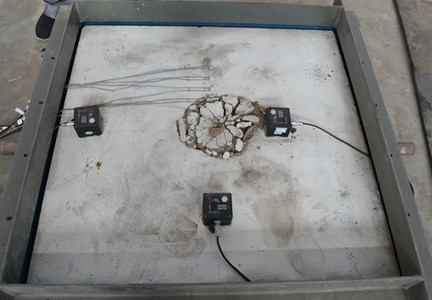
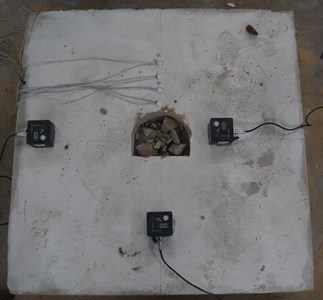
Three cemented sand models after single-hole blasting experiment are shown in Fig. 2. None cracks have been found on the surface of cemented sand model.
The average crater radius of single-hole blasting model S-1 is 136 mm, which is much bigger than the size of model horseshoe cavern. While the blasting craters of both single-hole blasting model S-2 and S-3 are all in the range of model horseshoe cavern, which indicates that the 50 mm pre-excavated horseshoe cavern can control the range of blasting crater effectively.
3.2. Blasting crater of numerical cases
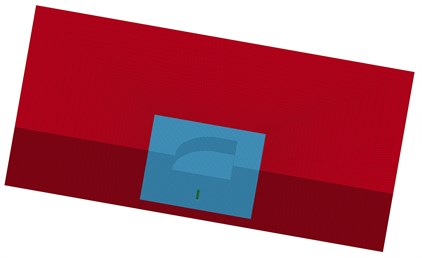
The numerical simulations of single-hole blasting are carried out by using LS-DYNA, and the coupled smoothed particle hydrodynamics-finite element method (SPH-FEM) approach is adopted for assessing the blasting results from model experiments [16-18]. In the study, SPH is used for explosion charges and near zone in large deformation, while FEM is used for far zone. For the contact interaction of FEs and SPH particles, Tie_nodes_to_surface is adopted for the coupling algorithm. During the calculation, SPH particles are joined with FEs as a single node. Owing to the symmetry about plane, only a half of single-hole blasting model is set up, shown in Fig. 3.
Fig. 2Three cemented sand model after single-hole blasting experiment
a) Single-hole blasting model S-1
b) Single-hole blasting model S-2
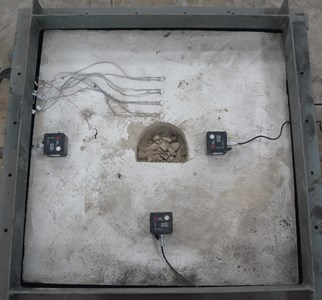
c) Single-hole blasting model S-3
Fig. 3Coupled SPH-FEM model
In order to analyze the limit effect of pre-excavated segment on blasting crater, four numerical cases have been performed, shown in Table 2.
Table 2Numerical cases of single-hole blasting model
Number of numerical case | Explosive charge | Length of pre-excavated segment |
N-1 | 1.0 g RDX | 0 mm |
N-2 | 1.0 g RDX | 13.0 mm |
N-3 | 1.0 g RDX | 26.1 mm |
N-4 | 1.0 g RDX | 48.9 mm |
The material models used in single-hole blasting simulation include explosive (RDX) and cemented sand similar material.
For explosive (RDX), material model High-explosive-burn and equation of state Jones-Wilkins-Lee (JWL) are used. Parameters of RDX explosive are listed in Table 3.
For cemented sand similar material, material model Johnson-Holmquist-Concrete (HJC) is used [19]. Parameters of cemented sand similar material are listed in Table 4.
Table 3Parameters of RDX explosive
/ (g·cm-3) | / (m·s-1) | / GPa | / GPa | / GPa | / GPa | |||
1.60 | 6950 | 6.125 | 524 | 7.678 | 4.2 | 1.1 | 0.34 | 8.5 |
Table 4Parameters of cemented sand similar material
/ (g·cm-3) | / GPa | / MPa | / MPa | ||||||
1.80 | 0.931 | 3.44 | 0.39 | 0.79 | 1.60 | 0.007 | 0.61 | 4.0 | 0.00146 |
/ s-1 | / MPa | / GPa | / GPa | / GPa | / GPa | ||||
1.0×10⁻⁶ | 1.15 | 0.000676 | 0.045 | 1.0 | 1 | 0.1 | 85 | –171 | 208 |
3.3. Effect of pre-excavated segment on blasting crater
Taking numerical case N-4 as example, the evolution of blasting crater for pre-excavated model at different times (50 μs, 300 μs and 800 μs) are shown in Fig. 4.
Fig. 4Formation of blasting crater for pre-excavated model
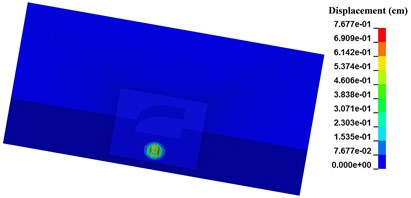
a) 50 μs
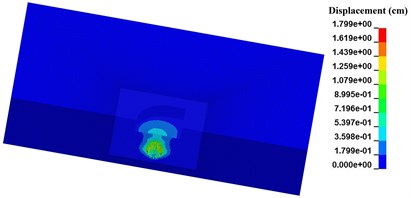
b) 300 μs
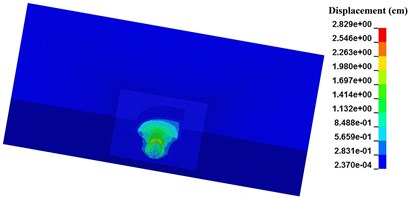
c) 800 μs
It can be seen that the blasting crater expands outward equably when explosive detonating. And the initial shape of blasting crater turns to be a sphere. After the explosive stress wave reaches the upper free surface, the shape of blasting crater is changed into an inverted cone for reflected tensile wave. This agrees well with the general recognition about blasting crater [16].
The final shape of blasting crater for four numerical cases are shown seen in Fig. 5. Compared with Fig. 2, numerical results agree well with experiment results.
Seen from Fig. 5, with the length of pre-excavated horseshoe cavern increasing, SPH particles in the range of blasting crater are less. Besides the SPH particles below the pre-excavated horseshoe cavern, SPH particles near the vault and floor of pre-excavated horseshoe cavern in both numerical case N-2 and N-3 still get a separation velocity. While in numerical case N-4, SPH particles with separation velocity are all limited in a certain zone, just below the pre-excavated horseshoe cavern. Considering the range and velocity value of SPH particles around pre-excavated horseshoe cavern, numerical cases decreases in the following order, numerical case N-1, numerical case N-2, numerical case N-3, and numerical case N-4. Therefore, the limit effect of pre-excavating on blasting crater has a close connection with its length. While the maximum velocity of SPH particles around explosive presents a weak correlation with length of pre-excavated horseshoe cavern.
Combined experiment results and numerical cases, it can be seen that the range of blasting crater in certain explosive charge can be controlled in a limited zone by pre-excavating, and its limit effect has a close connection with its length. The longer the pre-excavated horseshoe cavern is, the more effective the limit effect of pre-excavating on blasting crater is.
Fig. 5Relation between length of pre-excavated segment and diameter of blasting crater
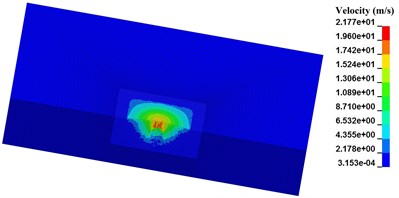
a) N-1, 1000 μs
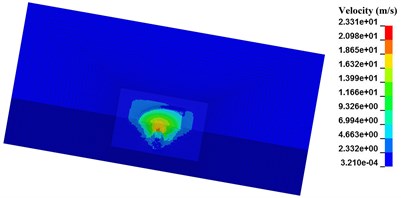
b) N-2, 1000 μs
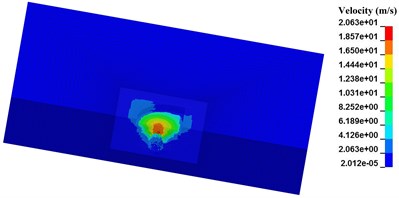
c) N-3, 1000 μs
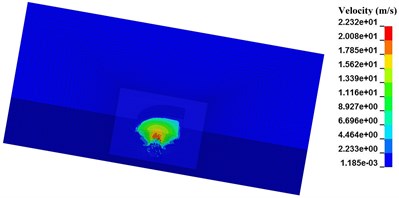
d) N-4, 1000 μs
4. Time-frequency analyses of blasting vibration signals in single-hole blasting
4.1. Blasting vibration signals in single-hole blasting model experiment
During the experiment, blasting vibration signals in three directions have been recorded by TP3V-4.5 three-dimensional velocity sensors and intelligent blasting vibration monitors. The three directions are along the blasthole direction, perpendicular to the blasthole direction, and vertical direction, which are marked as , , and respectively in TP3V-4.5 three-dimensional velocity sensor. Recorded blasting vibration signals in three directions at measuring point P2 of single-hole blasting model S-2 is shown in Fig. 6. The peak particle velocity of blasting vibration signals in single-hole blasting model experiments are shown in Table 5.
Seen from Fig. 6 and Table 5, the peak particle velocity of blasting vibration signal in the vertical direction is the biggest in three directions, while the peak particle velocity of blasting vibration signal perpendicular to the blasthole direction is the smallest in three directions. Therefore, the blasting vibration effect order from strong to weak in three direction is vertical direction, along the blasthole direction, and perpendicular to the basthole direction.
When electric detonator charged with 1.0 g RDX is used, the peak particle velocity of blasting vibration signals along the blasthole direction and perpendicular to the blasthole direction for single-hole blasting model S-2 are slightly bigger than those for single-hole blasting model S-1. Hence, the 50 mm pre-excavated horseshoe cavern has an amplification effect in blasting vibration effect both along the blasthole direction and perpendicular to the blasthole direction. While when electric detonator charged with 0.3 g RDX is used, the peak particle velocity of blasting vibration signals in three directions for single-hole blasting model S-3 are much smaller than those for single-hole blasting model S-2.
Fig. 6Recorded blasting vibration signal at measuring point P2 of single-hole blasting model S-2
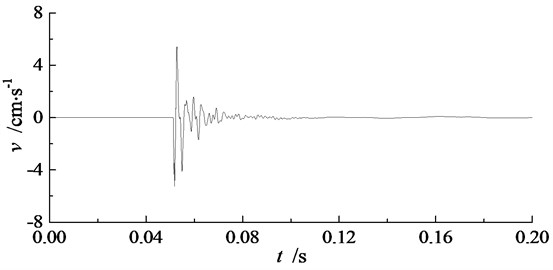
a) Along the blasthole direction
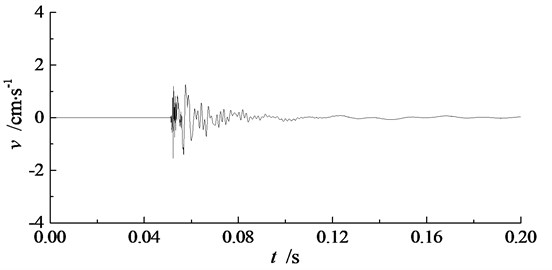
b) Perpendicular to the blasthole direction
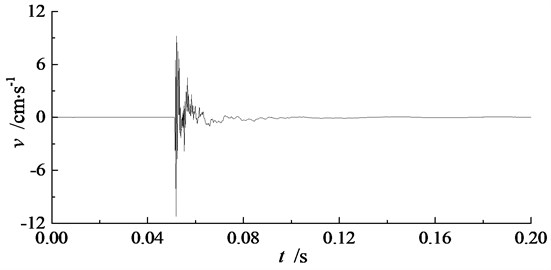
c) Vertical direction
Table 5Peak particle velocity of blasting vibration signals in single-hole blasting model experiments
Number of single-hole blasting model | Measuring point | Peak particle velocity /(cm·s-1) | ||
Along the blasthole direction | Perpendicular to the blasthole direction | Vertical direction | ||
S-1 | P1 | 3.142 | 1.292 | – |
P2 | 4.319 | 1.021 | 11.619 | |
P3 | – | – | – | |
S-2 | P1 | 6.064 | 1.836 | 7.100 |
P2 | 5.406 | 1.550 | 11.224 | |
P3 | 4.091 | 1.502 | 5.810 | |
S-3 | P1 | 1.840 | 0.683 | 3.794 |
P2 | 1.673 | 0.748 | 8.810 | |
P3 | 1.734 | 0.706 | 5.741 | |
4.2. Introduction of Hilbert-Huang transform
As blasting vibration signal is a short-time nonstationary random signal, several kinds of analyzing methods have been put forward for blasting vibration signal processing, such as Fourier transform, short-time Fourier transform, wavelet transform, and Hilbert-Huang transform [20]. Hilbert-Huang transform (HHT) takes advantage of the local information of a signal at a certain time to obtain its instantaneous information. Therefore, HHT method is a localized time and frequency analysis method, which is more adaptive than wavelet transform [21]. Hilbert-Huang transform consists of two main parts, empirical mode decomposition (EMD) and Hilbert transform [21].
Firstly, empirical mode decomposition has been carried out for blasting vibration signals. Then a set of intrinsic mode function (IMF) components in frequency order from high to low and a residue are obtained. With the help of fast Fourier transform, the frequency spectra of each IMF component are also achieved.
After empirical mode decomposition, Hilbert transform has been performed for each IMF component. Hence, the instantaneous frequency spectra of IMF components are got. The HHT time-frequency spectrum is achieved by combining all instantaneous frequency spectra.
Taking vertical blasting vibration signals at measuring point P2 as example, Hilbert-Huang transform has been carried out for three single-hole blasting models to get their time-frequency characteristics.
4.3. Empirical mode decomposition of blasting vibration signals in single-hole blasting
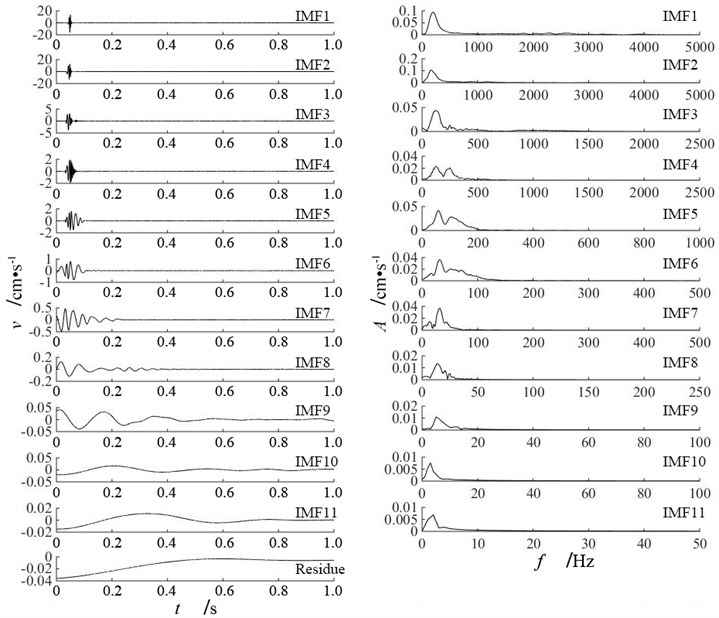
Empirical mode decomposition has been carried out for vertical blasting vibration signals at measuring point P2 of three single-hole blasting models. Then the IMF components of three single-hole blasting models have been obtained. Fig. 7 presents the 11 IMF components with corresponding frequency spectra and one residue of vertical blasting vibration signals at measuring point P2 of single-hole blasting model S-1. The Energy percentage and frequency of IMF components of vertical blasting vibration signals at measuring point P2 of three single-hole blasting models are presented in Table 6.
Table 6Energy percentage and frequency of IMF components of vertical blasting vibration signals at measuring point P2 of three single-hole blasting models
IMF components | S-1 | S-2 | S-3 | |||
/ % | / Hz | / % | / Hz | / % | / Hz | |
IMF1 | 41.46 | 206 | 29.55 | 158 | 32.96 | 202 |
IMF2 | 47.37 | 165 | 34.49 | 126 | 20.45 | 182 |
IMF3 | 5.01 | 122 | 16.13 | 113 | 24.17 | 122 |
IMF4 | 1.99 | 121 | 11.22 | 71 | 11.06 | 97 |
IMF5 | 2.56 | 59 | 3.41 | 60 | 1.74 | 83 |
IMF6 | 0.99 | 32 | 3.78 | 41 | 6.32 | 33 |
IMF7 | 0.53 | 31 | 0.73 | 23 | 1.91 | 22 |
IMF8 | 0.04 | 14 | 0.54 | 13 | 0.9 | 13 |
IMF9 | 0.01 | 5 | 0.12 | 9 | 0.04 | 8 |
IMF10 | 0.01 | 3 | 0.01 | 3 | 0.05 | 5 |
IMF11 | 0.01 | 2 | 0.01 | 2 | 0.09 | 3 |
IMF12 | – | – | – | – | 0.05 | 2 |
Note: 1) IMF1 represents the first IMF component of blasting vibration signal; 2) is the energy percentage of IMF component to total blasting vibration signal, %; 3) is the average frequency of IMF component, Hz | ||||||
Seen from Fig. 7 and Table 6, the dominant energy of blasting vibration signals are mainly distributed in several IMF components, where main vibration frequency locates. For single-hole blasting model S-1, the dominant energy of vertical blasting vibration signal at measuring point P2 is distributed in IMF1 and IMF2. For single-hole blasting model S-2 and S-3, the dominant energy of vertical blasting vibration signal at measuring point P2 is distributed in IMF1, IMF2, IMF3 and IMF4. However, the energy percentage and frequency band of IMF components are different for single-hole blasting model S-2 and S-3.
Fig. 7IMF components and frequency spectra of vertical blasting vibration signal at measuring point P2 of single-hole blasting model S-2
4.4. Time-frequency spectra of blasting vibration signals in single-hole blasting
After empirical mode decomposition, Hilbert transform has been performed for each IMF component to get instantaneous frequency spectra. Then the HHT time-frequency spectra are obtained by combining all instantaneous frequency spectra. Fig. 8 is the HHT time-frequency spectra of vertical blasting vibration signals at measuring point P2 of three single-hole blasting models. The analyses of IMF component energy distribution and frequency indicates that the frequency domain of blasting vibration signal is within 1000 Hz, thus the frequency range in Fig. 8 is from 0 to 1000 Hz.
Seen from Fig. 8, the HHT time-frequency spectra describe the distribution of blasting vibration signal in both time and frequency domain clearly, which indicates a perfect capacity in localization analyses. Single-hole blasting vibration signals presents a centralized distribution in time domain and an uneven distribution in frequency domain.
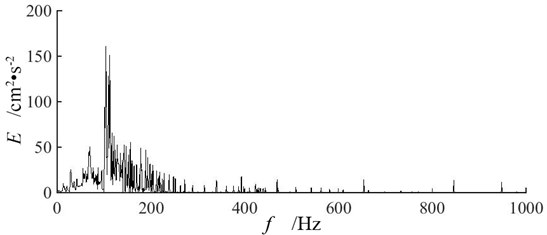
Hilbert marginal energy spectra demonstrate the distribution of blasting vibration signal in frequency domain directly [22]. Fig. 9 presents the Hilbert marginal energy spectra of vertical blasting vibration signals at measuring point P2 of three single-hole blasting models. Multi-peaks in the Hilbert marginal energy spectra correspond to the main frequencies of blasting vibration signal.
Fig. 8HHT time-frequency spectra of vertical blasting vibration signals at measuring point P2 of three single-hole blasting models
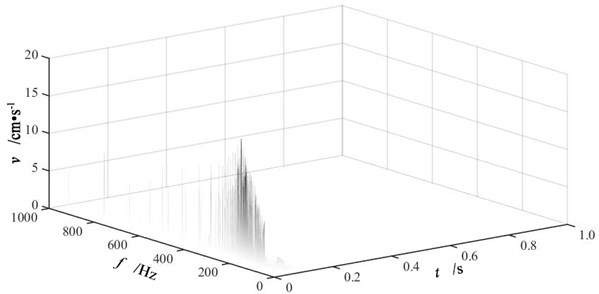
a) Single-hole blasting model S-1
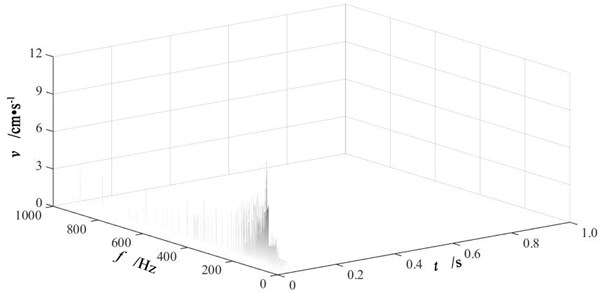
b) Single-hole blasting model S-2
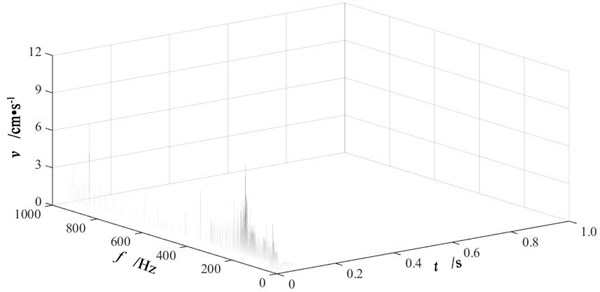
c) Single-hole blasting model S-3
Combining the experiment results in Table 6 and Fig. 9, it can be found that single-hole blasting vibration signals are abundant and distributed unevenly in frequency domain. The dominant energy of blasting vibration signal is distributed in a range of frequency band where main blasting vibration frequency locates. For single-hole blasting model S-1, the dominant energy of vertical blasting vibration signal is distributed in frequency band from 165 Hz to 224 Hz, and its main blasting vibration frequency is 209 Hz. For single-hole blasting model S-2, the dominant energy of vertical blasting vibration signal is distributed in frequency band from 71 Hz to 158 Hz, and its main blasting vibration frequency is 104 Hz. For single-hole blasting model S-3, the dominant energy of vertical blasting vibration signal is distributed in frequency band from 97 Hz to 202 Hz, and its main blasting vibration frequency is 152 Hz. Therefore, the 50 mm pre-excavated horseshoe cavern reduces the main blasting vibration frequency of vertical blasting vibration signal. While cutting the charge magnifies the main blasting vibration frequency of vertical blasting vibration signal.
Fig. 9Hilbert marginal energy spectra of vertical blasting vibration signals at measuring point P2 of three single-hole blasting models
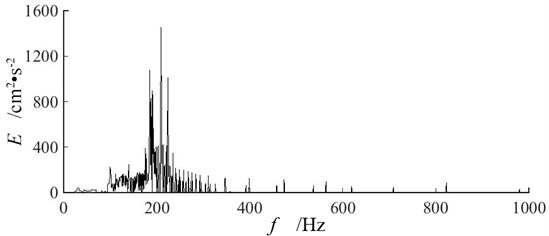
a) Single-hole blasting model S-1
b) Single-hole blasting model S-2
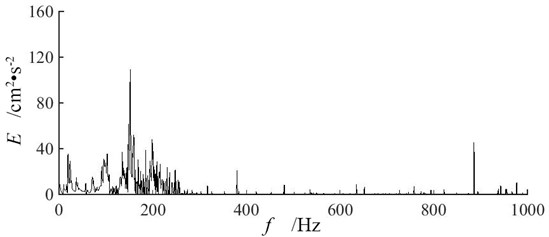
c) Single-hole blasting model S-3
5. Conclusions
Both experiment results and numerical cases indicate that the range of blasting crater are controlled effectively by pre-excavating horseshoe cavern, and the limit effect of pre-excavating on blasting crater has a close connection with its length. The longer the pre-excavated horseshoe cavern is, the more effective the limit effect of pre-excavating on blasting crater is. Moreover, the 50 mm pre-excavated horseshoe cavern presents an amplification effect in blasting vibration effect both along the blasthole direction and perpendicular to the blasthole direction, and it also demonstrates a weaken effect in the main blasting vibration frequency of vertical blasting vibration signal. HHT analyses of vertical blasting vibration signals show that single-hole blasting vibration signals presents a centralized distribution in time domain and an uneven distribution in in frequency domain. Single-hole blasting vibration signals are abundant and distributed unevenly in frequency domain. The dominant energy of blasting vibration signal is distributed in several IMF components, where main blasting vibration frequency locates. When cutting the charge, the blasting vibration effect will be reduced, while the main blasting vibration frequency of blasting vibration signal will be increased.
References
-
Wang T. C., Lee C. Y., Wang I. T. Analysis of blast-induced ground vibration under surface explosion. Journal of Vibroengineering, Vol. 16, Issue 5, 2014, p. 2508-2518.
-
Blair D. P. Blast vibration dependence on charge length, velocity of detonation and layered media. International Journal of Rock Mechanics and Mining Sciences, Vol. 65, 2014, p. 29-39.
-
Singh P. K., Roy M. P., Paswana Ranjit K., Dubey R. K., Drebenstedt C. Blast vibration effects in an underground mine caused by open-pit mining. International Journal of Rock Mechanics and Mining Sciences, Vol. 80, 2015, p. 79-88.
-
Ling T. H., Zhang S., Chen Q. Q., Li J. Wavelet basis construction method based on separation blast vibration signal. Journal of Central South University, Vol. 22, Issue 7, 2015, p. 2809-2815.
-
Han B., Ma Q. Y. Research on testing and controlling techniques of millisecond delay blasting vibration in coal mine rock roadway. Journal of China Coal Society, Vol. 38, Issue 2, 2013, p. 209-214.
-
Zhao M., Zhang J., Yi C. Time-frequency characteristics of blasting vibration signals measured in milliseconds. Mining Science and Technology, Vol. 21, Issue 3, 2011, p. 349-352.
-
Zhong G. S., Ao L. P., Zhao K. Influence of explosion parameters on wavelet packet frequency band energy distribution of blast vibration. Journal of Central South University, Vol. 19, Issue 9, 2012, p. 2674-2680.
-
Ma Q. Y., Yuan P., Zhang J. S., Han B. Blasting vibration measurement and analyses of millisecond blasting models for vertical shaft blasting. Journal of Vibration and Shock, Vol. 34, Issue 6, 2015, p. 172-176.
-
Zhang Y. P., Li X. B. Application of Hilbert-Huang transform in blasting vibration signal analysis. Journal of Central South University (Science and Technology), Vol. 36, Issue 5, 2005, p. 882-887.
-
Xu Y., Yuan P. Model test of zonal disintegration in deep rock under blasting load. Chinese Journal of Rock Mechanics and Engineering, Vol. 34, Issue 2, 2015, p. 3844-3851.
-
Zhu W. S., Zhang Q. B., Zhu H. H., Li Y., Yin J. H., Li S. C., Sun L. F., Zhang L. Large-scale geomechanical model testing of an underground cavern group in a true three-dimensional (3-D) stress state. Canadian Geotechnical Journal, Vol. 47, Issue 9, 2010, p. 935-936.
-
Yuan P., Xu Y. Influence of curing time to compressive properties of cemented sand similar materials. Journal of Vibration and Shock, Vol. 34, Issue 13, 2015, p. 200-204.
-
Yuan P., Xu Y. Dynamic compressive characteristics of cemented sand similar material in uniaxial state and passive confining state. Electronic Journal of Geotechnical Engineering, Vol. 20, Issue 23, 2015, p. 11717-11728.
-
Yuan P., Xu Y. Time-frequency characteristics of single-hole blasting vibration signals in model experiment. Science Technology and Engineering, Vol. 15, Issue 34, 2015, p. 13-18.
-
Segarra P., López L. M., Sanchidrián J. A. Uncertainty in measurements of vibrations from blasting. Rock Mechanics and Rock Engineering, Vol. 45, Issue 6, 2012, p. 1119-1126.
-
Xu J. X., Liu X. L. Analysis of structural response under blast loads using the coupled SPH-FEM approach. Journal of Zhejiang University Science A, Vol. 9, Issue 9, 2008, p. 1184-1192.
-
Wang W. G., Chen Y. M., Liu H. L., Zhang Z. C. Numerical simulation of explosion in soil based on a coupled SPH-FEM algorithm. Rock and Soil Engineering, Vol. 34, Issue 7, 2013, p. 2104-2110.
-
Wang W. G., Chen Y. M., Yang G., Liu Y. C. Field test and numerical simulations of blast-induced crater in wet sands. Chinese Journal of Rock Mechanics and Engineering, Vol. 35, Issue 1, 2016, p. 68-75.
-
Ji C., Long Y., Fang X. Numerical simulation for projectile penetrating steel fiber reinforced concrete with FEM-SPH coupling algorithm. Journal of Vibration and Shock, Vol. 29, Issue 7, 2010, p. 69-74.
-
Li X. B., Ling T. H., Zhang Y. P. Analysis of Blast Vibration Signals – Theories and Methods. Science Press, Beijing, 2009.
-
Huang N. E., Shen S. S. P. The Hilbert-Huang Transform and Its Applications. World Scientific Publishing Co. Pte. Ltd., Singapore, 2005.
-
Guan X. L., Yan J. L. The HHT time-frequency power spectrum analysis of the blasting vibration signal. Explosion and Shock Waves, Vol. 22, Issue 5, 2012, p. 535-541.
Cited by
About this article

This research was funded by National Natural Science Foundation of China (No. 51174004, No. 51374012). This research was also funded by Open Project Program Foundation of Engineering Research Center of Underground Construction, Ministry of Education (Anhui University of Science and Technology) (No. 2015KF02).
The authors declare no conflict of interest.
