Abstract
Peak ground velocity (PGV) has many applications in engineering seismology and earthquake engineering but there are relatively few prediction equations for this parameter in comparison with the large numbers of equations for estimating peak ground acceleration [1, 2]. The purpose of this study is to derive the attenuation relationships for larger horizontal component () and geometric mean horizontal component () of PGV for Iran. In the present paper new attenuation relations are proposed based on 484 strong motion recordings from earthquakes in Iran. The prediction equations were derived by regression method. The data set used consists of records with magnitudes 4.57.4 and epicentral distances 1 km 150 km. The theoretical-empirical Relationships obtained in this study is one of the first Studies in PGV field for Iran and is comparable with the world famous relations. Comparisons with other predictive relations from other regions are also carried out.
1. Introduction
Iran is a developing country in which a large number of important structures are being built. Iran is one of the most seismic countries of the world. It is situated over the Himalayan-Alpide seismic belt and is one of those countries, which have lost many human lives and a lot of money due to occurrence of earthquakes. Seismic hazard assessment is commonly based on empirical predictive attenuation relations. Such relations are generally expressed as mathematical functions relating a dependent variable to parameters characterizing the earthquake source, propagation path and local site conditions.
The purpose of this study is to derive the attenuation relationships for larger horizontal component () and geometric mean horizontal component (PGVGM) of PGV for Iran. Peak ground velocity has many applications in earthquake engineering and seismology but there are a few equations for predicting this parameter. Quantitative models for predicting these parameters are given in the world. PGVs are often estimated by scaling of response spectral ordinates, which is a very unsatisfactory but widely used approach that has resulted, in large part, from the relative lake of PGV prediction equations. PGV has many applications in engineering seismology and earthquake engineering [1]. Some of PGV important applications are as follows.
PGV has been found to correlate well with earthquake damage to buried pipelines [3]. Found that PGV correlates well with higher values of modified Mercalli in tensity (MMI), [4]. Newmark has used PGV to create elastic design spectrum (Newmark et al, 1973) [5]. There is an engineering need to predict Peak ground velocity for certain structures (e.g., long span bridges, dams). Expensive works has been done on the importance of , ratio is the world. These two ratio are important to determine the periods of acceleration, velocity and displacement control. Also to obtain parameters such as PGV is needed. This ratio shows ground motion and response spectrum specifications.
PGV is better parameter to assess the damage to PGA for structures that are sensitive to the load in the middle frequencies (such long or flexible structures, Bridges). PGV has also been included as a parameter in some recent methods for estimating the potential for soil liquefaction [6, 7]. PGV is used for designing tunnels.
2. Data used
One of the most important steps in developing an attenuation model is having a suitable catalog of earthquakes. A suitable catalog of earthquake record is one that has enough number of data components that allow for regression of a curve.
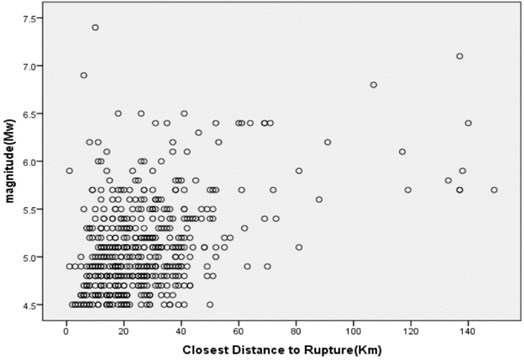
The data used in the present study consist of 484 strong motion recordings in Iran. This data set come from all the available accelerograms in Iran, during the period 1976-2014. The moment magnitude () for magnitude scale is used. Earthquakes was more than 4.5 in moment magnitude scale were considered. The reason for this was the greater amount of accuracy for such earthquakes and the importance of developing the model for such earthquakes. After removal of earthquakes with moment magnitude less than 4.5 Richter and greater distances from 150 km (4.57.4 and 1149), 484 record by three components of ground motions were selected from all over Iran.
In Fig. 1 the distribution of moment magnitude with epicentral distance () of the recordings used in this study is shown.
Fig. 1Magnitude-distance distribution of the strong motion records used in this study
3. Results and analysis
The prediction equations were derived by regression method. The model of the attenuation relationships is:
where unit is in (cm/s), is moment magnitude, is closest distance to rupture and unit in (Km), is Std. error of estimate, , , , , and are constants, obtained by regression analysis, is shear-wave velocity to 30 m deep (m/s).
Table 1Coefficients of peak ground velocity attenuation relations
0.025 | 0.504 | –1.507 | –0.312 | 15 | 1400 | 0.2743 | |
–0.163 | 0.506 | –1.442 | –0.300 | 15 | 1400 | 0.2711 |
3.1. Comparison of the PGVH model for different values of magnitude and ground type situations.
In Figs. 2 and 3, the PGV models for magnitudes of 5, 6 and 7 for ground types have been shown.
Fig. 2Predicted horizontal maximum PGV attenuation curves with respect to epicentral distance; M= 5; 6; 7 for very soft, soft, stiff, rock sites
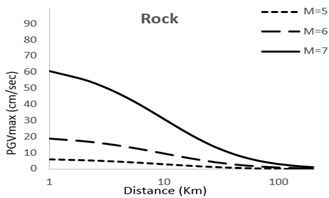
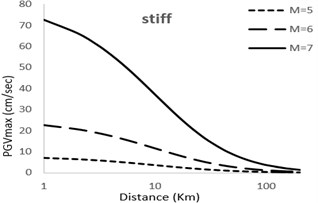
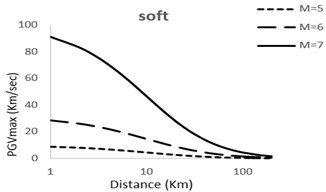
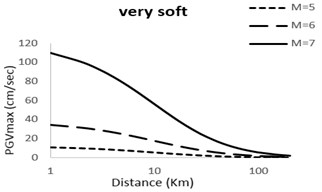
Fig. 3Predicted horizontal Geometric mean PGV attenuation curves with respect to epicentral distance; M= 5; 6; 7 for very soft, soft, stiff, rock sites
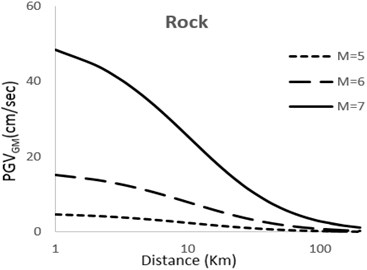
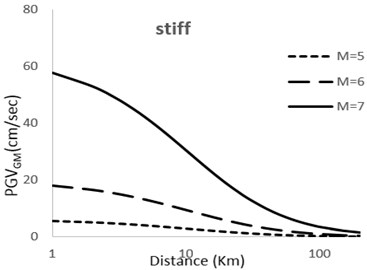
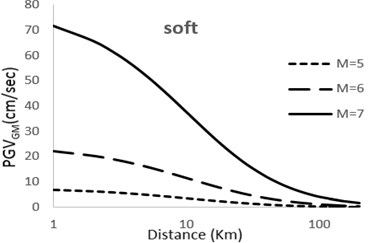
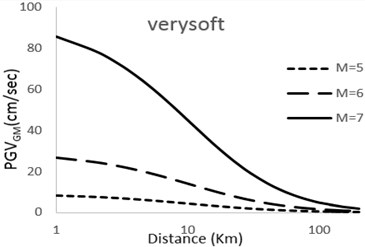
It can be observed that with increase in magnitude the curves show and upwards tenancy which is natural with view to the developed models. The extent of this tendency depends on the factor used for the magnitude of earthquake in the model. Moreover, it can be observed that the difference between the magnitudes in different models is considerable for small distances but decreases as the distance becomes larger.
3.2. Comparison between the PGV model and some other international models (Bommer Akkar [1], Campbell-Bozorgnia [8], Yu-jin [9])
Fig. 4Comparison of horizontal maximum PGV attenuation curves with other attenuation curves with respect to epicentral distance; M= 5 for soil and rock sites
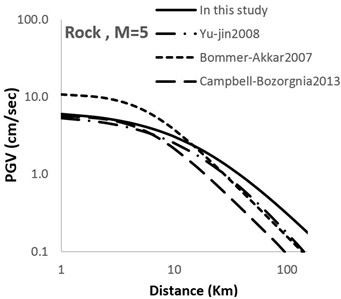
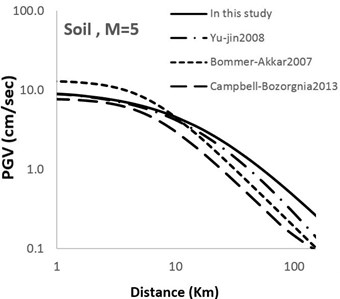
Fig. 5Comparison of horizontal maximum PGV attenuation curves with other attenuation curves with respect to epicentral distance; M= 6 for soil and rock sites
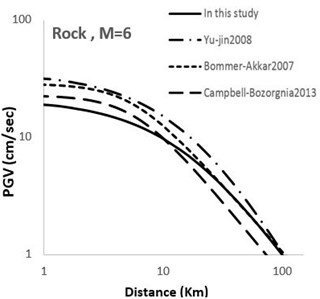
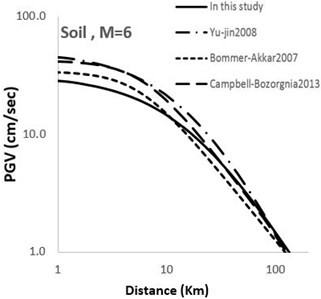
Fig. 6Comparison of horizontal maximum PGV attenuation curves with other attenuation curves with respect to epicentral distance; M= 7 for soil and rock sites
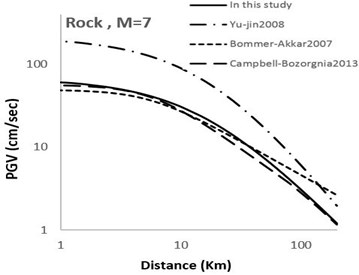
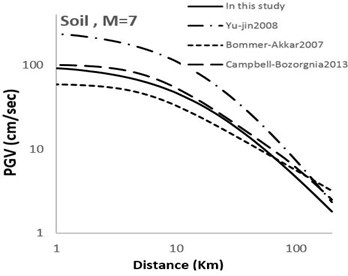
Figs. 4-7 show a comparison between the models developed in this study and some other recent famous models developed elsewhere around the world. It can be observed that the theoretical-empirical relationships obtained in this study are comparable with the world famous relations.
Fig. 7Comparison of horizontal geometric mean PGV attenuation curves with [1] attenuation curves with respect to epicentral distance; M= 5; 6; 7 for soil and Rock sites
![Comparison of horizontal geometric mean PGV attenuation curves with [1] attenuation curves with respect to epicentral distance; M= 5; 6; 7 for soil and Rock sites](https://static-01.extrica.com/articles/16856/16856-img16.jpg)
![Comparison of horizontal geometric mean PGV attenuation curves with [1] attenuation curves with respect to epicentral distance; M= 5; 6; 7 for soil and Rock sites](https://static-01.extrica.com/articles/16856/16856-img17.jpg)
4. Conclusions
Predictive empirical relations of horizontal PGV proposed in this study were based on an extended data set of Iran strong motion recordings. From the data distribution (see Fig. 1) it can be concluded that the range of validity of the attenuation relations for the epicentral distance is 1 km 149 km and for moment magnitude is 4.57.4. The motivation behind this study is the growing number of applications of PGV in engineering seismology and earthquake engineering.
The PGV equations have been derived for and for Iran. The main predictor variables used in our regression analyses are moment magnitude (), distance (closest distance to the surface projection of the fault Plane) and shear-wave velocity to 30 m deep ().
References
-
Bommer J., Akkar S. Empirical prediction equations for peak ground velocity derived from strong-motion records from Europe and the Middle East. Bulletin of the Seismological Society of America, Vol. 97, Issue 2, 2007, p. 511-530.
-
Bommer J., Akkar S., Kale O. A model for vertical to horizontal response spectral ratios for Europe and the middle east. Bulletin of the Seismological Society of America, Vol. 101, Issue 4, 2011, p. 1783-1806.
-
O’Rourke M. J., Ayala G. Pipeline damage due to wave propagation. ASCE, Vol. 119, Issue 9, 1993, p. 1490-1498.
-
Kaka S. I., Atkinson G. M. Relationships between instrumental ground motion parameters and modified Mercalli intensity in Eastern North America. Bulletin of the Seismological Society of America, Vol. 94, Issue 5, 2004, p. 1738-1806.
-
Newmark N. M., Blume J. A., Kapur K. K. Seismic design spectra for nuclear power plants. Power Division ASCE, Vol. 99, 1973, p. 278-303.
-
Kostadinov M. V., Towhata I. Assessment of Liquefaction inducting peak ground velocity and frequency of horizontal ground shaking at onset of phenomenon. Soil Dynamic Earthquake Engineering, Vol. 22, Issue 4, 2002, p. 309-322.
-
Tso W. K., Zhu T. J., Heidebrecht A. C. Engineering implication of ground motion A/V ratio. Soil Dynamic Earthquake Engineering, Vol. 11, 1992, p. 133-144.
-
Campbell K. W., Bozorgnia Y. NGA-West2 ground motion model for the horizontal component of PGA & PGV & PGD and 5% Damped elastic pseudo-acceleration response spectra for periods ranging from 0.01 to 10s. Pacific Earthquake Engineering Research Center (PEER). University of California, Berkeley, Vol. 6, 2013, p. 1-41.
-
Yu Y. X., Jin C. Y. Empirical peak ground velocity attenuation relations based on digital broadband records. 14th World Conference on Earthquake Engineering, 2008.
About this article
