Abstract
Feature extraction of rolling element bearing’s compound faults is a challenging task due to the complexity and the mutual coupling phenomenon among the kinds of faults. A new method based on cyclic wiener filter with constructed reference signals is proposed in the paper. The reference signals of the rolling element bearing’ inner race fault, outer race fault and rolling element fault are created respectively based on the rolling element bearing’ theoretical fault frequencies. Here, the created signals are used as the expected responses. Then the observed compound faults signal and the constructed reference signal are input into the cyclic wiener filter together. At last, the envelope demodulation method is applied on the filtered signals respectively and satisfactory fault feature extraction results are obtained. The effectiveness of the proposed method is verified through simulation. Furthermore, the advantages of the proposed method over other signal handling method such as spectral kurtosis (SK) are verified through experiment.
1. Introduction
There are safe and economic significances in extracting the fault feature of rolling element bearing opportunely for its wide range using in rotating machinery. The traditional and classic techniques such as Fast Fourier Transform (FFT) and envelope demodulation (ED) were used for the purpose. With the increasing complexity of the rotating machinery the collected fault signal of rolling element bearing is becoming more and more complex and the above two classic methods will not work effectively. After several decades of extensive research, kinds of new techniques such as wavelet transform (WT) [1], Tunable quality-factor wavelet transform (TQWT) [2], Ensemble empirical mode decomposition (EEMD) [3], Spectral kurtosis (SK) [4] and modified fast kurtogram [5] have been proposed for solving the problem. Most of the existing techniques focus mainly on fault diagnosis of single defect locating on either the outer race, inner race, one of the rolling elements or the early weak fault of rolling element bearing [6]. However, multiple faults may coexist in engineering practice and most of the existing methods are not fit for dealing with the compound faults of rolling element bearing. So far, feature extraction of the compound faults of rolling element bearing is still a big challenge for monitoring and diagnosis of rotating machinery, and the corresponding work is mainly focus on classification of faults using the intelligent algorithms such as Hidden Markov model (HMM), Support vector machine (SVM) and so on [7-11] which are time-consuming. Furthermore, they could not be realized effectively for fault diagnosis of rotating machinery timely. Thus far, very limited works with respect to the feature extraction of the compound faults of rolling element bearing based on signal processing method have been reported. Based on the Hermite splines interpolation, taking the minimum envelope spectrum entropy as the optimization objective, an improved adaptive redundant lifting multi-wavelet was proposed in paper [12] and was used in compound faults detection of rotating machinery. Furthermore, the superior effectiveness and reliability of the proposed method on compound faults detection was verified through comparing with some other fault detection methods. In paper [13] the dual-tree complex wavelet transform (DTCWT) was used in enhancement of signal denoising and multiple fault signatures detecting in rotating machinery, and the results of simulation and experimental signals demonstrated that DTCWT enjoyed better shift invariance and reduced spectral aliasing than second-generation wavelet transform (SGWT) and empirical mode decomposition (EMD). An extension investigation of the traditional Hilbert transform and the envelope feature of the multi-component signal were analytically exposed in paper [14]. Further, a novel deterministic component cancellation method was also proposed based on the iterative envelope calculation. In paper [15] the SK method was improved and an improved method naming adaptive spectral kurtosis (ASK) was proposed and was used in identification of multiple transient faults. Besides, a theoretical model of multiple bearing faults was also established in the paper. The superior performance of ASK in fault detection of rolling element bearing over kurtogram and protrugram [16] techniques was verified through simulation and experimental signals from a bearing with multiple faults.
The cyclic wiener filter exploits the spectral coherence theory was induced by the second-order cyclostationary signal [17-19]. The cyclic wiener filter with constructed reference signal combined with ED method is used in feature extraction of rolling element bearing’ compound faults. The feasibility of the proposed method is validated through simulation and compound faults signals of rolling element bearings.
The paper is organized as follows. Section 2 is dedicated to cyclic wiener filter and the proposed method. Section 3 is the simulation verifying the effectiveness of the proposed method. In Section 4 the experimental analyzed results of rolling element bearing’ three kinds of compound faults (inner race fault and outer race faults, outer race fault and rolling element faults, inner race fault and outer race fault and rolling element faults) are presented. In Section 5, the analyzed experimental results using SK method are also presented and the advantages of the proposed method are verified. In Section 6, the effectiveness of the proposed method in dealing with the compound faults under strong background noise is verified. The Conclusions obtained from the above results are given in Section 7.
2. Cyclic wiener filter and the proposed method
As stated in the introduction, the cyclic wiener filter exploits the spectral coherence theory, so it is necessary to introduce the spectral coherence theory based on second-order cyclostationarity firstly.
2.1. Spectral coherence theory
The spectral correlation density function of a cyclostationarity signal is the fourier transform of the signal’ cyclic autocorrelation function :
where is the cyclic frequency and is the spectral frequency.
Corresponding, the spectral coherence function of is defined as:
with being the time-averaging operator:
is the time average correlation coefficient of between the two frequencies at and . Further, the absolute value of satisfies:
With the value much closer to 1 means the stronger linear dependence between the two spectral lines at frequencies and , and vice versa. If an observed signal exhibits cyclostationarity, there must be existing non-zero , and the corresponding space between the two correlated components must be one of the cyclic frequencies .
2.2. Cyclic wiener filter and the improved cyclic wiener filter
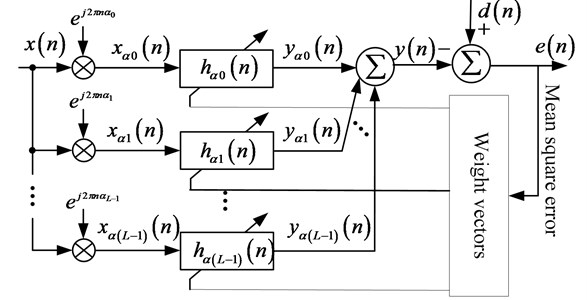
The frequency shift of the original observed discrete signal as ( covering all the cyclic frequencies:, ,…, . The cyclic frequencies ofcan be estimated by searching where the spectral coherence function are used as the new input in traditional cyclic wiener filter. Then are filtered by a filter-bank , the corresponding output are obtained. The summation of yields an estimation of the expected response . The error function can be shown as the following:
The weight vectors of the filter-bank are adjusted basing on , and the cyclic wiener filter is an optimal filter whose cost function is to minimize the mean square error of . Fig. 1 is the diagram of cyclic wiener filter.
Fig. 1Diagram of cyclic wiener filter
Traditional least-mean-square (LMS) algorithm is also fit for cyclic wiener filter and the LMS weight vectors adjustment formula of cyclic wiener filter is:
where is the step size. And the diagram of LMS algorithm of weight vectors adjustment for cyclic wiener filter is shown in Fig. 2.
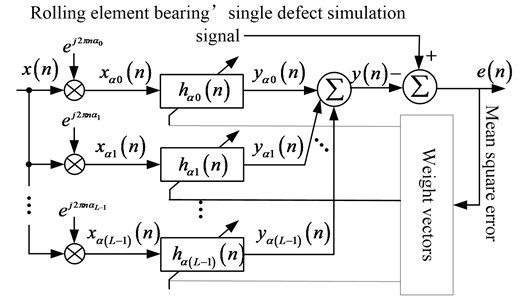
As shown in Fig. 1, the original observed signal is used as the expected response in traditional cyclic wiener filter. It is fit for handling for the single defect feature extraction of rolling element bearing. However, the fault signal will be much more complex when compound faults arise in rolling element bearing, the traditional cyclic wiener would not work effectively. The expected response will be much more ideal if it only contains the corresponding single fault (inner race fault, outer race fault or rolling element fault). So the rolling element bearing single defect model [20] is used here and the corresponding single defect (inner race fault, outer race fault and rolling element fault) simulation signals are constructed and used as the expected responses in the cyclic wiener filter. The diagram of improved cyclic wiener filter is shown in Fig. 3.
Fig. 2The diagram of LMS algorithm of weight vector adjustment for cyclic wiener filter
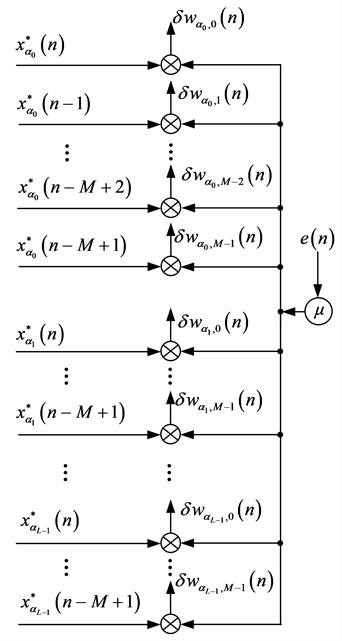
Fig. 3The diagram of improved cyclic wiener filter
3. Simulation
The rolling bearing fault model whose mathematical equation can be expressed as Eq. (7) is used [20] to verify the feasibility of the proposed method. is the tiny fluctuation around mean period Set the sampling frequency 16384Hz, and the shaft rotation frequency is 12 Hz. The inner race and outer race fault characteristic frequencies are 103 Hz and 57 Hz respectively. Set 4000 Hz as the nature frequency of the system. Assuming the random slide between rolling element and race is normally distributed whose standard deviation is 0.5 % of the shaft rotation ratio:
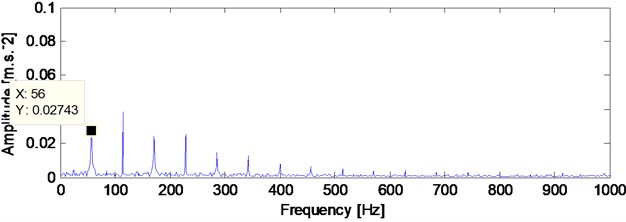
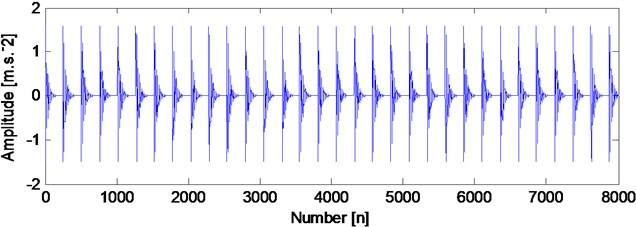
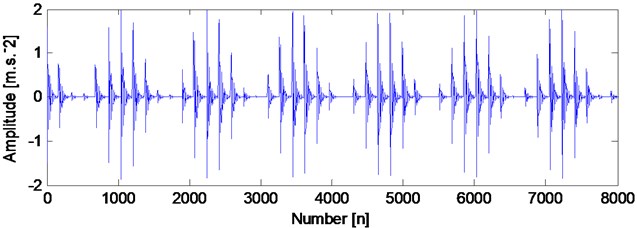
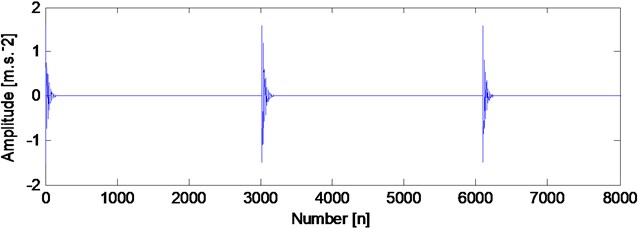
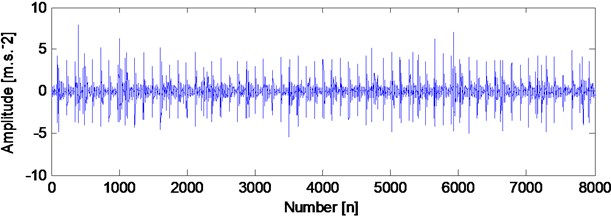
The time domain waveforms of the outer race and inner race fault simulation signals are shown in Fig. 4(a) and (b) respectively. Fig. 4(c) is the random white noise. Fig. 4(d) is the combined signal shown in Fig. 4(a), (b) and (c) which simulates rolling element bearing’ observed compound faults signal. Fig. 5 is the envelope demodulation spectral of the compound faults signal from which the inner fault and outer race fault characteristic frequencies could not be obtained due to the complexity structure of the compound faults signal and the influence of the noise. Use the simulation signal shown in Fig. 4(a) as the expected response , then input it with the observed compound faults signal shown in Fig. 4(d) into the cyclic wiener filter. The filtered signal is shown in Fig. 6(a). Apply envelope demodulation spectral method to the signal shown in Fig. 6(a) and the envelope result is shown in Fig. 6(b) from which the outer race fault characteristic frequency 56 Hz (The existing of random slide between the rolling element and races causes the error between theory calculation fault frequency and practical extraction fault frequency) with its harmonic frequencies are extracted perfectly. Repeat the above steps but use the simulation signal shown in Fig. 4(b) as the expected response instead and the filtered signal is shown in Fig. 6(c). The corresponding envelope demodulation spectrum of it is shown in Fig. 6(d) from which the inner race fault characteristic 103 Hz with its harmonic frequencies are extracted perfectly. Besides, the modulation frequency 12 Hz is also extracted perfectly.
Fig. 4The rolling element bearing compound faults simulation
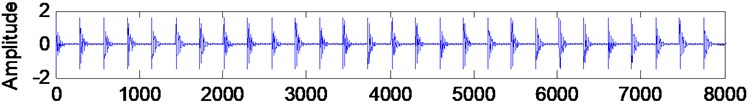
a) Outer race fault simulation
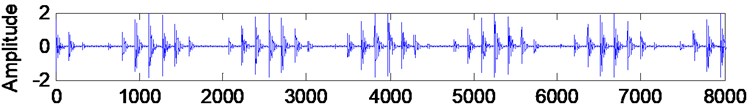
b) Inner race fault simulation
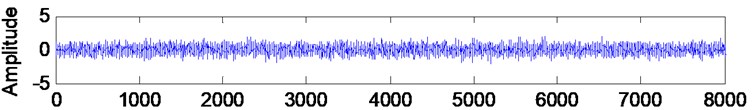
c) Noise
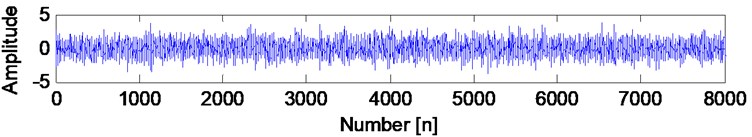
c) Combined signal
Fig. 5The envelope demodulation spectrum of the signal shown in Fig. 4(d)
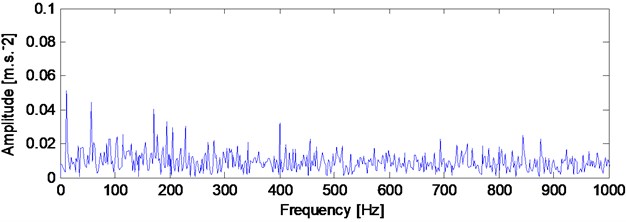
Fig. 6The analyzed result of rolling bearing simulation compound faults basing on the proposed method
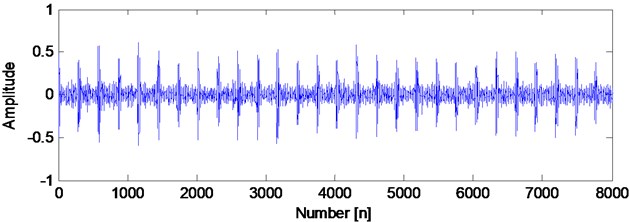
a) The filtered signal using the signal shown in Fig. 4(a) as reference signal
b) The envelope demodulation spectrum of the signal shown in Fig. 6(a)
c) The filtered signal using the signal shown in Fig. 4(b) as reference signal
d) The envelope demodulation spectrum of the signal shown in Fig. 6(c)
4. Experiment 1
In this section, the application of proposed method in rolling element bearing’ experimental compound faults feature extraction is carried out. The test rig is shown in Fig. 7. The type of test rolling element bearing is NU205 and the relative parameters of the test bearings are given in Table 1. Three types of compound faults are implemented: inner race and outer race compound faults, outer race and rolling element compound faults, inner race and outer race and rolling element compound faults. Process faults on the inner race, outer race and rolling element of the test bearing respectively. The processed faults on inner race, out race and rolling element of the test bearing are shown in Fig. 8(a), (b) and (c) respectively. The two ends of the shaft are supported by rolling bearings, and the right end is detachable which is convenient for replacement of the test bearings. The outer race is fixed on the bench and the inner race rotates synchronously with shaft in the test process. The rotating frequency is 13.3 Hz and the sampling frequency is 8192 Hz. The characteristic frequencies of inner race fault, outer race fault and rolling element fault are calculated using Eqs. (8)-(10):
Table 1The parameters of the test rolling element bearing
Type | Ball number | Ball diameter (mm) | Pitch diameter (mm) | Contact angle | Motor speed (rmp) |
NU205 | 12 | 7.5 | 39 | 0 | 800 |
Fig. 7The test rig
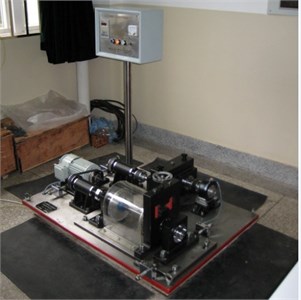
Fig. 8The processed faults on rolling bearing’ inner race, rolling element and outer race
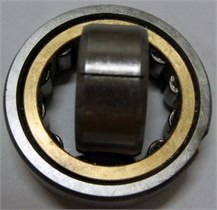
a) Inner race fault
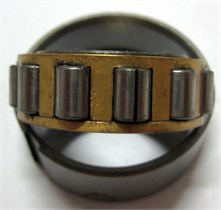
b) Rolling element fault
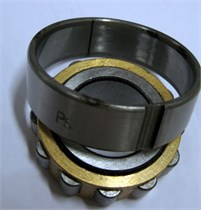
c) Outer race fault
In Eqs. (8)-(10), is the number of rolling elements. is rolling element diameter. is the pitch diameter and is the contact angle. The values of , and are 95.38 Hz, 64.61 Hz and 5.38 Hz respectively. Based on the above calculated theory characteristic frequencies of test rolling element bearing and Eq. (7), the time domain waveforms of the test bearing’ outer race fault reference signal, inner race fault reference signal and rolling element fault reference signal are shown in Fig. 9.
Fig. 9Test bearing’ fault reference signals
a) Outer race fault reference signal
b) Inner race fault reference signal
c) Rolling element fault reference signal
4.1. Inner race fault and outer race fault
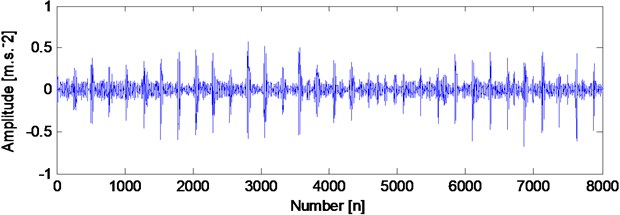
The time domain waveform of the compound signal is shown in Fig. 10(a), and its corresponding envelope spectrum is shown in Fig. 10(b). Fig. 11 is the analyzed results using the proposed method. Fig. 11(a) is the filtered signal using the signal shown in Fig. 9(a) as the reference signal basing on the proposed method. Fig. 11(b) is the envelope demodulation spectrum of signal shown in Fig. 11(a) from which the outer race characteristic frequency with its harmonic frequencies are extracted perfectly. Fig. 11(c) is the filtered signal using the signal shown in Fig. 9(b) as the reference signal basing on the proposed method. Fig. 11(d) is the envelope demodulation spectrum of signal shown in Fig. 11(c) from which the inner race characteristic frequency with its harmonic frequencies are extracted perfectly. Further, the modulation frequency is also extracted.
Fig. 10The time domain waveform of compound faults signal and the corresponding envelope demodulation spectrum
a) The time domain waveform of compound faults signal (inner and outer race fault)
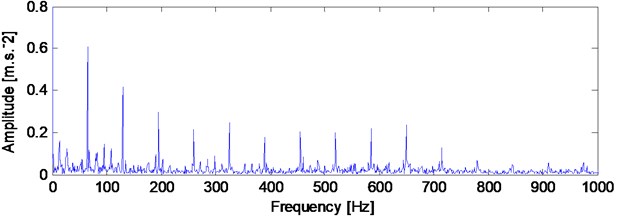
b) The envelope demodulation spectrum of the signal shown in Fig. 10(a)
Fig. 11The analyzed result of the compound faults signal (inner race and outer race fault) basing on the proposed method
a) Filtered signal using the signal shown in Fig. 9(a) as the reference signal
b) The envelope demodulation spectrum of the signal shown in Fig. 11(a)
c) Filtered signal using the signal shown in Fig. 9(b) as the reference signal
d) The envelope demodulation spectrum of the signal shown in Fig. 11(c)
4.2. Outer race fault and rolling element fault
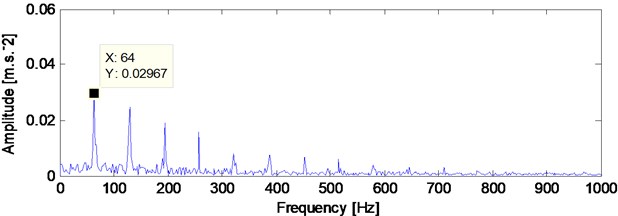
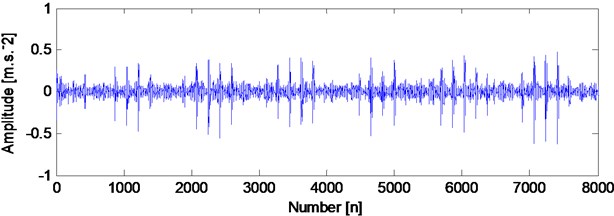
The time domain waveform of the compound faults (rolling element and outer race fault) is shown in Fig. 12(a), and the corresponding envelope demodulation spectrum of the compound faults signal is shown in Fig. 12(b). In Fig. 12(b) the outer race fault characteristic frequency with its harmonic frequencies are extracted perfectly using the envelope demodulation method. However, the rolling element fault feature could not be obtained from Fig. 12(b). In Fig. 13, the analyzed results of the compound faults signal basing on the proposed method are given. Fig. 13(a) is the Filtered signal using the signal shown in Fig. 9(c) as the reference signal and its corresponding envelope demodulation spectrum is shown in Fig. 13(b) from which the rolling element fault characteristic frequency with its harmonic frequencies are extracted perfectly. Fig. 13(c) is the Filtered signal using the signal shown in Fig. 9(a) as the reference signal. The envelope demodulation spectrum of the signal shown in Fig. 13(c) is shown in Fig. 13(d) from which the outer race fault characteristic frequency with its harmonic frequencies are extracted perfectly.
Fig. 12The time domain waveform of compound faults signal and the corresponding envelope demodulation spectrum
a) The time domain waveform of compound faults signal (rolling element and outer race fault)
b) The envelope demodulation spectrum of the signal shown in Fig. 12 (a)
Fig. 13The analyzed result of the compound faults signal (rolling element and outer race fault) basing on the proposed method
a) Filtered signal using the signal shown in Fig. 9(c) as the reference signal
b) The envelope demodulation spectrum of the signal shown in Fig. 13(a)
c) Filtered signal using the signal shown in Fig. 9(a) as the reference signal
d) The envelope demodulation spectrum of the signal shown in Fig. 13(c)
4.3. Inner race fault and outer race fault and rolling element fault
The time domain waveform of the third kind of compound faults (inner race and outer race and rolling element faults) signal is given in Fig. 14(a). Its structure is more complex than the above two compound faults signals shown in Fig. 10(a) and Fig. 12(a). The envelope demodulation spectrum of the signal shown in Fig. 14(a) is shown in Fig. 14(b). Though the inner race fault characteristic basic frequency could be extracted roughly, it is evident the spectral lines are chaotic and the useful fault features of the outer race fault and rolling element fault could not be obtained. In Fig. 15 the analyzed results of the compound faults signal are given. Fig. 15(a) is the filtered signal using the signal shown in Fig. 9(a) as the reference signal and Fig. 15(b) is its envelope demodulation spectrum from which the outer race fault characteristic frequency with its harmonic frequencies are extracted successfully.
Fig. 14The time domain waveform of compound faults signal and the corresponding envelope demodulation spectrum
a) The time domain waveform of compound faults signal (rolling element and outer race and inner race fault)
b) The envelope demodulation spectrum of the signal shown in Fig. 14(a)
Fig. 15The analyzed result of the compound faults signal (rolling element and outer race and inner race fault) basing on the proposed method
a) Filtered signal using the signal shown in Fig. 9(a) as the reference signal
b) The envelope demodulation spectrum of the signal shown in Fig. 15(a)
c) Filtered signal using the signal shown in Fig. 9(c) as the reference signal
d) The envelope demodulation spectrum of the signal shown in Fig. 15(c)
e) Filtered signal using the signal shown in Fig. 9(b) as the reference signal
f) The envelope demodulation spectrum of the signal shown in Fig. 15(e)
The filtered signals using the signals shown in Fig. 9(c) and Fig. 9(b) as reference signals respectively are given in Fig. 15(c) and Fig. 15(e), and they are corresponding fault signals of the rolling element fault and inner race fault. Apply envelope demodulation method to the signals shown in Fig. 15(c) and (e), and the obtained envelope results are shown in Fig. 15(d) and (f) respectively from which the rolling element fault and inner race fault features are extracted successfully.
5. Comparison
In Fig. 16 the analyzed results using SK method are given. From Fig. 16(b) the inner race fault characteristic frequency could be obtained roughly. But the fault features of rolling element fault and outer race fault both could not be extracted.
Fig. 16The analyzed result of the compound faults signal shown in Fig. 14(a) using SK method
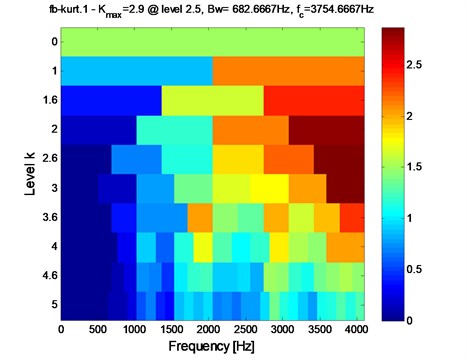
a) The kurtogram of the signal shown in Fig. 14(a)
b) The envelope and demodulation results of the filtered signal basing on SK method
6. Experiment 2
A gearbox test rig shown in Fig. 17 is set up to carry out the experiment. In the test rig, the adjusting of the motor rotating speed is controlled by the inverter. The load is adjusted by the magnetic power brake. There are two shafts in the single-stage transmission gearbox supported by four rolling element bearings with the same type NSK#1302.The data acquisition system includes four acceleration sensors and a data acquisition card USB9234. Data acquisition software is programmed with National Instruments LabView. The structure of transmission and the layout of the measuring points can be seen in Fig. 18.
Fig. 17The test rig
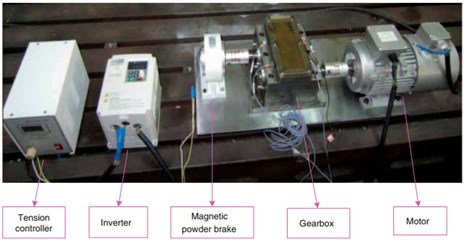
Fig. 18The structure of the transmissions and the layout of measuring points
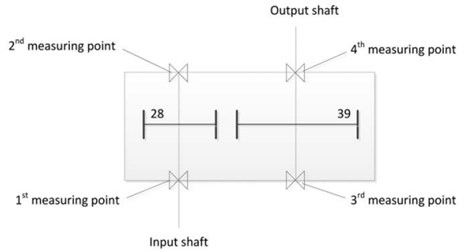
A bearing with an inner race and outer race compound fault is installed near the 2nd measuring point, the other three bearings are normal. The sampling rate is 44.1 kHz. The input shaft rotating frequency is 100/6 Hz. It can be seen that in Fig. 18 the transmission ratio 39/28, and the modulus of the gear is 2. The rated power of the Frequency conversion motor is 0.55 kw. The parameters of the test fault bearing are shown in Table 2, and the characteristic frequencies of the test fault bearing relating to the rotating frequency are shown in Table 3.
Table 2Geometrical parameters of bearing NSK#1302
Type | Number of balls | Ball diameters (mm) | Pitch diameter (mm) | Contact angle |
NSK#1302 | 10 | 6.2 | 27.5 | 9°00˝ |
Table 3Characteristic frequency of test bearing 6023
Type | |||||
NSK#1302 | 16.6 | 6.5 | 38.8 | 103.9 | 64.8 |
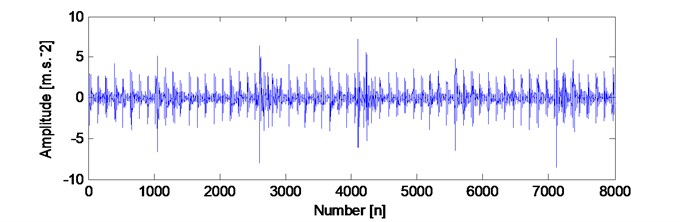
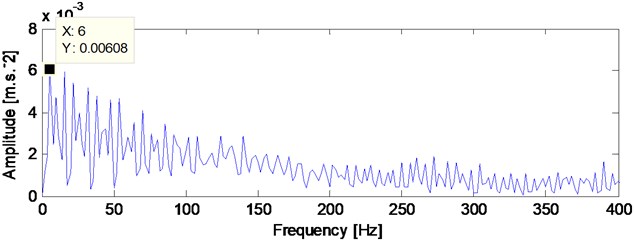
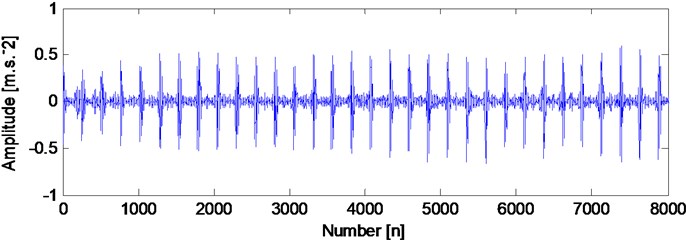
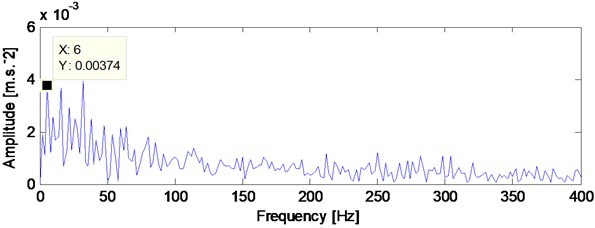
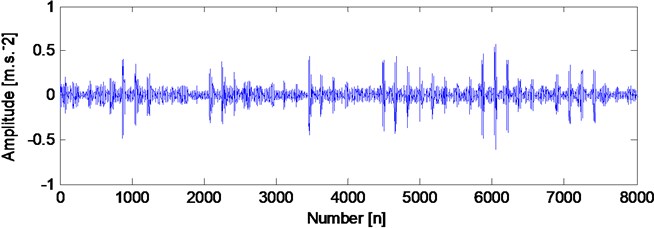
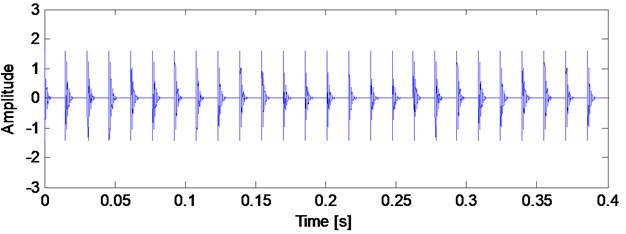
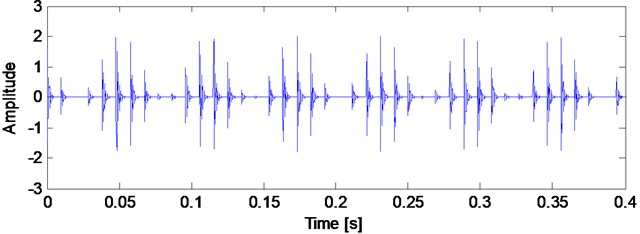
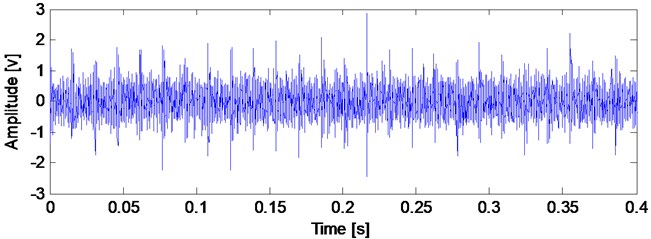
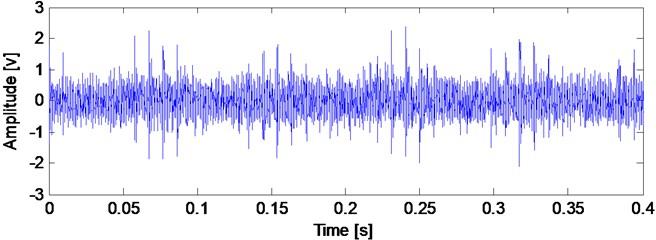
The time-domain waveform of the vibration signal collected from 2 measuring point is shown in Fig. 19(a). Its corresponding envelope demodulation spectrum are shown in Fig. 19(b). We could not identify the bearing fault based on Fig. 19(a) because the impulse characteristic is buried by the strong background noise. In Fig. 19(b) the spectrum lines are chaotic and the fault feature information is also not reflected. From the above analysis results, we can see that though the accelerated sensor is so close to the fault bearing, the fault feature of bearing is not extracted successfully using the traditional signal processing methods. The reasons can be summarized as follows: the vibration signal of gearbox is complex, and it contains the gear meshing signal components, the vibration of the shaft axis, the vibration of the fault bearing and the vibration of the motor and so on. So it is necessary and meaningful to separate the signal of gearbox further for better feature extraction result.
The construction of the reference signals is same as the processes in experiment 1: Based on the calculated theory characteristic frequencies of test rolling element bearing in Table 3, the time domain waveforms of the test bearing’ outer race fault reference signal and inner race fault reference signal are shown in Fig. 20(a) and (b).
Fig. 19The time-domain waveform and its corresponding envelope demodulation spectrum of the fault bearing (inner and outer race compound fault) in the gearbox
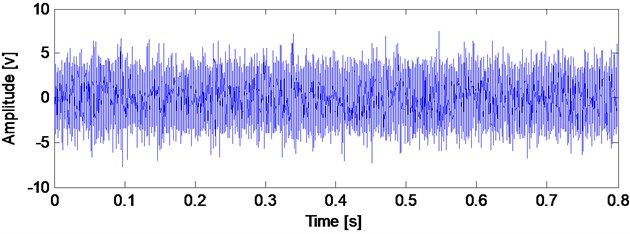
a) The time domain waveform of the fault bearing (inner and outer race compound fault) in the gearbox
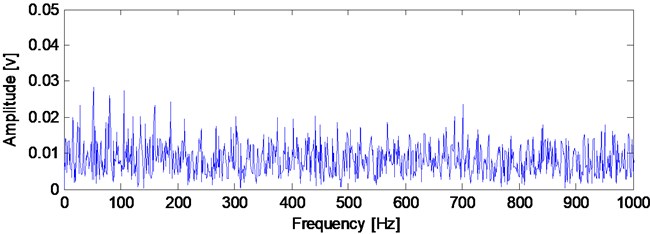
b) The envelope demodulation spectrum of the signal shown in Fig. 19(a)
Fig. 20The fault reference signals of the test fault bearing in the gearbox
a) Outer race fault reference signal
b) Inner race fault reference signal
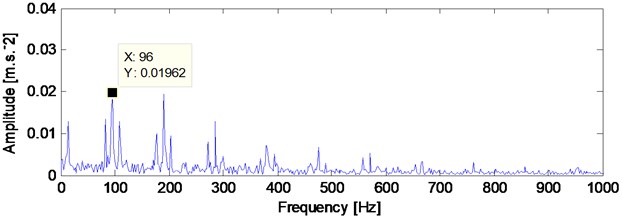
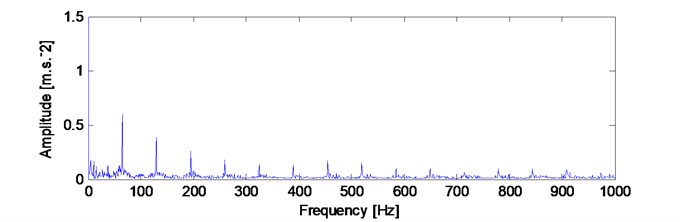
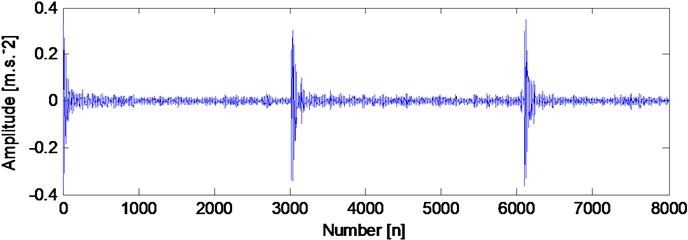
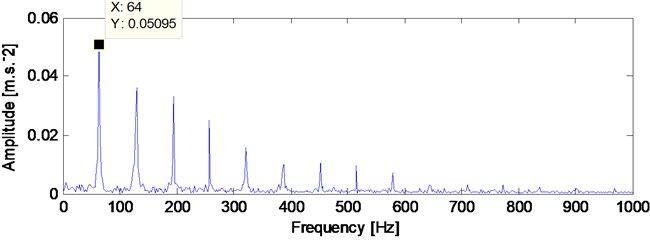
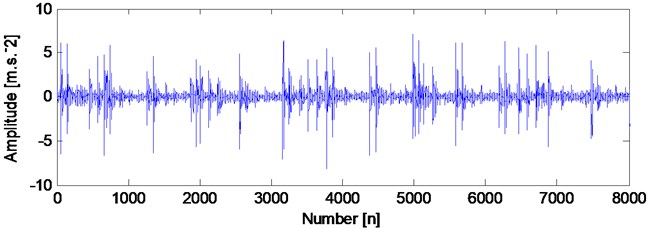
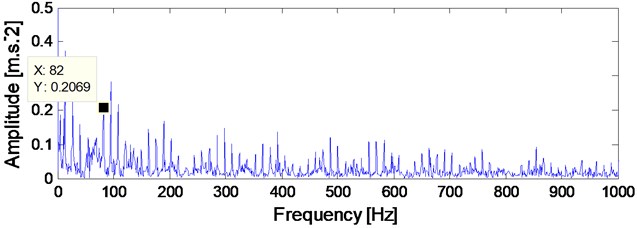
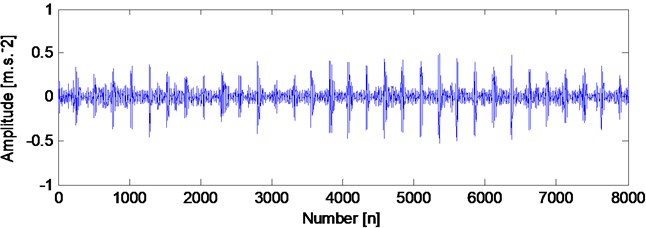
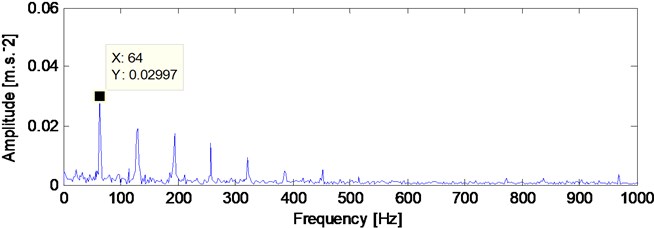
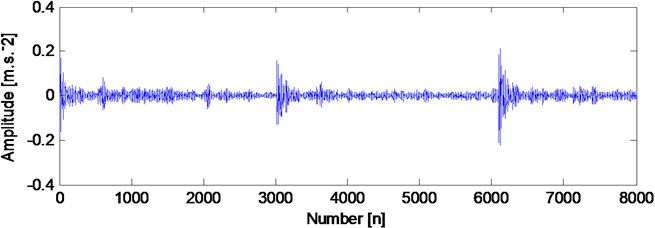
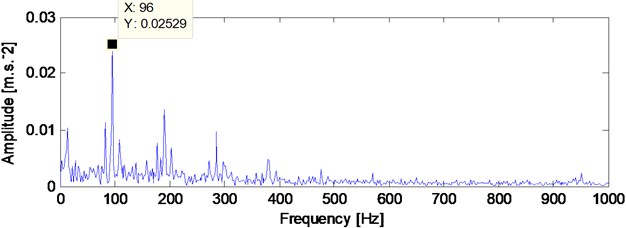
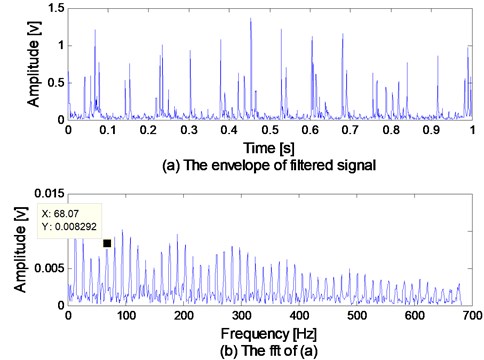
The analyzed results of the bearing compound faults signal under strong background noises basing on the proposed method are given in the Fig. 21: Fig. 21(a) is the Filtered signal using the signal shown in Fig. 20(a) as the reference signal and its corresponding envelope demodulation spectrum is shown in Fig. 21(b) from which the outer race fault characteristic frequency with its harmonic frequencies are extracted perfectly. Fig. 21(c) is the Filtered signal using the signal shown in Fig. 20(b) as the reference signal. The envelope demodulation spectrum of the signal shown in Fig. 21(c) is shown in Fig. 21(d) from which the inner race fault characteristic frequency with its harmonic frequencies are extracted perfectly.
Fig. 21The analyzed result of the bearing compound faults signal under strong background noise basing on the proposed method
a) Filtered signal using the signal shown in Fig. 20(a) as the reference signal
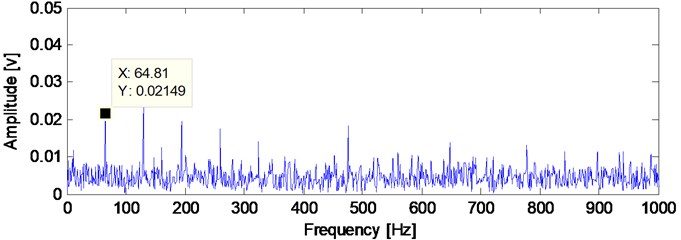
b) The envelope demodulation spectrum of the signal shown in Fig. 21(a)
c) Filtered signal using the signal shown in Fig. 20(b) as the reference signal
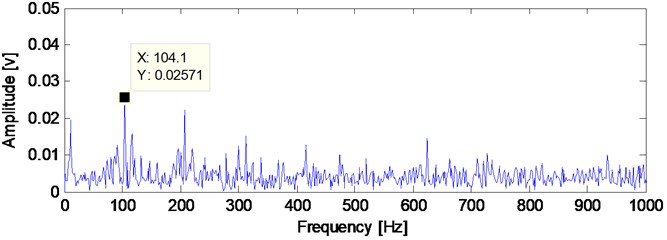
d) The envelope demodulation spectrum of the signal shown in Fig. 21(c)
The analyzed results of the signal shown in Fig. 19(a) using SK method as comparison are not given due to space limited: The results are not satisfactory as the experiment 1.
7. Conclusion
When compound faults arise in rolling element bearing simultaneously, the traditional cyclic wiener filter is not effective for the reason that the compound signal contains all the faults information of different kinds of faults, and it is not reasonable to be used as the expected response. The improved cyclic wiener filters using the rolling element bearing single simulation fault signals as the expected response is proposed in the paper and is used in feature extraction of rolling element bearing’ compound faults. Firstly, the feasibility of the proposed method is verified through simulation signal. Then the effectiveness of the proposed is validated again through rolling element bearing experimental compound signals. Furthermore, the advantages of the proposed method over SK method in feature extracting of rolling element bearing’ compound faults are also verified.
References
-
Qiu H., Lee J., Lin J. Wavelet filter-based weak signature detection method and its application on rolling element bearing prognostics. Journal of Sound and Vibration, Vol. 289, Issues 4-5, 2006, p. 1066-1090.
-
Selesnick I. W. Wavelet transform with tunable Q-Factor. IEEE Transactions On Signal Processing, Vol. 59, 2011, p. 3560-3575.
-
Wu Z. H., Huang N. E. Ensemble empirical mode decomposition: a noise assisted data analysis method. Advance in Adaptive Data Analysis, Vol. 1, 2009, p. 1-41.
-
Antoni J. The spectral kurtosis: a useful tool for characterizing non-stationary signals. Mechanical Systems and Signal Processing, Vol. 20, Issue 2, 2006, p. 282-307.
-
Antoni J. Fast computation of the kurtogram for the detection of transient faults. Mechanical Systems and Signal Processing, Vol. 21, Issue 1, 2007, p. 108-124.
-
Wang H. C., Chen J., Dong G. M. Feature extraction of rolling bearing’s early weak fault based on EEMD and tunable Q-factor wavelet transform. Mechanical Systems and Signal Processing, Vol. 48, Issues 1-2, 2014, p. 103-119.
-
Purushotham V., Narayanan S., Prasad S. A. N. Multi-fault diagnosis of rolling bearing elements using wavelet analysis and hidden Markov model based fault recognition. NDT&E International, Vol. 38, Issue 8, 2005, p. 654-664.
-
Abbasion S., Rafsanjani A., Farshidianfar A., Irani N. Rolling element bearings multi-fault classification based on the wavelet denoising and support vector machine. Mechanical Systems and Signal Processing, Vol. 21, Issue 7, 2007, p. 2933-2945.
-
Lei Y. G., He Z. J., Zi Y. Y. Application of a novel hybrid intelligent method to compound fault diagnosis of locomotive roller bearings. ASME Journal of Vibration and Acoustics, Vol. 130, Issue 3, 2008, p. 034501.
-
Žvokelj M., Zupan S., Prebil I. Multivariate and multiscal monitoring of large-size low-speed bearings using ensemble empirical mode decomposition method combined with principal component analysis. Mechanical Systems and Signal Processing, Vol. 24, Issue 1, 2010, p. 1049-1067.
-
Li Z. X., Yan X. P., Tian Z., Yuan C. Q., et al. Blind vibration component separation and nonlinear feature extraction applied to the nonstationary vibration signals for the gearbox multi-fault diagnosis. Measurement, Vol. 46, Issue 1, 2013, p. 259-271.
-
Chen J. L., Zi Y. Y., He Z. J., Yuan J. Compound faults detection of rotating machinery using improved adaptive redundant lifting multiwavelet. Mechanical Systems and Signal Processing, Vol. 38, Issue 1, 2013, p. 36-54.
-
Wang Y. X., He Z. J., Zi Y. Y. Enhancement of signal denoising and multiple fault signatures detecting in rotating machinery using dual-tree complex wavelet transform. Mechanical Systems and Signal Processing, Vol. 24, Issue 1, 2010, p. 119-137.
-
Ming A. B., Zhang W., Qin Z. Y., Chu F. L. Envelope calculation of the multi-component signal and its application to the deterministic component cancellation in bearing fault diagnosis. Mechanical Systems and Signal Processing, Vol. 50, Issue 51, 2015, p. 70-100.
-
Wang Y. X., Liang M. Identification of multiple transient faults based on the adaptive spectral kurtosis method. Journal of Sound and Vibration, Vol. 331, Issue 2, 2012, p. 470-486.
-
Barszcz T., Jabłoński A. A novel method for the optimal band selection for vibration signal demodulation and comparison with Kurtogram. Mechanical Systems and Signal Processing, Vol. 25, Issue 1, 2011, p. 431-451.
-
Gardner W. A. Cyclic Wiener filtering: theory and method. IEEE Transactions on Communication Vol. 41, Issue 1, 1993, p. 151-163.
-
Gardner W. A. The spectral correlation theory of cyclostationary. Signal Processing Magazine, Vol. 11, 1986, p. 13-36.
-
Bonnardot F., Randall R. B., Guillet F. Extraction of second-order cyclostationary sources-application to vibration analysis. Mechanical Systems and Signal Processing Vol. 19, Issue 6, 2005, p. 1230-1244.
-
Antoni J., Bonnardot F., Raad A., Ei Badaoui M. Cyclostationary modeling of rotating machine vibration signals. Mechanical Systems and Signal Processing, Vol. 18, Issue 6, 2004, p. 1285-1314.
About this article

