Abstract
Seismic provisions have utilized design eccentricities to reduce planar irregularities in lateral stiffness of buildings. In calculating a design eccentricity, the torsional amplification factor may be applied either to accidental eccentricity or to both inherent and accidental eccentricities according to design codes. In this paper, different code provisions and their impact on torsional responses of buildings are investigated using example buildings with various aspect ratios and inherent eccentricities. It was found that the design eccentricity in KBC-2009 using torsional amplification factor for only accidental eccentricity reflects the dynamic magnification more accurately than that in KBC-2006 using this factor for both inherent and accidental eccentricity. And dynamic magnification of a torsionally imbalanced building is affected by the size of seismic design force of response spectrum analysis than design eccentricity of equivalent static analysis in KBC-2009. In other words, design eccentricity including torsional amplification factor in KBC-2009 do not reflect the dynamic magnification accurately.
1. Introduction
In modern seismic design codes (KBC-2009 [1], ASCE 7-10 [2]), torsional irregularity is defined to exist when the maximum story drift at one end of the structure is more than 1.2 times the average story drift at the two ends of the structure. Once a building is categorized as one with torsional irregularity, as shown in Eq. (1), the torsional amplification factor () is used in building design. Where, – maximum story drift and – the average story drift at both ends:
The design eccentricities () of various seismic design codes [3-15] consist of the inherent eccentricity (), accidental eccentricity (), and torsional amplification factor. The inherent eccentricity is the distance between the center of mass (CM) and the center of rigidity (CR). The accidental eccentricity has been used to consider uncertainties in the mass and stiffness of a building. Rotational components in the ground motion application cannot be considered in the code. The torsional amplification factor is used to reflect the dynamic magnification that cannot be considered in the static analysis. The design eccentricity determines the location of the story shear which is to be applied to each floor as a seismic design force. The use of the design eccentricity is aiming for limiting the stiffness irregularities to reduce the seismic vulnerability of torsionally imbalanced building. The calculation of design eccentricities has been changed through revisions of seismic design codes, as shown in Table 1. In calculating a design eccentricity, the dynamic amplification factor may be applied either to accidental eccentricity or to both inherent and accidental eccentricities according to design codes. There is no documentation that provides a clear explanation on the reason of changes in the eccentricity calculation method.
In this study, different code provisions and their impact on torsional responses of buildings are investigated using example buildings with various aspect ratios and eccentricities. Towards this end, single-story example buildings were first designed using equivalent static analysis (ESA) and response spectrum analysis (RSA), and lateral stiffness of the building were compared.
2. Overview of the example building
The example buildings were designed to have different aspect ratio ( in Fig. 1), inherent eccentricity and calculation method of the design eccentricity as per design codes (See Table 1). Aspect ratios of the example buildings are 2 and 3. Stiffness eccentricity is controlled from 10 to 20 % at the interval of 5 % by changing sizes of structural elements and mass eccentricity is controlled from 0 to 10 % at the interval of 5 % by moving structural mass. So the range of inherent eccentricity which is the sum of mass and stiffness eccentricity is between 10 % and 30 %.
Table 1Comparison of design eccentricity in various design code
Revision year | Code | Design eccentricity () |
1988 | SEAOC 1988 [3] | |
1991 | UBC 91 [4] | |
1994 | UBC94[5] | |
1997 | UBC97[6] | |
FEMA273[7] | ||
FEMA302[8] | ||
1999 | SEAOC1999[9] | |
2000 | FEMA 356 [10] | |
FEMA 368 [11] | ||
2002 | ASCE 7-02 [12] | |
2003 | FEMA 450 [13] | |
2005 | ASCE 7-05 [14] | |
KBC-2006 [15] | ||
2009 | KBC-2009 [1] | |
ASCE 7-10 [2] |
Fig. 1Floor plan and elevation of the example building
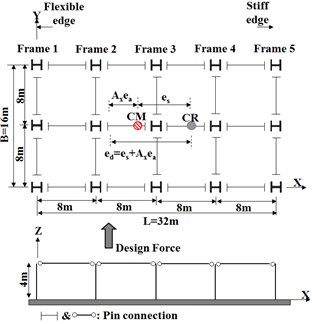
a) Aspect ratio is 2
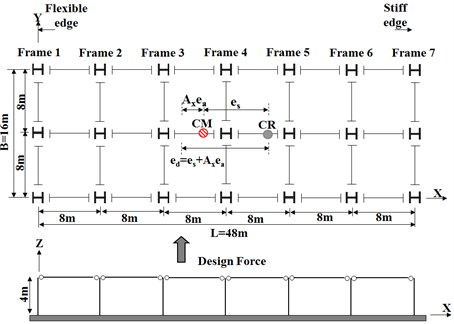
b) Aspect ratio is 3
The floor plan and sectional view of example buildings are shown in Fig. 1. Span of each bay and story height are 8 m and 4 m, respectively. The seismic importance factor () is assumed to be 1.0 and allowable story drift is 2 %. The site class is rock, seismic design category is C. Dead and live loads are 10 and 3 kN/m2, respectively. The mass in building is distributed evenly on the plane in the case that mass eccentricity is 0 % and, therefore, the center of mass is located at the center of plane. If mass eccentricity is 5 % or 10 %, center of mass moves towards the flexible edge. Frame-1 is the flexible edge of all the example buildings. Frame-5 and Frame-7 are stiffness edge of a building aspect ratios are 2 and 3 respectively. The design base shear of the equivalent static analysis (ESA) method was calculated as per KBC 2009 [1]:
where, 0.147 g, the design spectral acceleration at 1 second; 3.5, response modification factor, – building height; 1.6, upper limit on the calculated period; – weight of the building.
Response spectrum analysis (RSA) method may lead to reduced seismic design base shear. This is due to the fact the fundamental period obtained through the RSA method is in general longer than that from ESA method. KBC 2006 [15] stipulates that the design forces acquired from the two analysis methods should be identical whereas the KBC 2009 [1] does that the design load from the RSA method is over 85 % of that acquired through ESA methods.
FEMA 451 [16] categorized dynamic magnification including accidental torsion into two types (Fig. 2). The first method is to design a building by moving the center of mass by the size of the accidental eccentricity. While this method can consider the dynamic magnification based not only on the inherent eccentricity but also on the accidental eccentricity, it should also consider the accidental eccentricity, as shown in case 1-4, in each direction. Furthermore, the more the stories of building are, the longer the design time becomes. The second method is to design the building without moving the center of mass, and to redesign it by adding accidental torsion. While this method considers only the dynamic magnification based on the inherent eccentricity, it uses less time for design compared to the first method. In this study, the first method prescribed in FEMA 451 [16] was used to consider the dynamic magnification.
Fig. 2Application method of accidental torsion in FEMA 451 [16]
![Application method of accidental torsion in FEMA 451 [16]](https://static-01.extrica.com/articles/16736/16736-img3.jpg)
a) The first method
![Application method of accidental torsion in FEMA 451 [16]](https://static-01.extrica.com/articles/16736/16736-img4.jpg)
b) The second method
3. Comparison of lateral stiffness in example buildings designed via ESA and RSA method
Shown in Table 2 and 3 are lateral stiffness and inherent eccentricity after seismic design of example building according to the following analysis variables: the aspect ratio, inherent eccentricity, and the design methods prescribed in Korean Building Code (KBC). As the building was designed in such a way the maximum story drift was over 95 % of the allowable story drift, maximum story drifts of all the example buildings were almost identical regardless of aspect ratio and inherent eccentricity. Meanwhile, lateral deflection of the stiff edge and the mean story drift of the two ends became smaller as the inherent eccentricity and aspect ratio of building became larger; as such, the torsional amplification factor increased. Because the increase of design eccentricity due to torsional amplification factor in ESA method results in moving location of story shear such as lateral seismic design force from center of plane to flexible edge, it strengthens lateral stiffness of flexible edge and inherent eccentricity lessens after seismic design. It is observed that if a designer applies torsional amplification factor, design eccentricity including this factor in ESA method changes torsionally irregular building into building having 0 % or small stiffness eccentricity. Based on these results, torsional amplification factor reduces seismic vulnerability of torsionally imbalanced building.
In the case of RSA method, seismic design force in KBC-2006 is larger than that in KBC-2009 and increase of inherent eccentricity due to moving center of mass results in largely dynamic magnification. For these reasons, the larger design force and inherent eccentricity before design are, the smaller stiffness eccentricity after design is. Comparing that aspect ratios of example building are 2 and 3, it is observed that stiffness eccentricity after seismic design is almost identical and it means that aspect ratio of building has little effect on dynamic magnification.
Table 2Lateral stiffness and eccentricity of the building designed via different design codes whose aspect ratio of example building is 2.0
CR (%) | CM (%) | Design method | Design code | Lateral stiffness of frame (kN/mm) | After design (%) | ||||||
Fr-1 | Fr-2 | Fr-3 | Fr-4 | Fr-5 | CR | CR+CM | |||||
10 | 0 | ESA | KBC-2009 | 1.148 | 4.0 | 5.2 | 5.8 | 6.4 | 7.9 | 7.59 | 7.59 |
KBC-2006 | 4.0 | 7.59 | 7.59 | ||||||||
RSA | KBC-2009 | 1.000 | 3.5 | 8.62 | 8.62 | ||||||
KBC-2006 | 4.6 | 6.39 | 6.39 | ||||||||
5 | ESA | KBC-2009 | 1.234 | 5.2 | 5.2 | 5.8 | 5.35 | 10.35 | |||
KBC-2006 | 5.2 | 5.8 | 5.8 | 4.80 | 9.80 | ||||||
RSA | KBC-2009 | 1.000 | 4.6 | 5.2 | 5.8 | 6.25 | 11.25 | ||||
KBC-2006 | 6.4 | 6.4 | 6.4 | 2.24 | 7.24 | ||||||
10 | ESA | KBC-2009 | 1.297 | 5.8 | 5.8 | 6.4 | 6.4 | 3.77 | 13.77 | ||
KBC-2006 | 6.4 | 6.4 | 6.4 | 6.4 | 2.24 | 12.24 | |||||
RSA | KBC-2009 | 1.000 | 4.6 | 5.2 | 5.8 | 6.4 | 3.84 | 13.84 | |||
KBC-2006 | 5.8 | 6.4 | 6.4 | 7.9 | 1.98 | 11.98 | |||||
15 | 0 | ESA | KBC-2009 | 1.322 | 2.8 | 5.8 | 6.4 | 7.9 | 9.7 | 12.26 | 12.26 |
KBC-2006 | 4.2 | 9.69 | 9.69 | ||||||||
RSA | KBC-2009 | 1.000 | 2.8 | 12.76 | 12.76 | ||||||
KBC-2006 | 4.7 | 8.89 | 8.89 | ||||||||
5 | ESA | KBC-2009 | 1.422 | 4.6 | 5.8 | 8.95 | 13.95 | ||||
KBC-2006 | 5.8 | 5.8 | 7.10 | 12.10 | |||||||
RSA | KBC-2009 | 1.000 | 4.6 | 5.8 | 8.95 | 13.95 | |||||
KBC-2006 | 6.4 | 6.4 | 5.59 | 10.59 | |||||||
10 | ESA | KBC-2009 | 1.521 | 5.8 | 6.4 | 6.4 | 6.54 | 16.54 | |||
KBC-2006 | 6.4 | 7.9 | 7.9 | 4.25 | 14.25 | ||||||
RSA | KBC-2009 | 1.000 | 4.6 | 5.8 | 6.4 | 8.95 | 18.95 | ||||
KBC-2006 | 6.4 | 6.4 | 7.9 | 5.37 | 15.37 | ||||||
20 | 0 | ESA | KBC-2009 | 1.510 | 2.8 | 5.2 | 6.4 | 10.8 | 13.4 | 17.32 | 17.32 |
KBC-2006 | 4.6 | 14.26 | 14.26 | ||||||||
RSA | KBC-2009 | 1.000 | 2.8 | 17.32 | 17.32 | ||||||
KBC-2006 | 4.6 | 14.26 | 14.26 | ||||||||
5 | ESA | KBC-2009 | 1.609 | 4.7 | 5.2 | 14.21 | 19.21 | ||||
KBC-2006 | 6.4 | 6.4 | 10.62 | 15.62 | |||||||
RSA | KBC-2009 | 1.000 | 3.5 | 5.2 | 16.12 | 21.12 | |||||
KBC-2006 | 5.8 | 5.8 | 12.08 | 17.08 | |||||||
10 | ESA | KBC-2009 | 1.707 | 5.8 | 6.4 | 6.4 | 11.51 | 21.51 | |||
KBC-2006 | 7.9 | 7.9 | 7.9 | 7.27 | 17.27 | ||||||
RSA | KBC-2009 | 1.000 | 4.2 | 5.2 | 6.4 | 14.95 | 24.95 | ||||
KBC-2006 | 5.8 | 6.4 | 6.4 | 11.51 | 16.51 | ||||||
As the inherent eccentricity of the example building increased, it was observed that the lateral stiffness of many example buildings designed via ESA method generally became larger than that of the buildings designed via RSA method. Such design trend shows that a building designed via RSA method is more economical than one designed via ESA method. On the other hand, the building which is designed in KBC-2006 and whose stiffness eccentricity and torsional amplification factor was relatively small showed different trend from the general trend. The reason for this was confirmed by various past studies [17, 18]. Fig. 3 shows the dynamic magnification factor proposed by these researchers, which shows that the smaller the inherent eccentricity is, the larger the dynamic magnification becomes. Fig. 4 shows the torsional amplification factor prescribed in Korean Building Code, which does different tendency of dynamic magnification factor in Fig. 3. As the inherent eccentricity is small, torsional amplification factor is small.
Table 3Lateral stiffness and eccentricity of the building designed via different design codes whose aspect ratio of example building is 3.0
CR (%) | CM (%) | Design method | Design code | Lateral stiffness (kN/mm) | After design (%) | ||||||||
Fr-1 | Fr-2 | Fr-3 | Fr-4 | Fr-5 | Fr-6 | Fr-7 | CR | CR+CM | |||||
10 | 0 | ESA | KBC-2009 | 1.369 | 5.2 | 5.2 | 5.8 | 6.4 | 7.9 | 8.7 | 9.7 | 7.75 | 7.75 |
KBC-2006 | 5.8 | 5.8 | 6.4 | 6.36 | 6.36 | ||||||||
RSA | KBC-2009 | 1.000 | 5.2 | 5.8 | 5.8 | 7.28 | 7.28 | ||||||
KBC-2006 | 5.2 | 5.8 | 5.8 | 7.28 | 7.28 | ||||||||
5 | ESA | KBC-2009 | 1.525 | 6.4 | 6.4 | 7.9 | 7.9 | 7.9 | 4.48 | 9.48 | |||
KBC-2006 | 7.9 | 7.9 | 7.9 | 7.9 | 7.9 | 2.09 | 7.09 | ||||||
RSA | KBC-2009 | 1.000 | 6.4 | 6.4 | 6.4 | 6.4 | 7.9 | 5.22 | 10.22 | ||||
KBC-2006 | 8.7 | 8.7 | 8.7 | 8.7 | 8.7 | 0.84 | 5.84 | ||||||
10 | ESA | KBC-2009 | 1.758 | 7.9 | 8.7 | 8.7 | 8.7 | 8.7 | 8.7 | 1.54 | 11.54 | ||
KBC-2006 | 9.7 | 9.7 | 9.7 | 9.7 | 9.7 | 9.7 | 0.00 | 10.00 | |||||
RSA | KBC-2009 | 1.000 | 7.9 | 7.9 | 7.9 | 7.9 | 7.9 | 8.7 | 2.08 | 12.08 | |||
KBC-2006 | 8.7 | 9.7 | 9.7 | 9.7 | 9.7 | 9.7 | 0.77 | 10.77 | |||||
15 | 0 | ESA | KBC-2009 | 1.645 | 4.2 | 5.8 | 6.4 | 7.9 | 9.7 | 10.8 | 13.4 | 11.73 | 11.73 |
KBC-2006 | 6.4 | 6.4 | 7.9 | 8.47 | 8.47 | ||||||||
RSA | KBC-2009 | 1.000 | 4.7 | 5.8 | 6.4 | 11.24 | 11.24 | ||||||
KBC-2006 | 6.0 | 6.4 | 7.9 | 8.81 | 8.81 | ||||||||
5 | ESA | KBC-2009 | 1.762 | 6.4 | 6.4 | 7.9 | 7.9 | 9.7 | 8.47 | 13.47 | |||
KBC-2006 | 8.7 | 8.7 | 8.7 | 8.7 | 4.68 | 9.68 | |||||||
RSA | KBC-2009 | 1.000 | 6.4 | 6.4 | 7.9 | 7.9 | 8.47 | 13.47 | |||||
KBC-2006 | 8.7 | 8.7 | 8.7 | 8.7 | 4.68 | 9.68 | |||||||
10 | ESA | KBC-2009 | 1.990 | 8.7 | 8.7 | 8.7 | 8.7 | 9.7 | 4.69 | 14.69 | |||
KBC-2006 | 10.8 | 10.8 | 10.8 | 10.8 | 10.8 | 1.63 | 11.63 | ||||||
RSA | KBC-2009 | 1.000 | 6.4 | 7.9 | 7.9 | 7.9 | 9.7 | 7.49 | 17.49 | ||||
KBC-2006 | 8.7 | 8.7 | 8.7 | 9.7 | 9.7 | 4.61 | 14.61 | ||||||
20 | 0 | ESA | KBC-2009 | 1.964 | 3.2 | 5.8 | 7.9 | 8.7 | 12.0 | 15.0 | 21.0 | 17.28 | 17.28 |
KBC-2006 | 7.9 | 8.7 | 8.7 | 8.7 | 11.25 | 11.25 | |||||||
RSA | KBC-2009 | 1.000 | 2.8 | 5.8 | 7.9 | 8.7 | 17.59 | 17.59 | |||||
KBC-2006 | 5.3 | 6.4 | 7.9 | 8.7 | 14.98 | 1498 | |||||||
5 | ESA | KBC-2009 | 2.067 | 6.4 | 6.4 | 7.9 | 8.7 | 12.0 | 14.07 | 19.07 | |||
KBC-2006 | 9.7 | 9.7 | 10.8 | 10.8 | 8.51 | 13.51 | |||||||
RSA | KBC-2009 | 1.000 | 4.7 | 5.8 | 7.9 | 8.7 | 15.91 | 20.91 | |||||
KBC-2006 | 7.9 | 7.9 | 7.9 | 8.7 | 12.00 | 17.00 | |||||||
10 | ESA | KBC-2009 | 2.205 | 8.7 | 8.7 | 8.7 | 8.7 | 12.0 | 10.64 | 20.64 | |||
KBC-2006 | 12.0 | 12.0 | 13.4 | 13.4 | 13.4 | 5.54 | 15.54 | ||||||
RSA | KBC-2009 | 1.000 | 5.8 | 5.8 | 7.9 | 8.7 | 12.0 | 14.97 | 19.97 | ||||
KBC-2006 | 7.9 | 7.9 | 8.7 | 8.7 | 12.0 | 11.70 | 16.70 | ||||||
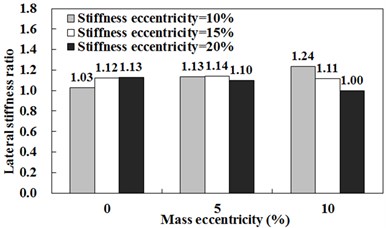
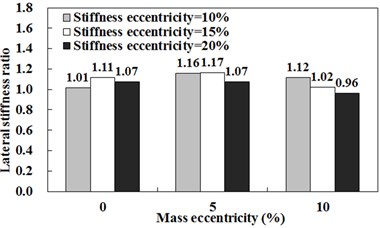
Shown in Fig. 5 and Fig. 6 are lateral stiffness ratio, which was calculated by dividing the sum of lateral stiffness in building via RSA method with one via ESA method except for unchanging lateral stiffness of building via both design methods. For example, in the case that stiffness eccentricities are 10 % and 15 % in buildings whose aspect ratio is 2, frames which are changed in lateral stiffness are frame-1~4 and frame-1~3 respectively. If the lateral stiffness ratio is equal to 1.0, lateral stiffness of building designed via RSA and ESA method is equal. If the lateral stiffness ratio is greater than 1.0, this means that design eccentricity including dynamic magnification in RSA is greater than eccentricity including torsional amplification factor in ESA.
Fig. 3Magnification factor proposed by various researcher [17, 18]
![Magnification factor proposed by various researcher [17, 18]](https://static-01.extrica.com/articles/16736/16736-img5.jpg)
Fig. 4Torsional amplification factor in KBC in according to aspect ratios and eccentricities
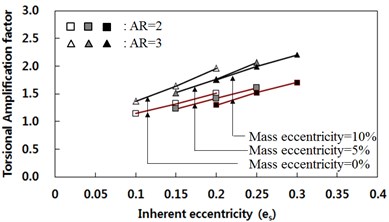
Fig. 5Aspect ratio is 2 with different stiffness eccentricity
a) 10 %
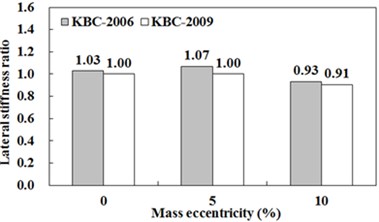
b) 15 %
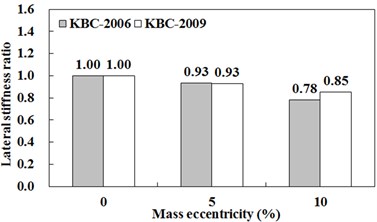
c) 20 %
Fig. 6Aspect ratio is 3 with different stiffness eccentricity
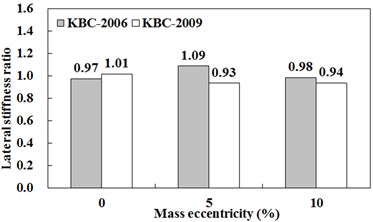
a) 10 %
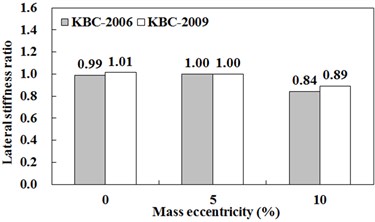
b) 15 %
c) 20 %
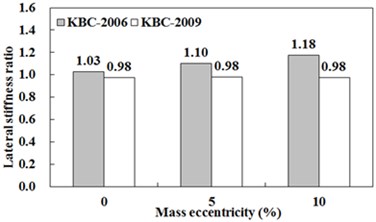
The design eccentricity of example buildings having relatively small inherent eccentricity (e.g. stiffness eccentricity is 10 %) among buildings designed in KBC-2006 underestimates dynamic magnification but one of building having relatively large inherent eccentricity (e.g. stiffness eccentricity is 20 %) overestimates it. On the other hand, the design eccentricity specified in KBC-2009 overestimate dynamic magnification in the case that inherent eccentricity is relatively large, but it reflects it more accurately than that in KBC-2006. This trend happens since design eccentricity in KBC-2009 and seismic design load in RSA method are smaller eccentricity in KBC-2006 and design load in ESA method respectively.
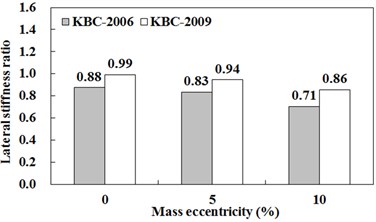
In UBC 97 [6], elastic response parameters may be reduced such that the corresponding design base shear is not less than 100 percent of the base shear determined in accordance with equivalent static analysis. Shown in Fig. 7 are lateral stiffness ratio that is calculated by using lateral stiffness in RSA specified in KBC-2006 and ESA in KBC-2009. In the case that design force in RSA method is equal to that in ESA method, it is observed that the torsional amplification factor of design eccentricity in KBC-2009 do not reflect dynamic magnification accurately except that inherent eccentricity is relatively large. In other words, dynamic magnification of torsionally imbalanced building is affected by the seismic design load of RSA method than design eccentricity of ESA method in KBC-2009.
Fig. 7Lateral stiffness ratio in the case that seismic design force in RSA is equal to that in ESA
a) Aspect ratio is 2
b) Aspect ratio is 3
4. Conclusions
To determine which design eccentricity in different codes reflect the torsional magnification more accurately, lateral stiffness of example building using equivalent static analysis and response spectrum analysis is compared. Below are the results of this study.
The design eccentricity of building having relatively small inherent eccentricity among building designed in KBC-2006 underestimates dynamic magnification but one of building having relative large inherent eccentricity overestimates it. The design eccentricity in KBC-2009 overestimates it in the case that inherent eccentricity is relatively large, but design eccentricity in KBC-2009 reflects the dynamic magnification more accurately than that in KBC-2006.
Dynamic magnification of a torsionally imbalanced building is affected by the seismic design force of RSA method than design eccentricity of ESA method in KBC-2009. In other words, design eccentricity including torsional amplification factor in KBC-2009 do not reflect dynamic magnification accurately.
References
-
Korean Building Code (KBC). Architectural Institute of Korea, 2009.
-
Minimum Design Loads for Buildings and Other Structures. American Society of Civil Engineers, Vol. 7, 2010.
-
Recommended Lateral Force Requirements and Commentary. Structural Engineers Association of California, 1988.
-
Uniform Building Code. International Conference of Building Officials, 1991.
-
Uniform Building Code. International Conference of Building Officials, 1994.
-
Uniform Building Code. International Conference of Building Officials, 1997.
-
NEHRP Guidelines for the Seismic Rehabilitation of Buildings. Report FEMA 273, Federal Emergency Management Agency, Washington D.C., 1997.
-
NEHRP Recommended Provisions for Seismic Regulations for New Buildings and Other Structures. Report FEMA 302, Federal Emergency Management Agency, Washington D.C., 1997.
-
Recommended Lateral Force Requirements and Commentary. Structural Engineers Association of California, 1999.
-
Prestandard and Commentary for the Seismic Rehabilitation of Building. Report FEMA 356, Federal Emergency Management Agency, Washington D.C., 2000.
-
NEHRP Recommended Provisions for Seismic Regulation for New Buildings and Other Structures. Report FEMA 368, Federal Emergency Management Agency, Washington D.C., 2000.
-
Minimum Design Loads for Buildings and Other Structures. American Society of Civil Engineers, Vol. 7, 2002.
-
NEHRP Recommended Provisions for Seismic Regulation for New Buildings and Other Structures. Report FEMA 450, Federal Emergency Management Agency, Washington D.C., 2003.
-
Minimum Design Loads for Buildings and Other Structures. American Society of Civil Engineers, Vol. 7, 2005.
-
Korean Building Code (KBC). Architectural Institute of Korea, 2006.
-
NEHRP Recommended Provisions: Design Examples. Report FEMA 451, Federal Emergency Management Agency, Washington D.C., 2006.
-
Dempsey K. M., Tso W. L. An Alternative path to seismic torsional provision. Soil Dynamics and Earthquake Engineering, Vol. 1, Issue 1, 1982, p. 3-10.
-
Chandler A. M., Hutchinson G. L. Evaluation of code torsional provisions by a time history approach. Earthquake Engineering and Structural Dynamics, Vol. 15, Issue 4, 1987, p. 491-516.
About this article

This work was supported by Basic Science Research Program through the National Research Foundation of Korea (NRF) funded by the Ministry of Education (NRF-2014R1A1A2056160).
