Abstract
Machines that generate vibroacoustic processes are tested at every stage of their life cycle. Since the greatest changes in the level of machines’ pulsation are occurring during the exploitation, vibration parameters are often used to evaluate their operation. Many years of research, whose results and conclusions are contained in the standards give a good methodological tool to assess the state of machines. The most commonly used standard is ISO 10816-1. Mechanical vibration. Evaluation of mechanical vibration by measurements on non-rotating parts – Part 1: General guidelines. On the other hand, the standard itself is not enough, the current monitoring parameters contained in the standard requires to hold or construction of easily configurable system for measuring, analyzing and archiving. This paper describes the work includes the methods of the measurement, the concepts of the measurement system and the method of the calculation, algorithm and software applications named VibroTest, created in National Instrument LabVIEW Environment. This authors system allows assessment of the machine under test, based on the signals generated by the tested machine.
1. Introduction
The decision making process on the state of the machine is usually assisted by technical diagnostic methods and determined by different types of indicators (attributes, symptoms). One defect can be observed by more than one symptom (e.g. in electrical machines by changes of characteristic of vibration, temperature and electromagnetic field). In the case of choosing the vibration as a physical phenomenon that reflects changes in the machine (in the case of electrical machines and internal combustion engines it is not essential useful process) can be determined by observing many of the symptoms in both the time and the frequency domains [1-8].
Collected over years of experience, especially those related to monitoring critical machines or systems, i.e. machines which accidents are extremely dangerous to human life, environmental degradation, the object and the energy system destruction.
These experiments resulted in:
– The construction of new machines, which are oriented diagnostically (designed for the diagnosis without additional steps, often equipped with built-in sensors or designed for sensors installation);
– Accordingly validated set of diagnostic criteria based on the phenomenon of mechanical vibrations, established and accepted by institutions, experts and authorities is converted to standard. Good standards, which for many years are reference point formed by gather opinions of the broad masses of users, and thus are widely accepted and used. In addition, the standards should be clear, concise and understandable. There are numerous standards that provide guidance for determination of an acceptable level of vibration parameters selected as the measurement shall be performed, and how the collected data should be analyzed. Some standards classify the status of machines based on vibration analysis. Former standards like ISO 2372:1974 Mechanical vibration of machines with operating speeds from 10 to 200 rev/s – Basis for specifying evaluation standards and DIN ISO 3945:1982 Mechanical vibration of large rotating machines with speed range from 10 to 200 rev/s – Measurement and evaluation of vibration severity in situ. These standards have been revised by ISO 10816-1:1995, as can be seen ISO 10816-1 is the background document describing the general requirements for evaluating machinery vibration on casing and foundation measurements. Moreover, ABS (American Bureau of Shipping) Guidance notes on ship vibration (established in 2006) in Section 7 Acceptance Criteria, Table 4 gives values containing the standard ISO 10816-1. Forty years of users’ experience led the standard only to be upgraded and expanded the standard for the next parts of each series of documents apply to different classes and types of machinery, and include specific evaluation criteria used to assess vibration severity. At present, it is possible to use this standard for permanent on-line condition monitoring of machines because the standard is often used as the first criterion to defines the moment when it must enable more advanced diagnostic tools for understanding the sources of damage and is a convenient and reliable source of creation of a general trend line of run down the machine under test.
– The construction of expandable measuring and analyzing system. The contributed to the development of all kinds of monitoring systems and diagnostic inference. There was a multi-step development of monitoring and diagnostic systems, from prototype that allowed to identify the current state of the machine, a commercial integrated hardware and software uniform measurement systems. Complex objects are often not tested with a single system, a single company but are an integration of existing hardware often different generations with different institutions, this first step can identify the current status of the machine allows to identify the current state of the machine. The second stage is software, who in an integrated manner converts the collected information. Most third stage involves selecting, using either hardware but any company that meets the compatibility requirements, write your own software for easy data pre-selection and then on that basis we expand the system with more sophisticated diagnostic procedures. It is possible also use the large financial resources to purchase any commercial monitoring system of one of the many renowned companies and adapt it to your needs. Both approaches lead to the same goal and their final functionality is similar. The cost of it is many times lower than the cost of buying ready system well known brand, which allows to carry out complex and extensive research for people starting a career research, people who do not have substantial funds from grants, and who conduct research under future grant and those for whom the typical functions of advanced systems are inadequate. In addition, modern measurement tools are often based on virtual instruments and apparatus. Virtual Instrumentation (VI) has long been used in the industry and the laboratories, because they create the possibility of free configuration of measurement and diagnostic systems.
– The methodology for measuring and evaluating vibration machines presented in this paper are based on ISO 10816-1 standard. Validation of proposed system was done in laboratory condition, while use has been done in the ship’s engine.
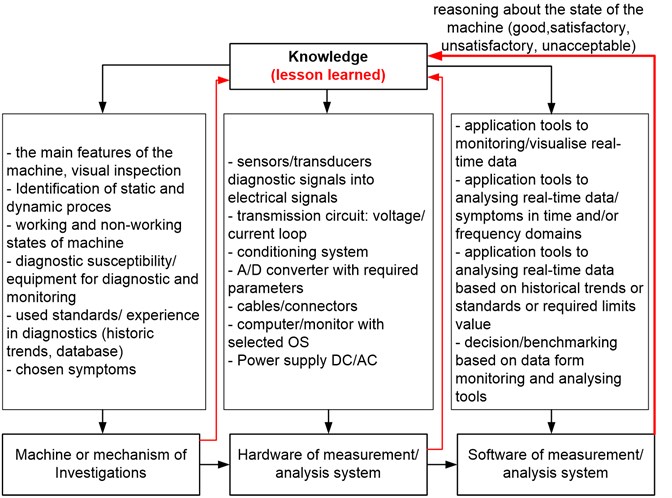
General view on components of the machines diagnostics system [8-12] with particular regard to the required knowledge necessary to design diagnostic system and correct inference about the state of the machine is shown in the Fig. 1. The developed application allows the measurement and analysis of vibroacoustic signals and is a virtual instrument [13, 14] that can be used both for research purposes (when the results of the program will be extended to their own unique criteria), as well as industrial and educational (when the results of the program will be limited to the criteria contained in the standard).
Modern measurement tools are often based on virtual instruments and apparatus. Virtual Instrumentation (VI) has been successfully used in the industry and the laboratories, for example in such researches [15-18].
The purpose of the application is to compare the measured values to the limit values and the threshold levels:
Limit values – levels of diagnostic parameters, symptoms recorded during the operation of the machine are a general assessment of the state to maintain a dynamic and broad-based security service. They have to be evaluated in terms of value by comparison with the levels permitted, under most of the standards.
Limit levels are qualitatively different category. These are the levels determined empirically or semi-empirically for the specific groups of machines, beyond which the limit level indicates the formation of the damage or the malfunction. Diagnosis should allow giving the warning or even the alarm.
The limit values are a measure of symptoms associated with a type of used the physical phenomenon (in this paper used the phenomenon of vibration) for the timing of the transition to the state border the state of the object in which its further exploitation is not desirable for the technical or the economic reasons.
But it’s always a form of presentation, which should be adapted to the capabilities of the perception, the decision-making and the executive members of the target object. Hence, a large role to play in this regards for modern information technologies.
Fig. 1General view on components of the machines diagnostics system
2. Methodology of measurement of the mechanical vibration
2.1. Vibration measurement methodology based on ISO 10816-1
Factors affecting the accuracy of the measurement in the time and the frequency domains are as follows:
– The frequency band depends on the type and the individual characteristics of the machine but most commonly used is 10-1000 Hz;
– Velocity measured in three orthogonal directions -- (Sample distribution of measuring points is presented on Fig. 2);
– Velocity measured at the operation of the machine;
– The vibration measuring instruments complying with the conditions of the effective speed of the frequency band;
– The permissible error of 10 %;
– Averaging measuring time is at least 1 s;
– Measuring devices with dignity with the recommended instructions;
– The measurement is performed on the machine shaft axis;
– The vibration transducers mounted a way to provide a linear signal processing;
– The measured values read from the highest speed (on-line in real-time).
The vibration transducers mounted in the correct manner, which does not introduce additional error. Table 1 describes the machines vibrations limits.
Table 1Permissible values of vibration in relationship to state of the machine: A – good, B – satisfactory, C – unsatisfactory, D – unacceptable
RMS velocity [m/s 10-3 10÷10000 [Hz] within the following ranges | Class machine to be test | ||||
I | II | III | IV | ||
– | 0,71 | A | A | A | A |
0,71 | 1,12 | B | |||
1,12 | 1,8 | B | |||
1,8 | 2,8 | C | B | ||
2,8 | 4,5 | C | B | ||
4,5 | 7,1 | D | C | ||
7,1 | 11,2 | D | C | ||
11,2 | 18 | D | |||
18 | – | D | |||
Class I – machines may be separated driven, or coupled units comprising operating machinery up to approximately 15 kW (approx 20 HP);
Class II – machinery (electrical motors 15 kW (20 HP) to 75 kW (100 HP)) without special foundations or rigidly mounted engines or machines up to 300 kW (400 HP) mounted on the special foundations;
Class III – machines are large prime movers and other large machinery with large rotating assemblies mounted on rigid and heavy foundations, which are reasonably stiff in the direction of the vibration;
Class IV – includes large prime movers and other large machinery with large rotating assemblies mounted on foundations, which are relatively soft in the direction of the measured vibration (i.e., turbines generators or gas turbines greater than 10 MW (approx. 13500 HP) output).
Fig. 2Sample distribution of measuring points during vibration diagnostics of the generating set [2]
![Sample distribution of measuring points during vibration diagnostics of the generating set [2]](https://static-01.extrica.com/articles/16685/16685-img2.jpg)
2.2. Guidelines for the selection parameters of the measurement sensors
The quality of the transducers effects on the quality of the data. The results are dependent on air temperature, humidity, magnetic, vibration, other equipment, and installation errors. To obtain correct results are used properly prepared parts of the measuring circuit to eliminate the factors affecting the measurement.
An important element is the correct installation and the placement of the sensors on the machine body. Transducers are fixed and arranged in three directions in accordance with the -- coordinate system on the test machine frame. The transducers must ensure the linear conversion of the signal generated by the machine in the range of 10 to 1000 Hz (or other frequency band according to evaluated machine and experience of investigator). The mass of the transducer must be no more than 1/10 of the mass of the vibrating machine.
The most frequently used vibration transducers are accelerometers. Each accelerometer used in the measuring procedure should have the calibration chart. The most important parameters which contents the calibration chart are: name and type of accelerometers, serial number, reference sensitivity, range of frequency, mounted resonance frequency, measuring range, characteristic of sensitivity (amplitude and phase) vs. frequency and environmental condition of using that.
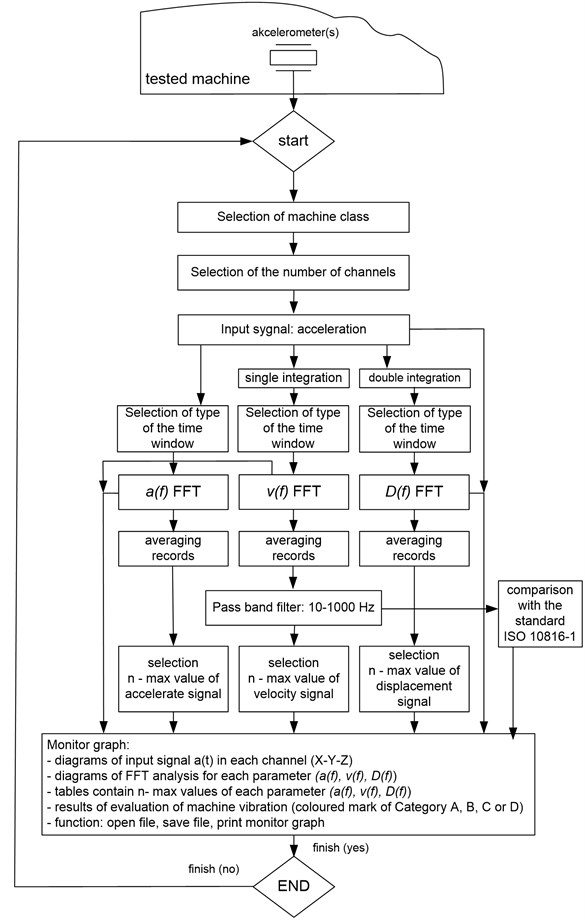
Fig. 3Algorithm of signal processing and visualization tips for assessment of the equipment and the machines
We have the following notation during the measurement and analyses:
a) Acceleration of vibration (as function of time) – :
– Peak: .
b) Velocity (as function of time) – :
– Peak: ;
– RMS: .
c) Displacement (as function of time) – :
– Peak: .
Algorithm evaluation of the equipment based on the vibration measurement methodology presented together with the flow diagram of the diagnostic information from the sensor through the signal processing, the maximum value of the spectrum in the spectral analysis of the acceleration, the velocity and the displacement of the vibration and determines the effective value of the vibration in the band 10-1000 Hz presents in the following section [2].
2.3. Algorithm for assessment of the equipment and the machines on the basis of the vibroacoustic signals
The task of the developed algorithm (see Fig. 3) is the acquisition and processing of measuring data and visualization according to the methods of measurement and evaluation of vibration machines for their technical diagnostics according to standard ISO 10816-1 [19]. Its purpose is to provide a well-defined finite sequence of steps required to complete the planned tasks. The algorithm consists of the blocks performing the steps of the program. The first step is placing the block start, which is responsible for running the program. The next step is to select a group of machines after that we must select the channels that correspond to the amount contained accelerometers on the body of the machine under test. Then, the input signal (acceleration) is processed by a Hanning window procedure time in order to minimize the effects of leakage in the designation of the spectrum.
The resulting spectrum of the acceleration is illustrated in the chart. For the velocity spectrum signal generated by the machine is integrated, and then processed by a Hanning window of time and displayed on the graph. The next step is to obtain a spectral displacement by double integration of the original signal, and then processed by the procedure time window. The spectrum of the movement is shown in the chart. The next step is to present a few largest amplitudes (in this case four) and velocity spectra for displacement spectrum. Then, the calculation of the effective displacement spectra and compare it with the standard ISO 10816-1 [19]. The last element of this algorithm is the record of the data and the selection of a new program or exits the application.
3. Application for acquisition, processing, archives, visualization and evaluation of the mechanical vibration of the tested machines
3.1. Description of application VibroTest realized in LabVIEW
A program to evaluate the state of the machine based on vibroacoustic signals implemented in LabView programming environment from National Instruments. The application is called VibroTest. LabView is the environment in which programmed in a graphical language. Software requirements include the operating systems, such as: Linux, Windows, Mac OS X. The program is created with the graphic symbols and the lines that connect the blocks. Each block performs a specific function according to which we convert the input signal into an output signal. In the following section we describe the structure of a software application for the evaluation of machine vibrations VibroTest.
The standard requires a velocity measurements in three axes --. The program was carried out using three identical processing channels, all of them are responsible for processing the signal from the accelerometer for one axis, wherein the measurement is performed.
3.2. The VibroTest graphic user interface
The Graphical User Interface is used as operator panel for the measurement and the evaluation of the vibration machine under test, according to ISO 10816-1 [19]. The final score of the program is the task of determining the status of the test machine. The user begins the work of the channel selection and determination of the group to which the test machine. The four groups are distinguished machines that are divided into power and their size. The first group includes motors up to 15 kW. Then there are engines from 15 to 75 kW and 300 kW machines. The third group consists of more than 300 kW machines and motors with power above 75 kW, which satisfy the conditions of the rigid setting. The last group is a machine with a capacity of more than 300 kW and motors with power above 75 kW, which satisfy the conditions of the elastic settings. Then, on the button, the selection of the group to which the test machine and the selection of the group. The next step is to go to the charts. The first graph shows the signal generated by the machinery. VibroTest Graphical user interface GUI indicates the status of the machine under test is presented on Fig. 4.
The second graph shows the spectrum of the acceleration expressed as function of frequency – . The next chart is the velocity spectrum expressed, as . The last graph is the expressed spectrum shift, as function. Acceleration is the magnitude of vibration and the frequency range is from 10 to 1000 Hz. Speed is the integral of the acceleration, and the whole of the speed gives displacement. Vibration velocity measured in three orthogonal directions. Spectra were used to depict the graphs. In each chart there are blocks showing frequency and amplitude. The blocks are provided to illustrate the amplitude, of which is dependent on frequency. There are three blocks of frequency and amplitude for each graph. Each block is dependent on the attached channel. With these buttons one can determine the amplitude at any given frequency. The next element is to provide the 4 largest amplitudes in the range of 10 to 1000 Hz.
Fig. 4VibroTest Graphical user interface GUI indicates the status of the machine under test
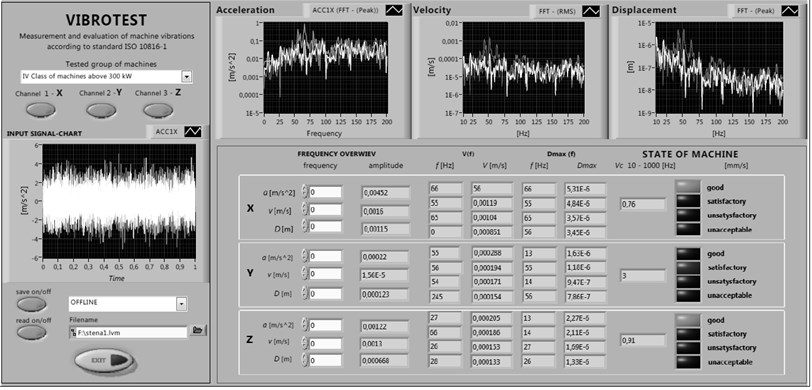
In the first row there were placed four maximum amplitudes for the velocity. The next row contained were four maximum displacement amplitude. For each maximum amplitudes we arranged blocks to show a particular frequency corresponding to a relevant amplitude. For each measured maximum amplitudes are determined. Next are estimated the effective velocities (). With this value, one can specify the operating status of the machine. We determine the state of the machine according of the ISO 10816-1 [19]. The standard has been defined ranges for the respective groups of machines.
Four states are distinguished, if the first condition is good that the program determines the color green, the next state is satisfactory. Color describing this state is dark green. The third state is temporarily and acceptable color describing this status is yellow. The last condition is a state machine that displays unacceptable here we have red color. Therefore, next to a table with maximum values, there are four indicators similar to LEDs that are to inform the user who is responsible for the condition of the tested machine.
3.3. The arrangement of diagnostic LabVIEW application for evaluation of machine vibration in on-line diagnostics system
Nowadays there are a huge number of technical solutions to construct and the different types of the components of the measurement system [8]. Essential to the construction of a monitoring system measuring chain always consists of the following elements: sensor (analog component which changes the mechanical physical value (velocity, acceleration) on the input into the electrical physical value (current or voltage) at the output with integrated preamplifier or outside preamplifier (the preamplifier in the sensor is generally related to the operating temperature sensor), cable transmission path that allows most often to analog signal transfer, measuring preamplifier (often acting as the conditioning the signal to system), the analog-digital transducer embedded in a microprocessor system or remaining outside it, and software (now a broad range of software available on the market). The more open and vulnerable to changes made by the user, it is the better. In the authors’ opinion LabView National Instruments fulfill above requirements.
Fig. 5Scheme of the system for measuring and evaluating the condition of the machine under test (based on LabVIEW VibroTest application)
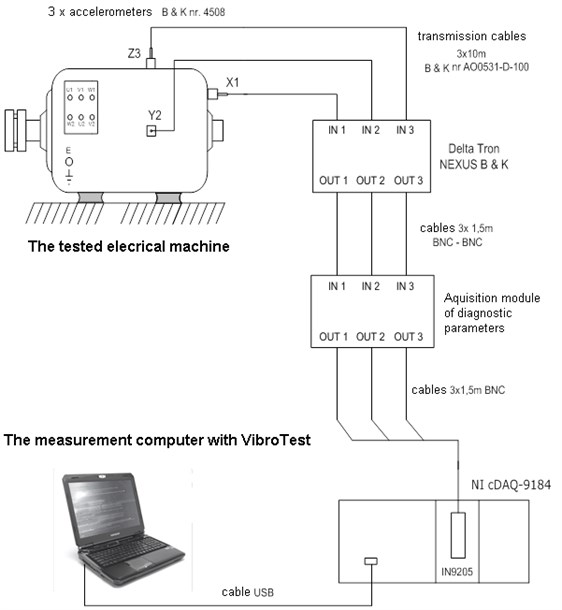
As mentioned above range of applications and the software is enormous. Choice often depends on the price, availability, the user’s preferences and held equipment. Starting from this premise it is not the aim of the authors’ favor to give a particular solution of hardware or software. The reliability of the research requires, to recall the precise equipment used for this research. To carry out the measurement and the evaluation we used the following vibration measuring system presented in Fig. 5 with remarks:
– fasteners for accelerometers B&K;
– 3 accelerometers B&K type 4508;
– 3×10 m measurement cables B&K No. AO 0531-D-100;
– 4-channel preamplifier DeltaTron® B&K Nexus (signal transmission in currant loop 4-20 mA);
– 3×1,5 m measurement cables coaxial BNC-BNC;
– the diagnostic parameters of data acquisition module;
– the measuring system of National Instruments NI cDAQ-9184;
– the USB cable connects to the computer measurement system;
– the measuring system with the application VibroTest.
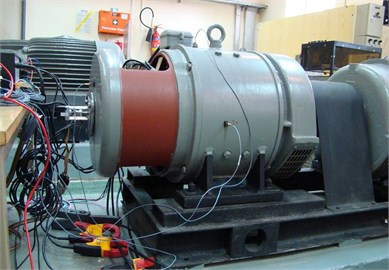
The system for measuring and evaluating the vibration condition of the machine under test is a subsystem of diagnostic system of parameter of electrical machines and diesel engines on ships. We illustrate tested diagnostic system in laboratory in Fig. 6. Moreover, in Fig. 7 is shown the arrangement of accelerometers of the system.
Fig. 6The system for measuring and evaluating the vibration condition of the machine under test which is a subsystem of the diagnostic system of parameter of the electrical machines
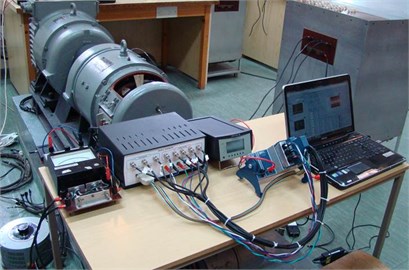
Fig. 7The arrangement of the accelerometers of the system for measuring and evaluating the vibration condition of the machine under test as a subsystem of diagnostic systems of parameters of the electrical machines
4. Summary
The article presents a developed program VibroTest – virtual engineering tool to assess the state of the machine basis on generated noise, vibration, and harshness (NVH) processes using LabVIEW software. The methodology for measuring and evaluating the vibration of the machines based on the ISO 10816-1 standard [19]. Based on lessons, we learned and developed parts of the program; the application allows for a further extension of the other standards as well as the procedures based on the author experience and his knowledge.
As part of the work on the basis of analysis of the literature and recommendations contained in the standard, there was developed algorithm based on the evaluation of the machines noises and the vibration signals. Continuation of the built up algorithm was the development and the implementation of applications for acquisition, measurement data processing and visualization of the acronym VibroTest. The result is an application that allows the analysis of the vibroacoustic signals, based on the ISO 10816-1 standard [19]. The use of VibroTest application accelerates measurements and automatically evaluates the vibration machines in the laboratory, in the ship’s engines and auxiliary rooms, and in industry on the installation and technological lines. During calibration VibroTest system in laboratory condition, was established the measurement error. The error is the result of the inaccuracies in the processing program used to measure the acceleration, the velocity and the displacement of the vibration (based on the single and the double integration of the single sinusoidal signals). For the first integral (velocity parameter) in the frequency range of 10-1000 Hz error does not exceed 2.48 %. Measurement error is greater for the double integral and is 3.52 %.
Using VibroTest system in real conditions is the subject of authors’ next publication focus on vibroacoustic measurements and diagnostics of ships drive and hull. But further studies are directed towards the application of automatic effective recognition processes to the virboacoustic imaging (e.g. artificial intelligence algorithms – artificial neural networks, multidimensional analysis – supportive vectors machine). Such systems are successfully used in identification of acoustic images used in supporting long-term environmental monitoring systems [20-23].
References
-
Żółtowski B., Niziński S. Modeling Process of Machine Operation. Manual, Bydgoszcz-Sulejówek, 2002.
-
Listewnik K. Symptoms of Limit States Ship Synchronous Generator in the Diagnosis of Electric Power Set. Ph.D. Thesis, Polish Naval Academy, Gdynia, 2002.
-
Listewnik K. Getting information about the relationship between the defect symptom marine synchronous generators for diagnostic purposes of generating sets. Proceedings of Conference on Automation and Exploitation of Control and Communication, Jastrzębia Góra, 2003, p. 315-322.
-
Listewnik K. Examination of technical state marine genset under varying load conditions by vibroacoustical method. Proceedings of International Conference Perspectives and Development Systems Rescue, Security and Defence in the XXI Century, Balt Military Expo, Gdańsk, 2005, p. 415-422.
-
Listewnik K. Symptoms of defects synchronic generator for diagnostics of ship’s generating set. Journal of Conference of Military Technique, Kielce, 2000.
-
Listewnik K. Symptoms of limit values of synchronous generator set of ship for the diagnosis of electrical plant. Scientific Journal of Polish Naval Academy (SJ of PNA), Vol. 47, 2006, p. 69-74.
-
Listewnik K., Polanowski S., Dereszewski M., Żukowski J. Preliminary evaluation of effective vibration analysis for the fault diagnosis of natural gas engine-driven compressor. Journal of KONES, Vol. 18, 2011, p. 243-250.
-
Grzeczka G., Listewnik K. Microcomputer based diagnostics system. Proceedings of International Carpathian Control Conference, 2001, p. 467-472.
-
Czech P., Wojnar G., Burdzik R. Application of the discrete wavelet transform and probabilistic neural networks in IC engine fault diagnostics. Journal of Vibroengineering, Vol. 16, Issue 4, 2014, p. 1619-1639.
-
Burdzik R., Konieczny L. Application of Vibroacoustic Methods for Monitoring and Control of Comfort and Safety of Passenger Cars, Mechatronic Systems, Mechanics and Materials II. Book Series: Solid State Phenomena, Vol. 210, 2014, p. 20-25.
-
Jamro E., Cioch W. Digital signal acquisition and processing in FPGAs. Przegląd Elektryczny, Vol. 85, Issue 2, 2009, p. 7-9.
-
Jamro E., Wielgosz M., Bieniarz S., Cioch W. FPGA-ARM heterogeneous system for high speed signal analysis. Solid State Phenomena, Vol. 180, 2012, p. 207-213.
-
Chruściel M. LabVIEW. Manual, BTC Legionowo, 2008.
-
Jerome J. Virtual Instrumentation Using LabVIEW. PHI Learning Pvt. Ltd., 2010, p. 416.
-
Barański R., Wszołek G. Educational implementation of a sound level meter in the LabVIEW environment. Archives of Acoustics, Vol. 38, Issue 1, 2013, p. 19-26.
-
Barański R. Sound level meter as software application. Acta Physica Polonica A, Vol. 125, Issue 4A, 2014, p. 66-70.
-
Dąbrowski D., Jamro E., Cioch W. Hardware implementation of artificial neural networks for vibroacoustic signals classification. Acta Physica Polonica A, Vol. 118, Issue 1, 2010, p. 41-44.
-
Dąbrowski D., Cioch W. Neural classifiers of vibroacoustic signals in implementation on programmable devices (FPGA) – comparison. Acta Physica Polonica A, Vol. 119, Issue 6A, 2011, p. 946-949.
-
The Standard ISO 10816-1. Mechanical Vibration. Evaluation of Mechanical Vibration by Measurements on Non-Rotating Parts – Part 1: General Guidelines.
-
Klaczynski M., Wszolek T. Artificial intelligence and learning systems methods in supporting long-term acoustic climate monitoring. Acta Physica Polonica A, Vol. 123, Issue 6, 2013, p. 1024-1028.
-
Wszołek T., Kłaczyński M. Automatic detection on long-term audible noise indices from corona phenomena on UHV AC power. Acta Physica Polonica A, Vol. 125, Issue 4A, 2014, p. 93-98.
-
Klaczynski M., Wszolek T. Detection and classification of selected noise sources in long-term acoustic climate monitoring. Acta Physica Polonica A, Vol. 121, Issue 1A, 2012, p. 179-182.
-
Klaczynski M. Identification of aircraft noise during acoustic monitoring by using 3D sound probes. Acta Physcia Polonica A, Vol. 125, Issue 4A, 2014, p. 144-148.
About this article
