Abstract
This paper proposes a modified three-dimensional capacity spectrum method to efficiently evaluate the seismic behavior of a building structure with asymmetric walls, where twisting is induced due to lateral loading. This method utilizes the demand surfaces and capacity curves that are created based on the inelastic earthquake response and seismic capacity of the asymmetric wall system, respectively. These two parameters are calculated from the displacement, torsional rotation angle and force coordinates of the structure under seismic loading. The seismic retrofit strategy of existing structures can be effectively determined by applying the proposed three-dimensional capacity spectrum method. In this procedure, a new performance point indicating the enhanced performance of the structure can be easily found by the modification of demand surfaces or capacity curves. The seismic evaluation and retrofitting strategies based on this approach are also discussed.
1. Introduction
The effects of earthquakes can be devastating especially to existing building structures that are not based on earthquake resistant design. This effect is especially significant for the buildings with asymmetric wall systems. Even if they retain a sufficient level of strength, damage in some members with low ductility caused by torsional moment can lead to the collapse of the entire structural system. Therefore, an accurate evaluation on the seismic performance of such a system should be conducted, and seismic retrofitting may be required depending on the results of the evaluation.
Various studies have been conducted on the deformation capacity of the asymmetric wall system for its seismic design and evaluation. According to Priestley et al. [1], the strength and stiffness of the structural wall system are correlated, which is a major consideration in the seismic evaluation of the wall system. Priestley and his co-workers [1-3] suggested a direct displacement-based design method of reinforced concrete frames and wall structures without considering a torsional effect. In this method, displacement is used as an important design variable from an early stage of the design, while the seismic base shear force is obtained as a result of the design. This approach converts a multiple degrees of freedom system to an equivalent nonlinear single degree of freedom system to obtain the base shear force from the displacement spectrum and can consider the inelastic deformation characteristics of the structure without utilizing the response modification factor.
Paulay [4, 5] suggested a torsional design method based on the assumption that the stiffness of a structural wall is proportional to its strength. In this approach, asymmetric wall structures are categorized into either a torsionally restrained or unrestrained system, depending on the existence of structural members perpendicular to the seismic load. The torsional mechanisms of these systems are considered in the design process. Fujii et al. [6] proposed a nonlinear analysis of asymmetric structures by utilizing the ratio between natural frequency and torsional rotation as an indicator to define torsionally stiff and flexible buildings. Hong and Cho [7, 8] developed a displacement-based seismic design method for asymmetric-plan buildings that can evaluate the seismic demand by considering the torsional mechanisms of the asymmetric building.
This study intends to extend the basic concepts of the direct displacement design [1-3] and the torsion design method by Paulay [4, 5] and to combine them with the torsional mechanism based approach by Hong and Cho [7, 8] in order to effectively evaluate the seismic performance of asymmetric wall structures. It makes use of the demand surface and capacity curve as in the standard capacity spectrum method [9-11], and utilizes the three-dimensional coordinates of displacement, torsional rotation and force to calculate performance points. The seismic evaluation and retrofitting strategies based on this approach are also discussed.
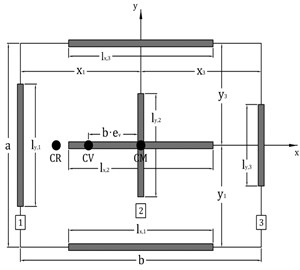
Fig. 1Single story asymmetric wall model for seismic evaluation
2. Modified capacity spectrum method
This section reviews the original capacity spectrum method presented in Applied Technology Council-40 (ATC-40) [10] and the work of other researchers [9, 11] and discusses the modified capacity spectrum method proposed by Hong and Cho [8]. The main objective of the original capacity spectrum method is to easily determine the peak response of an inelastic single-degree-of-freedom (SDF) system without performing a dynamic analysis of the inelastic SDF system. It is a well-known seismic evaluation method among structural engineers and is currently widely used for seismic evaluation and retrofit of buildings in many seismic design codes, for example, American Society of Civil Engineers 41 (ASCE 41) [12].
As illustrated in Fig. 2, this method is mainly composed of the following four steps: 1) Obtain the pushover curve, which is the relationship between base shear and roof displacement (Fig. 2(a)); 2) Convert the pushover curve into a capacity curve (Fig. 2(b)); 3) Convert the elastic spectrum (or design spectrum) from the standard pseudo-acceleration versus natural period format to the pseudo-acceleration versus deformation spectrum ordinate format (A-D format) to obtain the demand spectrum curve. (Fig. 2(c)); 4) Map the demand and capacity spectrum curves into the same coordinate system and determine the displacement demand (performance point) (Fig. 2(d)). The displacement demand obtained in Step 4 can be converted into global displacement and individual component deformation, which in turn can be compared with the limiting values for specified performance goals. In this methodology, the elastic spectrum with 5 % damping ratio is modified into an inelastic spectrum with the effective damping ratio corresponding to an expected inelastic response. This method requires an iterative process, in which an inelastic response spectrum is calculated from an assumed performance point.
If the direct displacement design method is utilized, the single demand curve corresponding to the effective damping ratio can be derived without any iteration. In the original capacity spectrum method, the plot needs to be reduced in the entire range of the spectrum due to inelastic response of a structure. In contrast, the approach proposed by Hong and Cho [8] requires only a partial modification of the spectrum as shown in Fig. 3. If the yield displacement of the structure () is known in the acceleration-displacement spectrum (A-D format), the displacement axis can be converted into the displacement ductility () axis. As an effective damping ratio () can be expressed as a function of the displacement ductility, the elastic acceleration-displacement spectrum can be modified into the acceleration-displacement by utilizing an appropriate spectrum reduction factor (), for example, the one provided by Eurocode 8 [13]:
Fig. 2Original capacity spectrum method [11]
![Original capacity spectrum method [11]](https://static-01.extrica.com/articles/16526/16526-img3.jpg)
a)
![Original capacity spectrum method [11]](https://static-01.extrica.com/articles/16526/16526-img4.jpg)
b)
![Original capacity spectrum method [11]](https://static-01.extrica.com/articles/16526/16526-img5.jpg)
c)
![Original capacity spectrum method [11]](https://static-01.extrica.com/articles/16526/16526-img6.jpg)
d)
As a result, even without comparing with the capacity curve, the spectrum acceleration reduced by considering the effective damping ratio can be directly drawn for a certain range of spectrum displacement. As shown in Fig. 3, if spectral displacement is smaller than yield displacement, there is no change in the spectrum, but if it is greater than the yield displacement (or the displacement ductility is greater than 1), the spectrum is modified. This modified capacity spectrum method can represent the inelastic demand spectrum on a single spectrum, thus no iterative calculations are required, resulting in a more efficient methodology to obtain the performance point.
Fig. 3Modified capacity spectrum method for symmetric structures [8]
![Modified capacity spectrum method for symmetric structures [8]](https://static-01.extrica.com/articles/16526/16526-img7.jpg)
3. Seismic performance evaluation for asymmetric wall systems using a modified three-dimensional capacity spectrum method
A variety of torsional responses may take place for a single displacement ductility, and the effective damping ratio corresponding to each of these torsional responses can also vary as discussed in [7, 8]. Under these circumstances, the capacity spectrum methods illustrated in Fig. 3 have limited applicability as they do not consider the torsional response of a structure. Therefore, it is required to consider the torsional rotation in addition to the displacement and acceleration in the demand spectrum when analyzing asymmetric wall structures.
Fig. 4 illustrates the basic concept of a modified capacity spectrum method for asymmetric wall structures, which utilizes a three-dimensional coordinate system consisting of spectral acceleration, spectral displacement and torsional rotation. Even in the wall structures with an identical plan, a modification on the strengths of individual walls can lead to varying strength eccentricity ratios. The use of different strength eccentricity ratios may increase the yield displacement of the system and may change its effective damping ratio, thus different modified spectrums are obtained for each strength eccentricity ratio as shown in Fig. 4(b). If the demand spectrums in Fig. 4(b) are expressed simultaneously on a three-dimensional coordinate system consisting of acceleration, displacement and strength eccentricity ratio, the demand surface shown in Fig. 4(c) can be obtained. The strength eccentricity can be expressed as a relation between torsional stiffness and rotation angle, and the stiffness of a wall can be determined by its strength. Therefore, the strength eccentricity ratio can be converted to the torsional rotation. The demand surface shown in Fig. 4(c) can be converted in the one given in Fig. 4(d), which is expressed as a function of acceleration, displacement and torsional rotation. By performing a push-over analysis, a capacity curve can be plotted in this coordinate system. Then, the point where the demand surface meets the capacity curve can be defined as the performance point. This procedure requires complicated calculations, it is convenient for practical applications of the developed seismic evaluation method to write a separate program based on it using script languages such as MathCAD and Matlab and utilize the developed software.
Fig. 4Modified three-dimensional capacity spectrum method for asymmetric structures
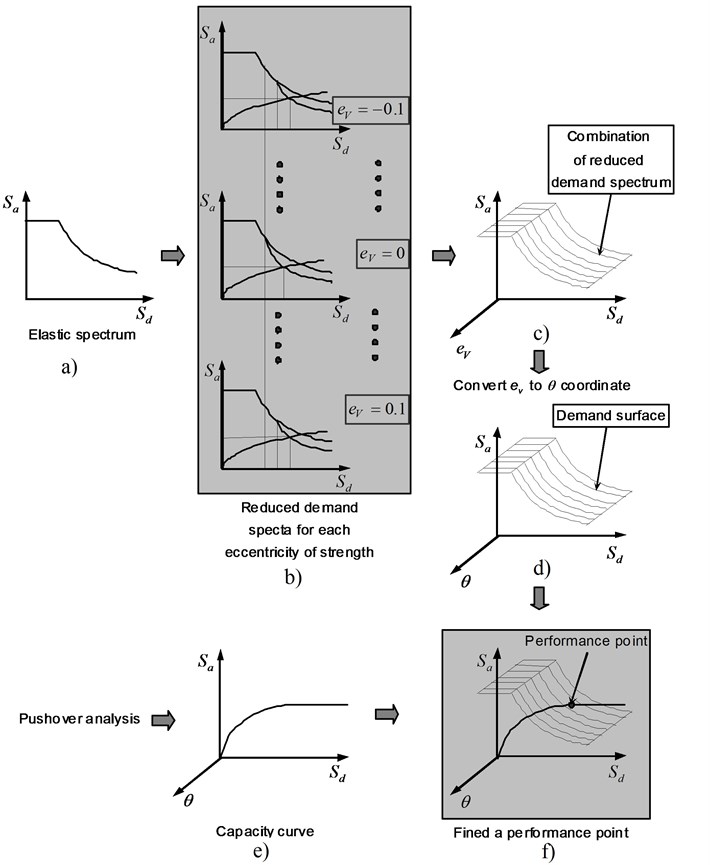
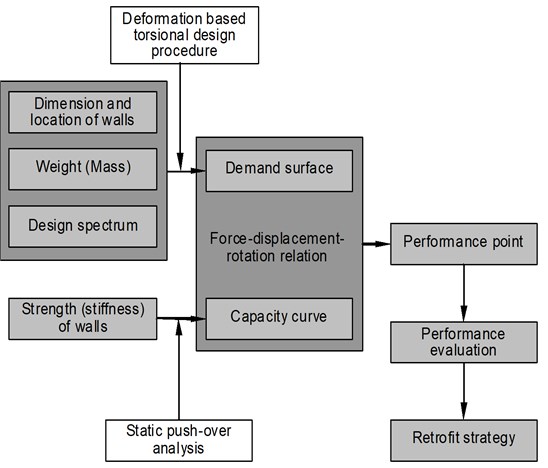
Fig. 5 summarizes the seismic evaluation process discussed up to this point. The demand surface is determined from the dimensions and location of walls, structure weight and design spectrum for an expected seismic activity, while the capacity curve is determined by strengths and stiffness of wall members. By plotting the demand surface and capacity curve on a single force-displacement-torsional rotation coordinate system, the performance point for the expected earthquake can be found. From this result, it is possible to perform an effective seismic evaluation and establish a retrofit strategy.
Fig. 6 shows an example of a performance point obtained by plotting the demand surface and capacity curves in the coordinate system consisting of force, displacement and torsional rotation. In this example, a geometrically symmetric wall structure is considered. Figs. 6(a) and 6(b) show the views of the same plot from different angles. The demand surface is symmetric with respect to the plane where the torsional rotation is zero due to the geometrical symmetry of the structure. The demand surface in the figure shows a variety of seismic demands for the structures with equal geometric shape, but different strength ratios among the walls. Consequently, the demand surface is made up of a series of curves with equal performance levels and strength eccentricities.
Fig. 5Process of seismic evaluation using the modified three-dimensional capacity spectrum method for asymmetric wall systems
A capacity curve can be obtained by performing a static push-over analysis on an asymmetric wall system. Whenever a laterally resisting member yields, the lateral and torsional stiffness of the system changes, thus the capacity curve is expressed as a nonlinear relation between strength, displacement and rotation angle. Since the capacity curve is determined by the strengths of individual laterally resisting members, there exist many curves for a system with an identical geometric shape depending on a variety of factors such as base shear force and strength eccentricity ratio. This is in contrast to the demand surface, where only one surface exists for a single geometric shape.
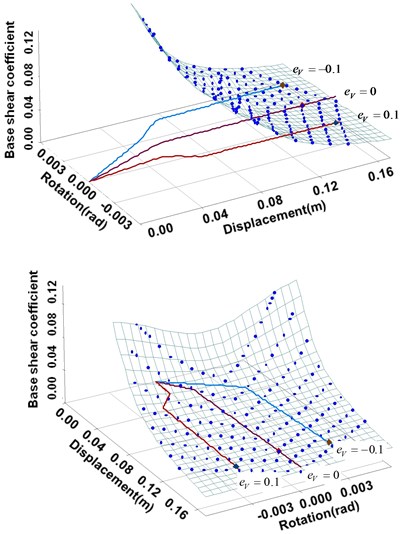
Figs. 7 and 8 show different capacity curves for a single demand surface with different base shear forces and strength eccentricity ratios, respectively. The wall structure is the same as the one in Fig. 6. Fig. 7 shows the capacity curves, in which base shear forces are 0.025, 0.05 and 0.075 for a strength eccentricity ratio of zero. Here, is the effective weight of the system. Fig. 8 shows the capacity curves, in which strength eccentricity ratios are –0.1, 0 and 0.1 for a single a single base shear force of 0.25.
In Fig. 7, a larger base shear force indicates larger strengths of individual walls. The larger the base shear force, the closer the performance point lies to the elastic area of the capacity curve. Thus, a low ductility demand is required for the expected seismic event. In Fig. 8, in the cases of the strength eccentricity ratios of 0.1 and –0.1, the system shows a torsional response due to the asymmetric distribution of the wall strength and stiffness. A similar behavior can also be observed in the change of slope of the capacity curve that occurs when a wall yields. As another interesting observation, it can be noticed from the figure that, in the cases of the strength eccentricity ratios of 0.1 and –0.1, the performance points are located near the collapse point of the capacity curve. Therefore, this indicates that the level of a strength eccentricity may enhance or deteriorate the seismic performance of the asymmetric wall structure even for an identical base shear force.
Fig. 6Performance point obtained from the demand surface and capacity curve
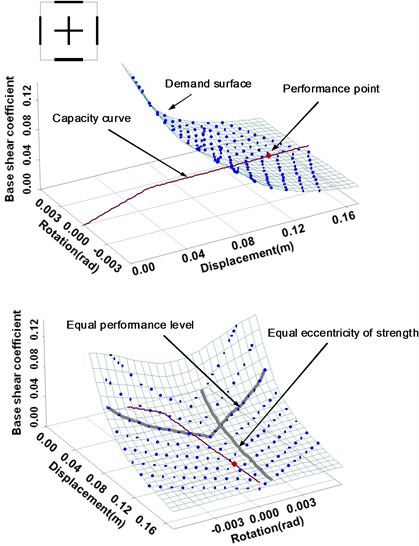
Fig. 7Capacity curves depending on different base shear forces
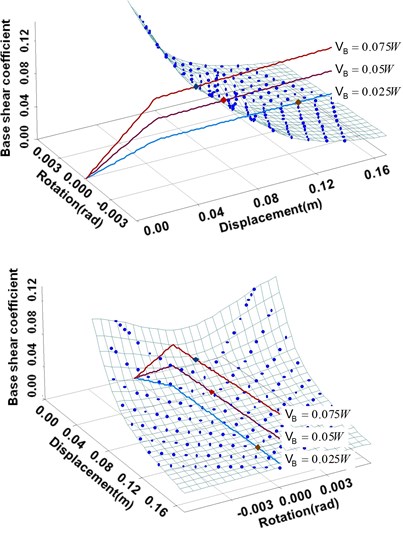
Fig. 8Capacity curves depending on different strength eccentricity ratios
4. Seismic evaluation and retrofitting strategies using the modified three-dimensional capacity spectrum method
In the proposed method, the performance point obtained from the demand surface and capacity curve indicates the inelastic torsional response of an asymmetric wall structure expressed in terms of load, displacement and rotation angle to an expected seismic load. It is possible to effectively utilize the proposed method in determining the retrofitting strategy of systems with insufficient seismic capacity. The retrofitting strategies can be either of adjusting the capacity curve or demand surface. In most cases, retrofitting involves the adjustment of both capacity curve and demand surface.
4.1. Seismic retrofitting strategies by capacity curve adjustment
It can be noted from Figs. 7 and 8 that the seismic performance of a structure can be enhanced by adjusting its capacity curve while keeping its demand surface unchanged. In other words, it is possible to obtain an enhanced capacity of the structure by changing the strength or stiffness of individual members without any modification on their geometric configurations. The following is the examples of retrofitting methods based on this idea.
1) Adjustment of strength (or stiffness) eccentricity: The strength eccentricity can be adjusted by increasing or decreasing the strength of some wall members in the direction of seismic force. If the wall lengths do not change in this process, the demand surface remains constant.
2) Increasing the ductility capacity of individual wall members: If the ductile capacities of individual wall members are increased without changing their strength and stiffness, the capacity curve becomes longer, resulting in the same effect as having the performance point moved inside the capacity curve.
3) Increasing the strength of individual wall members: If the overall strengths of individual wall members increase, the seismic performance can be enhanced without adjusting the strength eccentricity. As shown in Fig. 7, an enhanced seismic performance can be obtained with increasing base shear force, even if the strength eccentricity remains constant.
4.2. Seismic retrofitting strategies by demand surface adjustment
As the demand surface is determined by the geometric configuration and mass of individual walls and design spectrum of the system, it can be adjusted by changing the lengths and positions of the walls as well as their addition and removal. In most cases, a change in the demand surface is accompanied by that in the capacity curve. The following is the examples of retrofitting methods based on this idea.
1) Addition of walls in the direction of seismic force or increasing their lengths: If walls are added in the direction of seismic force or their lengths are increased, the yield displacement and maximum deformation capacity of the walls are changed. As a result, this leads to the change in the target design displacement and effective damping coefficient, thus finally the modification of the demand surface. At the same time, the capacity curve is also changed due to the change in the wall strength and stiffness.
2) Addition of walls in the perpendicular direction to seismic force or increasing their lengths: If the ratio between the total base shear force of the walls in the perpendicular direction to seismic force and that of the walls in the direction of seismic force (defined as ) is increased, the slope of base shear coefficient becomes less steep with respect to the strength eccentricity ratio. Therefore, if there exists a large difference between the given strength eccentricity ratio and that of the optimal torsional response, the seismic performance of the system can be enhanced by increasing the strengths of the walls in the perpendicular direction to seismic force.
Fig. 9Demand surface and capacity curve of the example before retrofitting
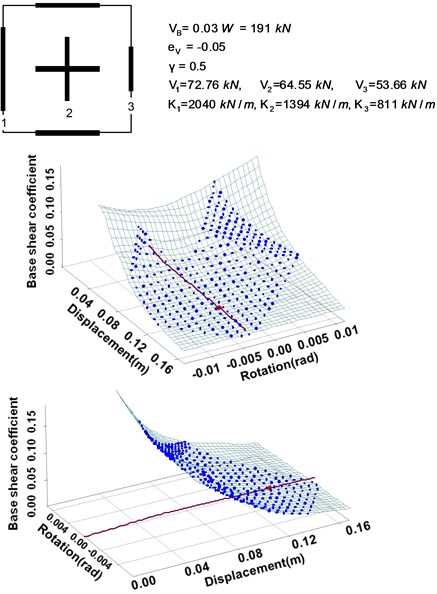
Fig. 10Seismic retrofitting strategy A: Increasing strength and stiffness of Wall 3
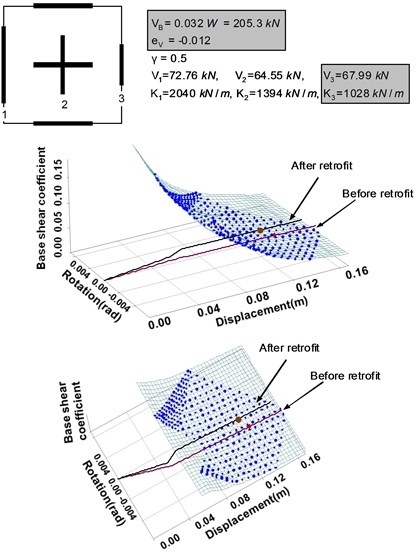
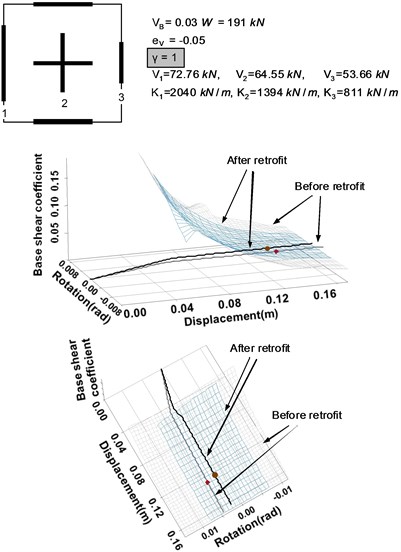
Fig. 11Seismic retrofitting strategy B: Increasing the overall torsional resistance of the system
4.3. Seismic retrofitting example
Based on the two strategies discussed above, this section discusses an example of seismic retrofitting. The example structure basically consists of three types of walls, as illustrated in Fig. 9. The detailed values for the parameters of this system are also indicated in the figure. The base shear force ratio is 0.5. The strength eccentricity ratio is given as –0.05, from which the strengths (design load) of the three walls (Wall 1, 2 and 3) in the direction of seismic force are set to be 72.76 kN, 64.55 kN and 53.66 kN, respectively. The three-dimensional demand surface and capacity curve can be obtained from the geometric configuration of the system and the strengths of the individual walls as shown in Fig. 9. Among many possible strategies, the following two can be considered for seismic retrofitting of the given system.
1) Seismic retrofitting strategy A: If the strength of Wall 3 is increased without changing its length, the strength and stiffness eccentricities of the system change, thus leading to the change in the capacity curve, as shown in Fig. 10. Since the geometric configuration of the wall system is not changed, the demand surface remains unchanged. The strength eccentricity of the system is changed from –0.05 to –0.012 due to the change in the strength of Wall 3 from 53.66 kN to 67.99 kN. As can be seen from the figure, this finally results in the decrease of the torsional rotation angle at the performance point.
2) Seismic retrofitting strategy B: If the base shear force ratio of the system is increased from 0.5 to 1 by increasing the strengths of the perpendicular walls to the seismic load, the torsional resistance of the system is also increased. This results in the change of the demand surface as well, as shown in Fig. 11. It demonstrates that the new performance point obtained by the application of the strategy B has a smaller rotational angle and displacement than those of the original system.
5. Conclusion
In this paper, we proposed a new modified three-dimensional capacity spectrum method to efficiently evaluate the seismic behavior of a building structure with asymmetric walls, where twisting is induced when subjected to lateral loading. This method utilizes the demand surfaces and capacity curves that are created based on the inelastic earthquake response and seismic capacity of the asymmetric wall system, respectively. These two parameters are calculated from the displacement, torsional rotation angle and force coordinates of the structure under seismic loading. The seismic retrofit strategy of existing structures can be effectively determined by applying the proposed three-dimensional capacity spectrum method. In this procedure, new performance points, which indicate the enhanced performance of the structure, can be easily found by the modification of demand surfaces or capacity curves. The numerical experiments performed in this paper indicate that the proposed approach is highly efficient in determining the seismic retrofitting strategies of an asymmetric wall structure.
References
-
Priestly M. J. N., Calvi G. M., Kowalsky M. J. Displacement-based seismic design of structures. Earthquake Spectra – Earthq Spectra, Vol. 24, Issue 2, 2008.
-
Priestley M. J. N., Kowalsky M. J. Direct displacement-based seismic design of concrete buildings. Bulletin, New Zealand National Society for Earthquake Engineering, Vol. 33, 2000, p. 421-444.
-
Priestley M. J. N., Kowalsky M. J. Aspects of drift and ductility capacity of rectangular cantilever structural walls. Bulletin, New Zealand National Society for Earthquake Engineering, Vol. 31, 1998, p. 73-85.
-
Paulay T. Torsional mechanisms in ductile building systems. Earthquake Engineering and Structural Dynamics, Vol. 27, Issue 10, 1998, p. 1101-1121.
-
Paulay T. A simple displacement compatibility-based seismic design strategy for reinforced concrete buildings. 12th World Conference on Earthquake Engineering, 2000, p. 0062.
-
Fujii K., Nakano Y., Sanada Y. A Simplified nonlinear analysis procedure for single-story asymmetric buildings. Journal of Japan Association for Earthquake Engineering, Vol. 4, Issue 2, 2004.
-
Hong S.-G., Cho B.-H. Deformation based seismic design of asymmetric wall structures. Earthquake Engineering Society of Korea, Vol. 6, Issue 1, 2002, p. 43-53.
-
Cho B.-H., Hong S.-G. Displacement based seismic design of asymmetric-plan buildings. KEERC-MAE Joint Seminar on Risk Mitigation for Regions of Moderate Seismicity, University of Illinois at Urbana-Champaign, 2001, p. 361-370.
-
Freeman S. A. Review of the development of the capacity spectrum method. ISET Journal of Earthquake Technology, Vol. 41, Issue 1, 2004, p. 1-13.
-
ATC-40, Seismic Evaluation and Retrofit of Concrete Buildings. Applied Technology Council for the Building Seismic Safety Council, Washington, D.C., 1996.
-
Chopra A. K., Goel R. K. Capacity-demand-diagram methods based on inelastic design spectrum. Earthquake Spectra, Vol. 15, Issue 4, 1999, p. 637-656.
-
ASCE 41-13, Seismic Evaluation and Retrofit of Existing Buildings. American Society of Civil Engineers, 2013.
-
Eurocode (EC) 8: Design of Structures for Earthquake Resistance – Part 1 General Rules, Seismic Actions and Rules for Buildings (EN 1998-1). CEN (Comité Européen de Normalisation), Brussels, 2004.
About this article
This research was supported by a Grant from Architecture and Urban Development Research Program funded by Ministry of Land, Infrastructure and Transport of Korean Government (Grant No. 15AUDP-B066083-03).
