Abstract
Compared with conventional time-frequency analysis method, synchrosqueezing wavelet transformation (SST) exhibits high resolution capability and good application effect. In this study, SST is introduced to ground-penetrating radar (GPR) processing. This method is applied to analyze a continuous electromagnetic signal. SST can obtain a higher resolution and a better processing effect than conventional wavelet transform and short-time Fourier analysis. In the application of GPR forward analysis data, the transform can correctly distinguish different interfaces and objects. Its resolution increases as frequency increases. However, compression wavelet modulus gradually decays as frequency increases. The proposed method is applied to detect tunnel lining under actual conditions and in a strong noise background. Indeed, the method can efficiently identify interfaces and abnormalities.
1. Introduction
With geophysical technology development, various detection technologies have been invented to solve detection problems in engineering construction. Ground-penetrating radar (GPR) has been commonly applied to archaeology, geologic investigation, and civil engineering because it is efficient, cost effective, and accurate [1-4]. Since 2010, the number of studies on GPR has reached 10,000 per year according to Google Scholar; furthermore, the number of research subjects increases every year. Detection results are directly influenced by the quality of signal processing; however, signal analysis is a key problem. Signal processing involved in GPR is Fourier transform. A nonstationary signal cannot be analyzed correctly because Fourier transform is impeded by time-frequency location. Various methods, such as short-time Fourier transform, Hilbert-Huang transform, and wavelet transform, have been proposed to overcome the limitations of Fourier transform [5-7].
Wavelet transform not only overcomes the defects of Fourier transform but also adjusts the size of time-frequency windows. The former can also be applied to perform a multiscale analysis of signals. Wavelet transform has been employed in GPR signal processing and achieved remarkable effects [8]. In general, the analysis of these remarkable effects influences the selection of basis function in wavelet transform. Huang Norden focused on nonstationary and nonlinear signals and proposed Hilbert-Huang transform, which includes two steps, namely, empirical mode decomposition and Hilbert spectral analysis. Hilbert-Huang transform does not require pre-selected basis functions [9, 10]. This method has been used to process GPR data, but a firm mathematical basis of Hilbert-Huang transform has yet to be developed. However, neither Hilbert-Huang transform nor wavelet transform can solve the modal mixing phenomenon in modal decomposition [11, 12]. Daubechies proposed synchrosqueezing wavelet transformation (SST), which is based on continuous wavelet transform; in SST, wavelet coefficients are squeezed in a time-frequency domain. Even if the function is nonharmonic, an SST algorithm obtains instantaneous frequency [13, 14]. Herrera also proposed and introduced an SST algorithm to the time-frequency analysis of a seismic signal. SST algorithms can achieve higher accuracy than other algorithms. The influence on analysis results is not evident in basis function selection [15-17]. Therefore, GPR signals should be processed with the SST algorithm and the time-frequency characteristics of abnormalities should be analyzed to improve GPR technology.
In this study, the SST algorithm is introduced to GPR signal analysis. First, the principle and implementation steps of the SST algorithm are provided. The SST algorithm is used to process continuous electromagnetic signals. The proposed algorithm is then compared with a traditional method. Second, the GPR data of a forward simulation model are processed with the SST algorithm to examine its time-frequency characteristics. Finally, the GPR data are considered to evaluate the effect of noise removal on the actual detection of tunnel lining.
2. Theory and methodology
2.1. SST algorithm
In practical engineering, one signal contains multiple components, and each of the components represents one feature. A signal is composed of a group of harmonics, and the remainder is expressed as follows:
where is the amplitude and is the residue.
The SST algorithm is based on wavelet analysis theory. In this study, is processed with the following wavelet transform:
where is the scale factor, is the time shift, is the complex conjugate of the mother wavelet.
According to Plancherel theorem, is the wavelet coefficient . The equation can be written as follows:
where and are the mother wavelet function and signal , respectively, after Fourier transform is performed.
In , the instantaneous frequency of can be preliminarily estimated as follows:
In the synchrosqueezing phase, where , the energy is converted from a time-scale plane to a time-frequency plane. The synchrosqueezing value of wavelet coefficients are obtained by determining the wavelet coefficients in the central frequency domain:
where is the wavelet synchrosqueezing coefficient.
When the signal is discrete, the wavelet synchrosqueezing coefficients are expressed as follows:
where is the central frequency in .
2.2. Comparative analysis of the continuous electromagnetic signal sample
We apply conventional wavelet transform, short-time Fourier transform, and SST algorithm to analyze the transient electromagnetic wave signal and to determine the solution of the SST algorithm for time-varying signal processing. The time-varying signal of analytical expressions is represented as follows [18]:
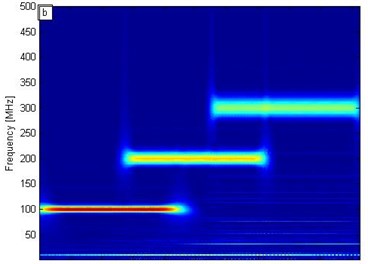
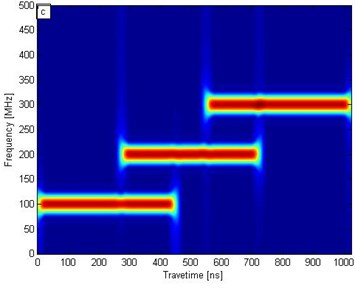
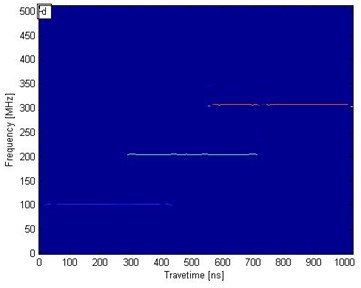
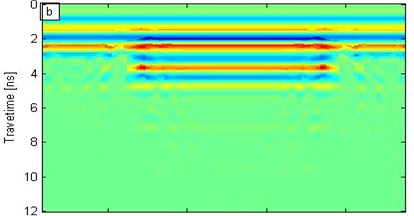
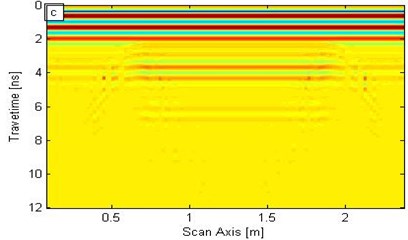
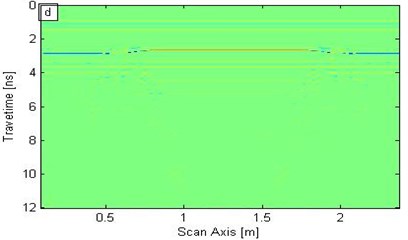
Fig. 1a) Synthetic signal of time-varying electromagnetic signal, b) conventional wavelet transform, c) short-time Fourier transform, d) SST results
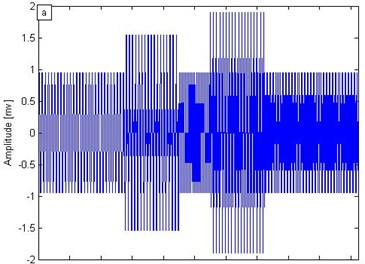
a)
b)
c)
d)
The signal mainly contains three main frequency components: 100, 200, and 300 MHz. The respective time sections are 0-499, 274-723, and 550-1024 ns. In the continuous signal sampling, the sampling rate is 1000 and the time window is 1024 ns. Fig. 1(a) illustrates .
To analyze the effect of the SST algorithm on electromagnetic signal processing, we transformed with SST, conventional wavelet transform, and short-time Fourier transform. Figs. 1(b), 1(c), and 1(d) correspond to the conventional wavelet transform, short-time Fourier transform, and SST frequency distribution contour, respectively. In Fig. 1(b), the wavelet transform results show that the frequencies of 100 and 300 MHz are detected at the highest and lowest resolutions, respectively; the resolution time-frequency decreases as the frequency increases. In Fig. 1(c), the short-time Fourier transform results demonstrate that frequency slightly influences resolution. In Fig. 1(d), the SST results reveal three straight lines corresponding exactly to three different frequencies: 100, 200, and 300 MHz. In Figs. 1(b), 1(c), and 1(d), the conventional wavelet transform and short-time Fourier transform results indicate an evident banded range, whereas the SST results accurately display the frequency and time location. Therefore, SST can distinguish time-frequency more precisely and yield a higher resolution than the two conventional conversion methods.
3. Engineering applications
3.1. Forward numerical simulation model
GPR forward is its data interpretation basis. The finite-difference time-domain method (FDTD) is the most common numerical technique for solving the problems of the electromagnetic field. The FDTD method can be applied directly to the finite differential instead of Maxwell local field differential equations in order to get the field components of the finite difference formula. We use space grid to simulate purpose body having the same electrical parameters and set the appropriate initial and boundary conditions for field computing space to obtained the numerical solution of variables in Maxwell’s equations [19].
We use a three-layer structure model. The uppermost layer is air, the middle layer is concrete, and the bottom layer is dry sand. A rectangular void is placed in the dry sand layer. The model size and location are shown in Fig. 2. Both the concrete and sand layers have thicknesses of 0.15 m, while the internal hole size is 0.05×1.3 m. The GPR signal of the model can be obtained through numerical simulation.
Fig. 2Schematic of geometric model
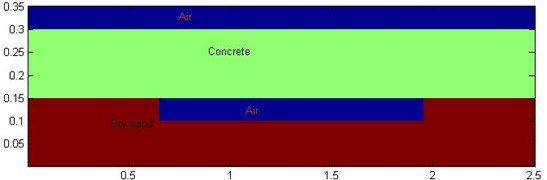
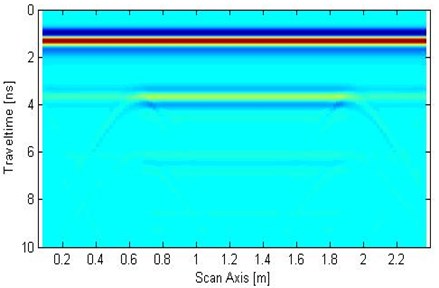
In the forward process, the parameters are dry sand permittivity Eq. (3), conductivity (0.0001 S/m), and concrete permittivity Eq. (6), conductivity (0.005 S/m). The set calculation area is 2.5 m×0.35 m, the computational grid size is 0.0025 m, and the time window is 12 ns. Ricker wave is employed as excitation, the dominant frequency is at 900 MHz, the transceiver antenna distance is 0.025 m, and the analogue sampling is 125 traces. The result was simulated by FDTD, as shown in Fig. 3. The FDTD method is performed for GPR signals of time series at all traces. Fig. 3 shows the GPR signal at first trace. The measurement line direction is the -axis, and time is the -axis in ordinate. The time-series signal of 125 traces is synthesized, and the result is displayed using image mode in Fig. 4.
Fig. 3GPR signal at first trace
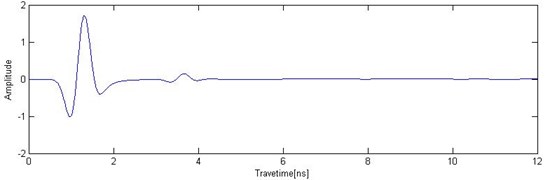
Fig. 4Forward numerical simulation signal of GPR
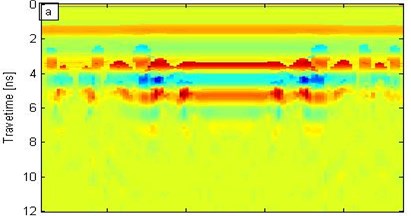
The wavelet modulus is obtained in the time-frequency domain and is synchrosqueezed for the wavelet synchrosqueezing modulus in the central frequency domain by utilizing the SST algorithm of the forward signal transform. Four frequency moduli, namely, 500 MHz, 900 MHz, 1.5 GHz, and 3.0 GHz are then analyzed (Fig. 5).
Fig. 5Different frequency wavelet synchrosqueezing moduli
a) 500 MHz
b) 900 MHz
c) 1.5 GHz
d) 3.0 GHz
In Fig. 5, the synchrosqueezing modulus exhibits low resolution when the frequency is relatively low; by contrast, the frequency is relatively high, the synchrosqueezing modulus yields high resolution, but the modulus strength is weak. Figs. 5(b) and 5(c) correspond to the frequencies of 900 MHz and 1.5 GHz, respectively; the void significantly affected the synchrosqueezing modulus. Figs. 5 (b) and 5(c) show that the modulus within a certain frequency range can identify the interface and defects. Therefore, the SST transformation can distinguish different interfaces and exceptions; furthermore, resolution increases as frequency increases. However, the modulus strength decreases as frequency increases.
3.2. Application analysis of tunnel lining detection
A tunnel lining detection signal is used as an example to evaluate the denoising effect of SST on practical engineering. The tunnel detection site is shown in Fig. 6(a). During the tunnel lining survey, there were three are three detection lines respectively located at the vault and the left and right waist. The three survey lines were arranged along the tunnel in the longitudinal direction. The three survey lines and the lining thickness for detecting defects, as well as the survey line layout are shown in Fig. 6(b).
Fig. 6GPR tunnel lining detection
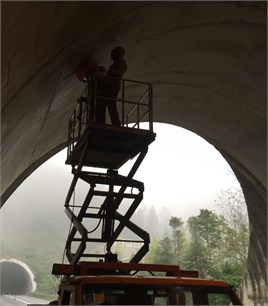
a) GPR measurement on the spot
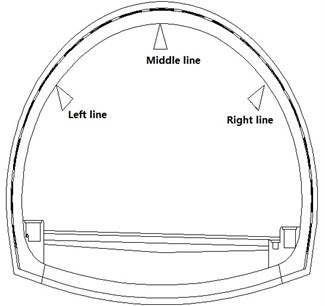
b) Measurement line sketch
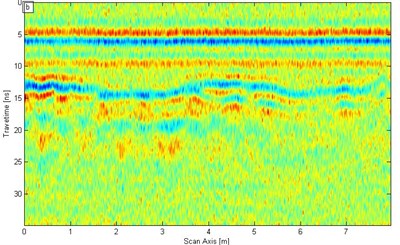
The instrument employed in this analysis is LTD2100 GPR. The sampling center frequency is 0.4 GHz, the time window is 35 ns, and the trace spacing is 0.015 m. The chosen length of the target section is 8 m in left survey line. The detection results are shown in Fig. 7(a). The reflected signal of the secondary lining bottom interface appears within 10 ns of the simulation. The reflected signal is also a steel arch, which is shown in the initial lining. In general, the containing noise signal is denoising data minus original noiseless data, and the ratio of signal to noise energy is regarded as signal to noise ratio (SNR). We can use this parameter to measure the denoising effect. The formula is as follows:
where is , is square norm, is original noiseless data, and is containing noise data.
In the SST filtering process, referred to as SNR in this study, is 0.290 (−5.369 dB). The original signal in Fig. 7(a) joins the strong interference. White noise is added, and the result is shown in Fig. 7(b). With white noise interference, the interface between the second lining and the initial lining is extremely fuzzy, and the steel arch reflection signal in the primary lining is also not evident. The signal of the GPR is processed through SST filtering to verify whether the noise effect is removed [Fig. 7(b)].
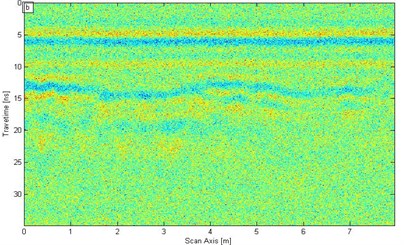
In the SST filtering process, the signal is conducted through the SST conversion [Fig. 7(b)] is based on the SST theory in Section 2.1. A low-pass filter is used to separate more than 0.7 GHz signal. Then, the wavelet synchrosqueezing modulus is subjected to SST inverse transform [Fig. 8(b)]. In addition, the ‘db4’ wavelet is also adopted during conventional wavelet denoising for comparison to SST. Fig. 8(a) illustrates the result of the wavelet denoising function in MATLAB.
Fig. 7Detection section of GPR tunnel lining
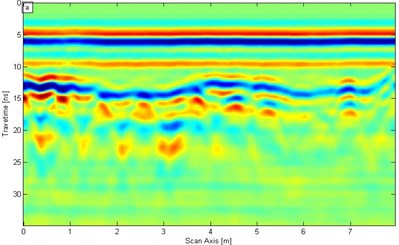
a) Original signal
b) Addition of white noise signal
Fig. 8Signals after a) wavelet denoising and b) SST filter denoising
a)
b)
We improve the signal resolution by using the two methods on the basis of the analysis of the results in Fig. 8. The lining structure, such as the interface between the second lining and the initial lining and the steel truss in the second lining are showed clearly in Fig. 8. However, the SST filtering effect is much clearer than conventional wavelet. After wavelet denoising is applied, according to Eq. (7) the SNR is 1.048 (0.203 dB); the SNR then increases 3.6138 times. After SST filter denoising is performed, the SNR is 3.261 (5.133 dB); the SNR then increases 11.2448 times. Therefore, the denoising effect of SST is much better than that of the conventional wavelet transform.
4. Conclusions
On the basis of the SST algorithm, we introduce the transform to GPR signal processing. A time-frequency analysis method of the GPR is proposed in this paper. Continuous electromagnetic signal, GPR forward data, and practical GPR data are analyzed with SST. The following conclusions can be drawn:
1) The SST algorithm can correctly identify the structure of the interface and different anomalies.
2) The SST algorithm can be applied in frequency analysis more accurately than the conventional wavelet transform.
3) The SST algorithm correctly separates the interference from the signal even in a strong-interference environment; this algorithm also effectively removes noise.
The SST algorithm is more complex than conventional algorithm; this algorithm also exhibits a relatively low processing efficiency. Hence, the algorithm should be improved to upgrade its efficiency.
References
-
Zhao W., Forte E., Pipan M., et al. Ground Penetrating Radar (GPR) attribute analysis for archaeological prospection. Journal of Applied Geophysics, Vol. 97, Issue 10, 2013, p. 107-117.
-
Szymczyk P., Szymczyk M. Non-destructive building investigation through analysis of GPR signal by S-transform. Automation in Construction, Vol. 55, Issue 1, 2015, p. 35-46.
-
Orlando L., Pezone A., Colucci A. Modeling and testing of high frequency GPR data for evaluation of structural deformation. NDT&E International, Vol. 43, Issue 3, 2010, p. 216-230.
-
Mahmoudzadeh Ardekani M. R. Off- and on-ground GPR techniques for field-scale soil moisture mapping. Geoderma, Vol. 201, Issue 6, 2013, p. 55-66.
-
Böniger U., Tronicke J. High-resolution GPR data analysis using extended tree-based pursuit. Journal of Applied Geophysics, Vol. 78, Issue 1, 2012, p. 44-51.
-
Lai W. L., Kind T., Wiggenhauser H. Using ground penetrating radar and time–frequency analysis to characterize construction materials. NDT&E International, Vol. 44, Issue 1, 2011, p. 111-120.
-
Gurbuz A. C., Mcclellan J. H., Scott Jr. W. R. Compressive sensing of underground structures using GPR. Digital Signal Processing, Vol. 22, Issue 1, 2012, p. 66-73.
-
Daubechies I. Ten Lectures on Wavelets. Acoustical Society of America Journal, Vol. 93, Issue 3, 1993, p. 1671.
-
Huang N. E., Wu Z. A review on Hilbert-Huang transform: method and its applications to geophysical studies. Reviews of Geophysics, Vol. 46, Issue 2, 2008, p. 1-23.
-
Chen C., Jeng Y. Natural logarithm transformed EEMD instantaneous attributes of reflection data. Journal of Applied Geophysics, Vol. 95, Issue 5, 2013, p. 53-65.
-
Wang T., Zhang M., Yu Q., et al. Comparing the applications of EMD and EEMD on time-frequency analysis of seismic signal. Journal of Applied Geophysics, Vol. 83, Issue 6, 2012, p. 29-34.
-
Li J., Liu C., Zeng Z., et al. GPR Signal denoising and target extraction with the CEEMD method. IEEE Geoscience and Remote Sensing Letters, Vol. 12, Issue 8, 2015, p. 1615-1619.
-
Daubechies I., Lu J., Wu H. Synchrosqueezed wavelet transforms: An empirical mode decomposition-like tool. Applied and Computational Harmonic Analysis, Vol. 30, Issue 2, 2011, p. 243-261.
-
Wang X., Wang B., Wang W., et al. Harmonic signal extraction from chaotic interference based on synchrosqueezed wavelet transform. Acta Physica Sinica, Vol. 24, Issue 8, 2015, p. 3-7.
-
Herrera R. H., Han J., Baan M. V. D. Applications of the synchrosqueezing transform in seismic time-frequency analysis. Geophysics, Vol. 79, Issue 79, 2014, p. 55-64.
-
Wang P., Gao J., Wang Z. Time-frequency analysis of seismic data using synchrosqueezing transform. IEEE Geoscience and Remote Sensing Letters, Vol. 11, Issue 12, 2014, p. 2042-2044.
-
Herrera R. H., Tary J. B., van der Baan M., et al. Body wave separation in the time-frequency domain. IEEE Geoscience and Remote Sensing Letters, Vol. 12, Issue 2, 2015, p. 364-368.
-
Xian-Wu Z., Yun-Ze G. Application of generalized S transform with lowpass filtering to layer recognition of Ground Penetrating Radar. Chinese Journal of Geophysics, Vol. 56, Issue 1, 2013, p. 309-316.
-
Giannopoulos A. Modelling ground penetrating radar by GprMax. Construction and Building Materials, Vol. 19, Issue 10, 2005, p. 755-762.
About this article
This research was funded by the National Natural Science Foundation of China (Grant No. 11132003) and the Jiangsu Province Post-Doctor Foundation of China (Grant No. 1401124C). We thank for Wang Hailong (Chongqing Test Center of Geology and Minerals) providing us with the GPR tunnel lining detection data. Many constructive comments from Professor Cao Maosen (Hohai University), the anonymous referees, and the editors are greatly appreciated.
