Abstract
In this paper we investigate an issue of multiple seismic events. Such events might occur in the case of both natural and mine-induced seismicity. In this paper we investigate an issue whether the distances between two overlapping impulses can be derived from a noisy seismic vibration measurement if the impulses are not equally spaced in time. Such distances might be therefore used for localization of the events or even for detection if more than one event occurred. The methodology is based on minimum entropy deconvolution (MED) and automatic peak finding. Simulated data analysis are performed in order to examine MED with different distances between events. Moreover, comprehensive simulated data analysis provide recommendations regarding MED filter size.
1. Introduction
The problem of multiple seismic events might be considered in several branches of seismology. For instance, blasting procedure yields in several consecutive seismic events which might be noticed as a sequence of amplitude excitations in seismic vibration recordings. Thus, such signals are common in seismic catalogues from mines where drill-and-blast method is practiced. Moreover, blasting is not only a mining excavation method – it is an active method of rockburst prevention [1]. Multiple seismic events are also related to underground explosions (e.g. chemical [2]). Closely spaced in time seismic events occur also in natural seismicity (doublets or multiplets). There are several methods that helps to separate and analyze two or more subsequent seismic events. In [3] the Authors analyze broadband seismic recordings related to blasting and earthquakes. Time-frequency representation provided a good discrimination between the consecutive events. Interference of seismic signals might be caused by several reasons, e.g. superposition of similar events, two or more waves travelled over transmission paths of different lengths, etc. [4]. Time distance between overlapping seismic events might be calculated upon e.g. autocorrelation function or cepstral analysis [2]. Another property that distinguishes seismic multiple events is wave speed – the same speed of two waves indicates multiple fracture events rather than two or more waves transmitted over paths of different lengths [5]. In this paper we investigate simulated seismic multiple-event signals with various time distances between the events. Minimum entropy deconvolution [6] is chosen as a method that indicates excitation force signals, thus an automatic peak detection is possible in order to estimate distances between the events. These distances are compared to the true distances used in simulation procedure.
The paper is structured as follows. In Section 2 a real example of multiple event seismic vibration signal is presented and a simulation procedure is described. Results regarding analysis of estimated distances are presented in Section 3. The last section contains conclusions.
2. Overlapping seismic events
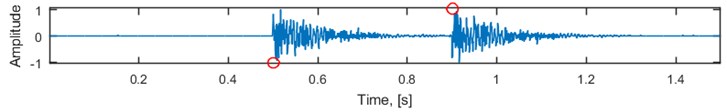
Multiple seismic events often occur in mining-induced seismicity. Vibration signals related to such events might be easily found in seismic data recorded by mine seismic stations. An exemplary vibration signal related to two blasts with delay of 500 ms (625 samples) is presented in Fig. 1 (left panel). Excitation signal recovered using the minimum entropy deconvolution is presented in Fig. 1 (right panel). Parameters of MED used here are as follows: 625-sample-long filter, 100 iterations, one-sample shift as the initial filter, kurtosis as the deconvolution criterion.
Fig. 1Two subsequent seismic events related to blasting. Delay between blasts equals 500 ms: a) original seismic vibration signal recorded by accelerometer and b) recovered excitation signal using minimum entropy deconvolution
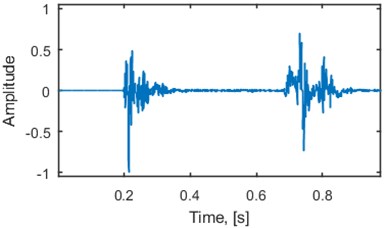
a)
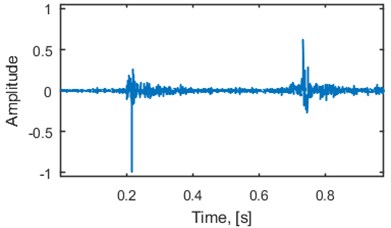
b)
One can notice that in this particular case the amplitude of the first signal has damped to the level of noise before the second event occurred. The deconvolved signal reveal two short-time excitations. Although, time intervals between two consecutive blasts different than 500 ms are also considered [7-9]. Thus, vibration signals related to each blast might overlap. In order to investigate separability of these signals a series of blasting experiments with different delays should be performed. Although, blasting is a critical procedure in terms of safety and efficiency in the mine, thus we decided to incorporate a model of a seismic signal known from the literature [10]. The model assumes that the seismic vibration signal is a response of a linear time-invariant system to an impulsive excitation. In order to make the resulting signal more consistent with the real seismic recordings an additive noise with relatively low amplitude might be added. The impulse response of the linear time-invariant (LTI) system we use in this study is an artificial impulse response.
As the excitation signal we use a Kronecker comb that consists of 2 spikes with the same amplitudes. In order to investigate separability of these impulses, we analyze a lot of excitation signals, each with different distance between impulses. The choice of appropriate excitation signal and impulse response of the system depends on particular application. One can specify amplitudes of the excitation signal, the number of spikes, their amplitudes and time lapse between them, damping ratio, frequency response and duration of the response etc. For instance, a model of vibration signal related to blasting in an underground mine should contain the number of spikes equal to the number of blasts. The number of impulses in the excitation signal from a locally damaged rotating machine (e.g. bearing) is related to characteristic frequencies (ball pass frequency of inner/outer ring, ball spin frequency, etc.) for a given rotational speed and specific damage type (inner/outer race, rolling element, etc.). The problem of overlapping system‘s responses to spikes occur in rotating machines, as well [11].
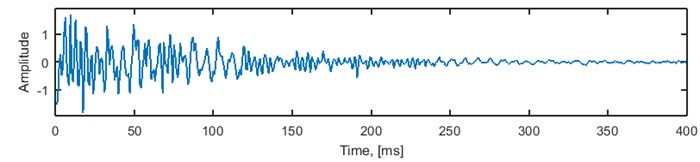
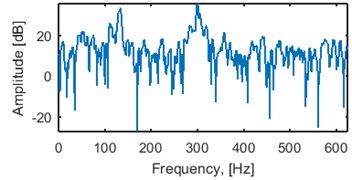
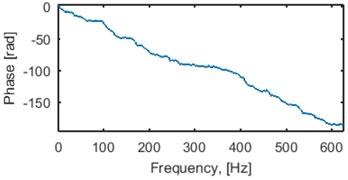
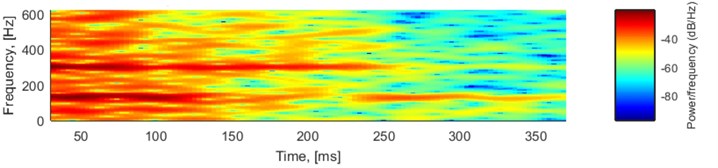
In this study the excitation signal is a sum of 2 spikes with amplitudes equal to 1 and an additive Gaussian noise with standard deviation equal to 0.001. Location of the first spike is 625 (samples) and the distance to the second spike varies from 50 to 500 samples. Duration of the signal is 1875 samples. The system has two main resonance frequency bands: 100-150 Hz and 290-310 Hz, amplitude of the impulse response decays exponentially with exponential delay constant equal to 10. The impulse, amplitude and phase (unwrapped) response of the LTI system and spectrogram of the impulse response is presented in Fig. 2. First 100, 200, 300 and 400 samples (80, 160, 240 and 320 ms) of the impulse response contain 81.44 %, 95.4 %, 99.11 % and 99.83 % of its entire energy, respectively.
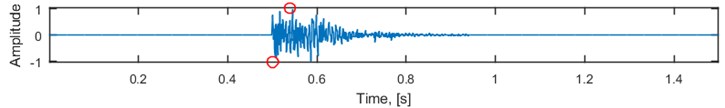
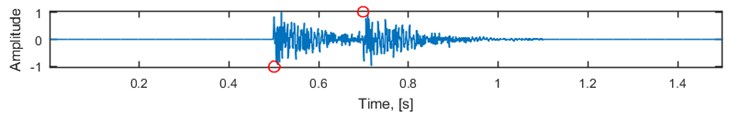
In Fig. 3 exemplary responses of the system to 3 different excitations is presented. Distance between impulses is set to 50, 250 and 500 samples (40, 200 and 400 ms). It can be noticed that if the distance between impulses is 250 or 500 samples then it is easy to indicate two rapid gains of amplitude (Fig 3(b), (c)). Distance between them can be easily estimated as well. On the other hand, the distance of 50 samples makes it impossible to notice two impulses.
Fig. 2LTI system used for seismic signal simulation: a) impulse response, b) amplitude response, c) phase response (unwrapped) and d) spectrogram of the impulse response (80-sample window, 95 % overlapping)
a)
b)
c)
d)
Fig. 3Exemplary responses of the system to different excitations. Red circles denote two peaks of each excitation signal with amplitudes –1 and 1, respectively.
a)
b)
c)
3. Recovery of time lapse between seismic events
In this section we investigate the problem related to estimation of the distance between two spikes in the excitation signal. Firstly, the excitation signal is estimated from the simulated system‘s response using minimum entropy deconvolution. Several different filter lengths are considered in this study. Then, in order to make the recognition of spikes automatic, the estimated signal is checked for presence of exactly 2 local extrema with amplitudes higher than 0.5 of the maximum amplitude of the signal. If the estimated excitation reveals additional, artificial impulses of significant amplitude (higher than half of the max amplitude), then the distance between impulses is not checked. In other words, we assume that if there are no exactly two local maxima with amplitudes higher than 0.5 of the maximum amplitude in the deconvolved signal, then it is impossible to recover the distance between impulses. This assumption makes the procedure robust to potential artificial impulses occurred after minimum entropy deconvolution. If the procedure yields exactly two local extrema in the estimated excitation signal then the distance between them is calculated and compared to the original distance. These analysis are performed for 10 different MED filter lengths – 50, 100, 150,..., 500 and for 451 different distances between excitation impulses, from 50 to 500 samples (40-400 ms). In Fig. 4 we illustrate differences between the estimated and real distances between excitation impulses for different MED filter sizes. Moreover, lack of the point on these plots indicates that the distance could not be calculated. It means that there were not exactly two local maxima with amplitudes higher than 0.5 of the maximum amplitude.
Fig. 4Differences between estimated and real distances between excitation impulses. Empty values stand for non-recognizable excitation impulses. Each panel corresponds to a different MED filter size. Black circle denotes the MED filter size
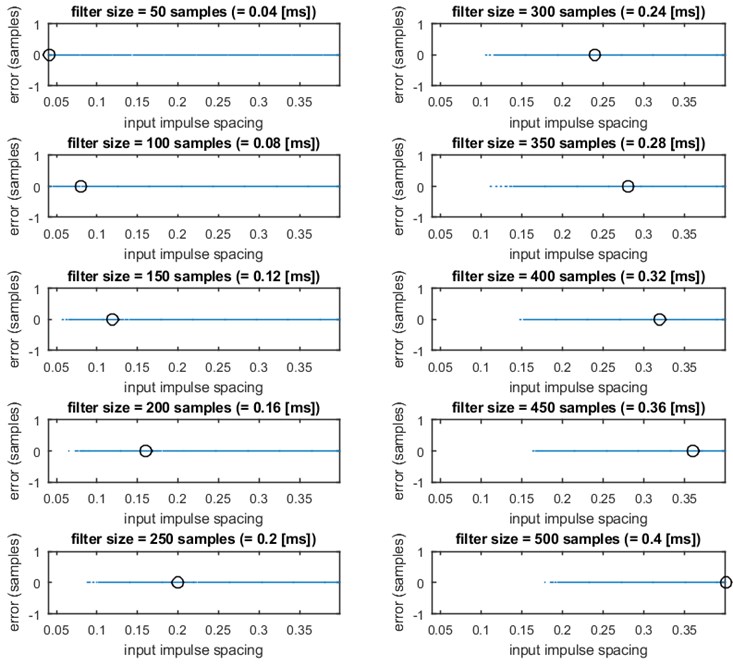
It can be noticed that the difference between real and estimated distance equals 0, if only the distance can be calculated. Such good result might be caused by a simple model of the excitation signal, which in this case is a Kronecker comb. Fig. 4 indicates the appropriate MED filter sizes for separation of two impacts. It can be noticed that even filters longer than the distance between the impulses might be beneficial in separation of two impulses. For instance, 400-sample-long (0.32 ms) MED filter separates the two impulses if only the time distance between them is larger than 0.15 ms. In general, the MED filter is able to separate to impulses from the noisy response signal if the distance between them is larger than approx. half of the filter size. Such result could be interpreted together with the fact that the MED does not reconstruct the Kroncekcer comb perfectly (Fig. 1).
4. Conclusions
In this paper an issue of overlapping vibration separation is analyzed. Such a case occurs in seismic signals, although overlapping of systems’ responses to consecutive impulsive excitations might occur in other fields, e.g. in rotating machinery diagnostics. Minimum entropy deconvolution has been proved as a method that recovers an approximation of the impulsive excitation from the system‘s response. The time lapse between impulses has been estimated correctly, although it is not always easy to indicate automatically exactly as much impulses as the initial number was. It has been noticed that the MED filter could separate impulses distant from each other half the MED filter size or more. This indicates a “compression” property of the estimated MED filter. In practice, the time distance between impulses is not known, in general. Although a rough approximation is enough to define the MED filter size and recover the exact time distance by incorporating deconvolution. Future work might be related to excitations other than the Kronecker comb, different amplitudes of each impulse, system‘s response different for each excitation etc.
References
-
Butra J., Kudelko J. Rockburst hazard evaluation and prevention methods in Polish copper mines. Cuprum, Vol. 61, Issue 4, 2011, p. 5-20.
-
Flinn E. A., Cohen T. J., Mccowan D. W. Detection and analysis of multiple seismic events. Bulletin of the Seismological Society of America, Vol. 63, Issue 6, 1973, p. 1921-1936.
-
Beck S. L., Wallace T. C. Broadband seismic recordings of mining explosions and earthquakes in South America. Proceedings of 17th Seismic Research Symposium on Monitoring a CTBT, Phillips Laboratory, Hanscom Air Force Base, 1995, p. 157-163.
-
Pilant W. L., Knopoff L. Observations of multiple seismic events. Bulletin of the Seismological Society of America, Vol. 54, Issue 1, 1964, p. 19-39.
-
Young R. P. Rockbursts and Seismicity in Mines. Proceedings of the 3rd international symposium, Kingston, Ontario, 1993, p. 462.
-
Wiggins R. Minimum entropy deconvolution. Geoexploration, Vol. 16, Issues 1-2, 1978, p. 21-35.
-
Shia X. Z., Chen S. H. R. Delay time optimization in blasting operations for mitigating the vibration-effects on final pit walls’ stability. Soil Dynamics and Earthquake Engineering, Vol. 31, Issue 8, 2011, p. 1154-1158.
-
Wang Zhenyu, Fang Cheng, Chen Yinlu, Cheng Weifeng A comparative study of delay time identification by vibration energy analysis in millisecond blasting. International Journal of Rock Mechanics and Mining Sciences, Vol. 60, 2013, p. 389-400.
-
Yi C., Johansson D., Nyberg U., Sjöberg J. Numerical simulation for the influence of delay time on the rock fragmentation. Rock Fragmentation by Blasting, FRAGBLAST 10 – Proceedings of the 10th International Symposium on Rock Fragmentation by Blasting, 2013, p. 213-220.
-
Antunes J., Paulino M., Izquierdo P. Blind identification of impact forces from multiple remote vibratory measurements. International Journal of Nonlinear Sciences and Numerical Simulation, Vol. 2, Issue 1, 2011, p. 1-20.
-
Antoni J. The infogram: entropic evidence of the signature of repetitive transients. Mechanical Systems and Signal Processing, Article in Press, 2015.
About this article
