Abstract
The demand on wind energy application will continue to increase as fossil fuel prices keep increasing and the reservoir keeps decreasing. In wind energy, wind turbine application should be properly selected. The material selection for turbine blade fabrication is highlighted as well in recent research. For green material application, the usage of natural fiber reinforced composite, especially kenaf fiber, in the fabrication of wind turbines needs to be given due attention. Woven and unwoven kenaf fiber is employed to fabricate composite plates which replicate the simple turbine blade model. At the same time, Macro Fiber Composite (MFC) is attached to the kenaf plates for micro energy harvester purposes. There are two methods to attach the MFC used in this study which are surface bonded and embedding into the plate. In order to investigate the effects of bonding MFC technique, modal Testing analysis and Taguchi method is employed. It is found out that the damping percentage of both woven and unwoven kenaf plates increase at 100 % and 50 % respectively when bonded with MFC on their surfaces. Bonded technique is suggested as the most influenced factor in micro energy harvesting at the vibration range of 20 to 60 Hz. It summarized that, the kenaf woven type, the distance from structure neutral axis, the stiffness of structure, the excitation vibration and the neutral frequency of a structure are highlighted as the factors influencing the performance of micro energy harvester as well.
1. Introduction
Globally, wind energy has a big potential in terms of renewable energy. It can supply more than double the current world electricity consumption, which is about 15,000×109 kWh per year. The supply can achieve from 20,000×109-50,000×109 kWh per year [1, 2]. This depends on several factors such as the average wind speed, the statistical wind speed distribution, turbulence intensities and the cost of wind turbine systems. Besides this, there are more than 50 countries and 1500 organisations contributing hardware manufacturing, project development, power generation, finance and consultancy. This huge number expedites the enhancements and advancements of wind energy technology.
The study on wind resource density has already been conducted by several researchers in Malaysia. A ten years study from 1982 to 1991 at 10 different areas in Malaysia suggested that Mersing and Kuala Terengganu have a wind power potential with a mean power density of 85.61 W/m2 and 32.50 W/m2 respectively [3, 4]. Moreover, the annual offshore wind speed in Malaysia is around 1.2-4.1m/s with the east coast of Peninsular Malaysia recording the highest in annual vector resultant wind speed of 4.1 m/s [5]. The stability of wind speed in peninsular Malaysia is known to be quite good [6]. This shows that the application of wind energy harvesters is relevant especially at places with sufficient wind resources. Furthermore, the rural areas of east Malaysia have already utilized hybrid solar and wind energy generators [4]. However, the usage of diesel generator is still dominant.
The application of vertical axis wind turbine (VAWT) in wind energy generator has created advantages in several aspects such as free wind direction oriented, the ability to be towerless and huge power density per square meter [4]. However, material of turbine blades has raised concern. The application of synthetic fibers like glass fiber and carbon fiber in turbine blades have promoted several disadvantages such as risk of inhalation during the fabrication process, renewability, biodegradability and recyclability issues. The usage of biocomposite fiber to replace synthetic fiber as a reinforcement in Fiber-Reinforced Plastics (FRP) is beginning to widespread [7]. Investigation in biocomposites have led to several types of natural fibers such as flax [8, 9], bamboo [10], pineapple [11], jute [12, 13] and kenaf [13-16]. The mechanical properties in natural fiber may differ due to several factors such as fiber morphology, structure density, cell wall thickness, woven or woven [17], length and diameter of the structure [18]. Kenaf fiber is one of the natural fiber which is extensively researched and has given significant findings for future benefits [17-21].
Besides that, the application of Structural Health Monitoring (SHM) system in turbine blade is becoming very important. In order to employ SHM system, the dynamics characterization of mechanical system on turbine blade should be determined as well. Modal analysis is common way of testing conducted to study the natural frequency, mode shapes and damping percentage of a structure [22]. One of the SHM sensor devices is Macro Fiber Composite (MFC). It can respond as a sensor and micro energy harvester as well. The flexibility features make it very suitable to bond on the big and vibrating structures and also its high electromechanical coupling coefficient [23]. Besides, it solves several issues highlighted in monolithic piezoelectric transducers such as mechanical stability of the piezoelectric transducer under huge stress, brittleness [24]. MFC type d31 is proposed as it produces a large strain and more energy for small applied forces [25]. Moreover, MFC can produce electrical power up to 65 % of input mechanical energy, better performance due to its thin layer and classified as bimorph structure which generates double output as compare to unimorph structure [25]. The flexibility features make it very suitable to bond on the big and vibrating structure.
The micro energy harvester reacts from the vibrations occurring in structure body. This concept is applied in several researches and innovations technology [26-28] and shown promising results. MFC is very flexible and the properties have improved in terms of mechanical stability and brittleness [28].
The factors influencing the amount of harvested energy are piezoelectric material, proof mass, gap of interdigitated electrodes, overlapping effect of resonance frequencies, and operating mode of piezoelectric conversion [29, 30]. Theoretically, this effect can be further described via the equivalent linear spring mass system (Fig. 1) and equation 1, 2 and 3.
Fig. 1Cantilever beam with tip mass [29]
![Cantilever beam with tip mass [29]](https://static-01.extrica.com/articles/16377/16377-img1.jpg)
where is the net displacement of mass, is the lumped mass, is the spring constant, is the damping coefficient and is natural frequency [29]. The power generated from piezoelectric is correlated to natural frequency or resonance. The power output model at resonance can be written as:
where m is the seismic mass, is the amplitude vibration, is the system resonance frequency and is the relative damping ratio [29]. Therefore, the natural frequency of the beam or part should be identified. Hence, maximum power output can be gained and the range of natural frequency of the structure.
Most of the findings show that the MFC is bonded on the surface of the structure only [23, 31, 32]. Hence, the combination of MFC in turbine blades could give new insights especially the effect of bonded MFC on the turbine blades. Thus, the objective of this research is to investigate the bonded MFC effect technique on woven and unwoven kenaf plates via modal impact testing for micro energy harvested of VAWT application.
2. Experimental setup
2.1. Plate fabrication
Kenaf short fibre and fibre kenaf yarns were utilised in this research. They were both supplied by Juteko Co. Ltd., Bangladesh. The yarn fineness value was recorded as 300 Tex. Tex is a textile unit used to define and measure yarn and is equal to grams per kilometer. The matrix used was EpoxAmite 100 (Smooth-on) and cured with 102 Medium hardener (Smooth-on).
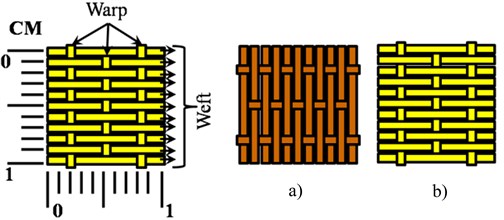
Kenaf yarn was woven manually using a self-designed handloom. The weft and warp setup for woven kenaf was 11 ends per centimeter or 28 epi (ends per inch) and 3 picks per centimeter or 8 ppi (picks per inch) respectively as shown in Fig. 2 and Fig. 3.
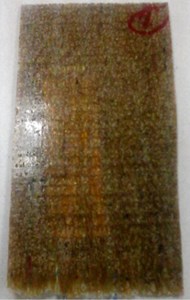
Fig. 2Completed woven kenaf
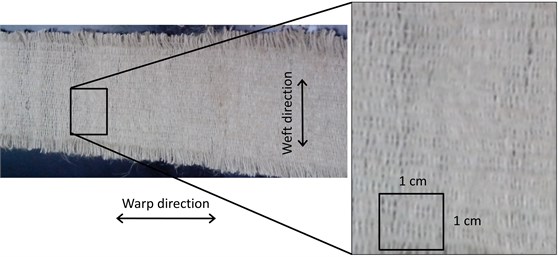
Fig. 3Schematic of kenaf weave orientation a) orientation A, b) orientation B
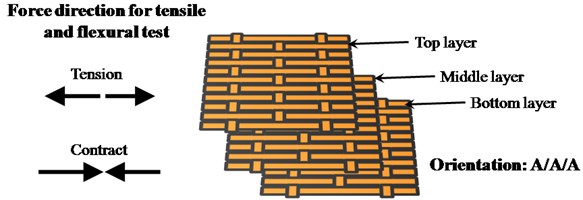
The orientation AAA was utilised for the woven kenaf plate fabrication as shown in Fig. 4. Three layers of woven kenaf with dimensions of 200 mm×250 mm were stacked at an average weight of 70 g. For the unwoven kenaf, 70 g of kenaf short fibre was setup on the fabrication mould. For the embedded MFC, this was laid at the specific layer and dimension of kenaf as shown in Fig. 5. Bonded MFC was attached onto the surface after curing, assuming that the bond is effectively adhered so that the stress is effectively transferred between the two surfaces of the kenaf plate.
Fig. 4Orientation A/A/A
After curing, the plate was cut into specific dimension as shown in Fig. 6 and Fig. 7. Four plates were fabricated following the sample type stated in Fig. 7. A reference plate was fabricated from woven kenaf as well via the vacuum infusion technique. The same plates were employed for the vibration test after the modal testing was conducted.
Fig. 5Schematic of MFC location and thickness of the kenaf layer, a) schematic of the kenaf layer and MFC for woven kenaf plate, b) thickness of the kenaf layer for woven kenaf plate, c) thickness of the kenaf layer for unwoven kenaf plate.
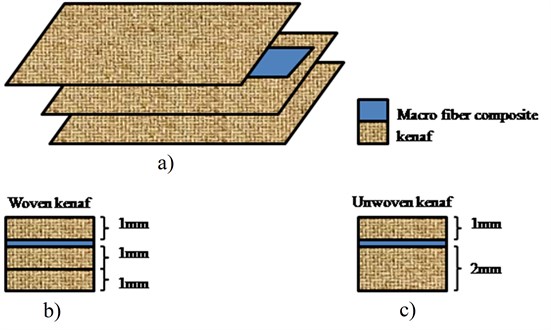
Fig. 6Dimensions of kenaf plates for modal testing
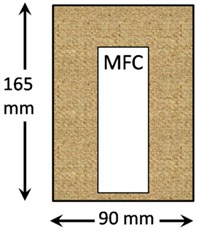
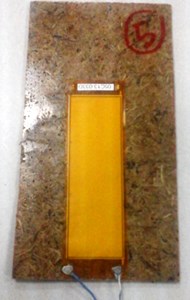
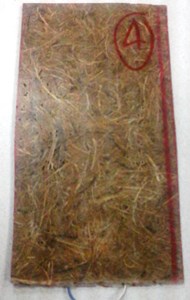
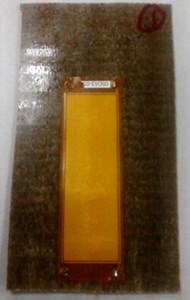
Fig. 7Sample for modal testing (a) MFC bonded onto unwoven kenaf, (b) embedded MFC in unwoven kenaf, (c) MFC bonded onto woven kenaf, (d) MFC embedded in woven kenaf
a)
b)
c)
d)
Table 1Sample characteristics for modal testing analysis
Sample | Parameter | |
Bonding type of MFC patch | Woven type of kenaf | |
1 – Embedded woven plate | Embedded inside the kenaf Plate | Woven kenaf |
2 – Embedded unwoven | Embedded inside the kenaf Plate | Unwoven kenaf |
3 – Bonded woven plate | Bonded on the kenaf Plate surface | Woven kenaf |
4 – Bonded unwoven plate | Bonded on the kenaf Plate surface | Unwoven kenaf |
5 – Woven plate | – | Woven kenaf |
2.2. Modal testing
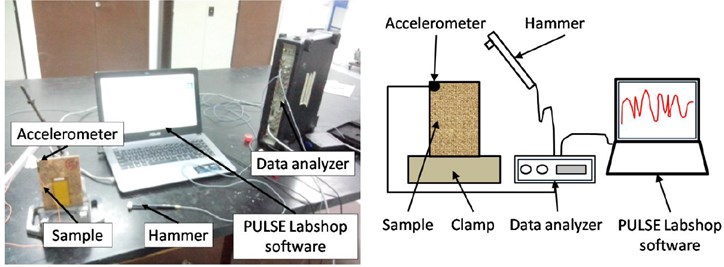
The electricity induced by the MFC was influenced by the deformation in the plate structure. Theoretically, the high peak voltage output induced during the resonance of the structure is due to maximum deformation [33]. Modal testing analysis is employed to assess the natural frequency or resonance of any structure. In this experiment, a simple modal testing approach was utilised known as single reference testing. A hammer impact technique is a common application for single reference testing and has been selected due to this being the easiest method. The impact hammer modal analysis excitation method was utilised to analyse the natural frequency of each plate and the effect of the MFC bonded technique on the plate structure. Pabut et al.’s [34] modal testing methodology is referred to in this experiment. The sample characteristics and experimental setup are shown in Fig. 8 and Table 1 respectively.
Fig. 8Experimental setup for impact hammer excitation in modal testing
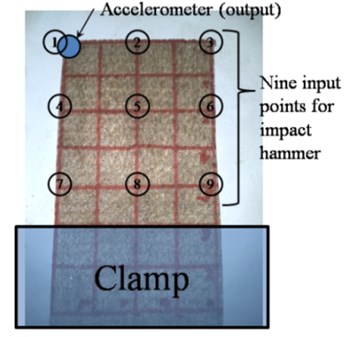
The samples were rigidly positioned and clamped. Nine static points were identified based on grid point selection for hammer excitation as shown in Fig. 9. The grid was setup in equal distance to obtain clear mode shape illustration. Fig. 9 shows that the accelerometer (B&K4517) was mounted on the corner of the plate assuming the maximum deformed locations on the plate.
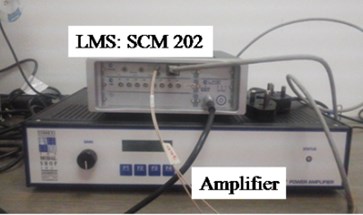
The hardware devices required in this modal testing are: Fast Fourier Transform (FFT) analyser (Model Brüel&Kjær, Denmark – B&K 3560 C) to compute the Frequency Response Functions (FRF). Laptop (for PULSE Labshop software and ME’ScopeVES software) to identifying the modal parameter and mode shapes animation. Accelerometer (B&K4517) to capture and measure the response acceleration at a fixed point and direction. Operates as an output reference. A B&K 8204 modal impact hammer was used as an exciter input force on the structure which is equipped with a load cell to record the load induced in the structure.
Fig. 9Location of accelerometer, clamped area and nine points for hammer excitation
An impact hammer was exerted on each point five times to obtain satisfactory, accurate data and to minimise errors. An FFT analyser was equipped with a spectrum averaging capability to accept or reject the hit from the hammer due to human error. The error indicator is denoted by coherence graph information. The best results are recorded if the coherence line shows a smooth line without distortion. The response data was acquired using the Brüel&Kjær PULSE multi analyser platform (only the 2-Channel FFT analyser was used in this impact hammer analysis) which also provides FFT based validation tools and computes frequency response functions (FRF).
The PULSE Labshop software takes the raw time data and, based upon this, estimates the natural frequencies, the mode shapes and the damping percentage via ME’ScopeVES post-processing software. The software is setup to capture the frequency range from 0 to 800 Hz. Further analysis was only focused on an audible frequency range, typically 30-400 Hz due to potential noise problems occurring in the wind turbine blades [35].
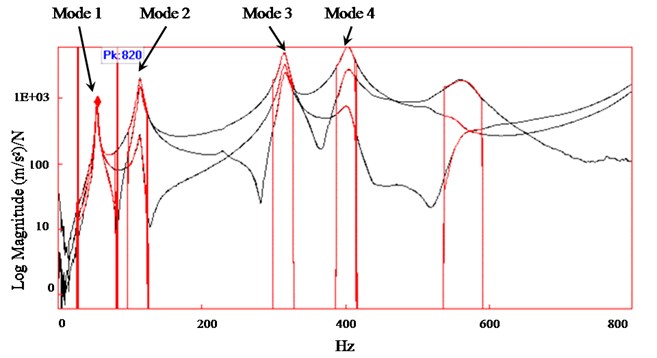
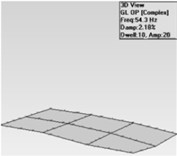
The results displayed in the FRF as a sample are shown in Fig. 10, and were analyzed via the Curve fitting method in PULSE Labshop software and ME’ScopeVES post-processing software. Curve fitting is a matching process which occurs between the mathematical expression and the empirical data points. This is conducted by minimising the squared error between the analytical function and the experimental data. FRF depicts the input-output relationship between two points as a function of frequency. In this analysis, the log magnitude was recorded from the accelerometer data divided by the force exerted by the hammer output (m/s2)/input (N) as a function of frequency. Each peak from the graph represents the mode or natural frequency of the structure. Fig. 10 shows the estimated range of each mode. The respective mode range is highlighted in vertical red line. The deformation shape was different at various natural frequencies and this is evaluated in mode shape analysis. The report outline from modal testing is very useful for analysing the correlation of the MFC bonding technique in the kenaf plate and the natural frequency of the plate.
Fig. 10Example of frequency response functions (FRF) and natural frequency identification
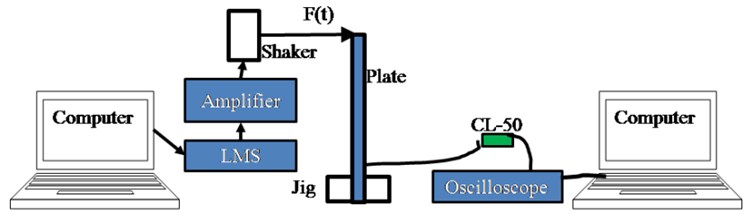
2.3. Plate vibration test
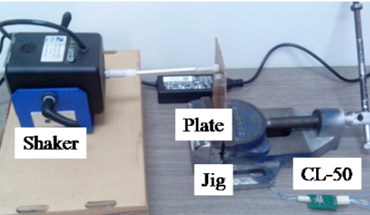
A vibration test was conducted to analyse the performance of the MFC energy harvester at the respective range of frequencies for wind turbine application. The prepared plates were clamped to the jig at one end and were left free at the other hand as shown in Fig. 11. The tip of the shaker was applied to the free end of the plate to simulate the vibration at the respective range of frequencies. The details of the equipment employed in this experiment are summarised in Table 2.
Table 2Equipment for vibration testing
Shaker | Amplifier | Vibration controller | Oscilloscope |
Modal shop: model: 2007E | Modal shop: 2100E21-100 | Hardware: LMS: SCM 202 Software: LMS | Picoscope 3206B |
To vibrate the plate | To amplify the signal from the controller to shake at 3 W power | To control the frequency of the shaker | To record the voltage induced from MFC |
The vibration test setup follows the concept developed by Sodano and Ali [25, 28, 36]. The amplifier was set at 3 W. The range of frequencies in this experiment was selected to be 20 Hz to 100 Hz referring to mode one of the natural frequency and 120 Hz to 200 Hz for mode two of the natural frequency of the plates. This range was proposed to ensure that it occurred at least at 5 Hz before and after the natural frequency following the Tien and Goo technique [33]. The natural frequency values were obtained from the modal testing experiment. The voltage generated, as induced from the MFC, was transmitted to a smart power harvesting module (EH-CL50 from smart-material) before connection to the oscilloscope for voltage recording. EH-CL50 was specially developed for P2 type MFC in low frequency/intermittent harvesting applications. Hence, no additional harvesting circuit was needed to harvest the induced voltage. The operation is based on capacitive energy extraction.
Table 3Summary of experimental parameters for vibration testing analysis and micro energy harvesting testing on the prototype of the wind turbine
Factor | Experimental Condition Levels | |
1 | 2 | |
A – Bonding type of MFC patch | Embedded inside the kenaf plate | Bonded on the kenaf plate surface |
B – Woven type of kenaf | Woven | Unwoven |
C – Input frequency (Hz) | 20, 40 and 60 (first mode) 80, 100, 120, 140 (second mode) | |
Fig. 11Experimental setup for the vibration test, a) schematic drawing, b) amplifier and LMS shaker controller and c) shaker and clamped plate.
a)
b)
c)
The experimental setup between the plate and the shaker is shown in Fig. 11. The shaker frequency and amplitude were controlled by a frequency controller and an amplifier respectively. The shaker frequency was set at 20, 40 and 60 Hz for first mode analysis, and 80, 100, 120 and 140 Hz for second mode analysis. Four different plates were tested. The experimental parameters are summarised in Table 3. The voltage RMS generated was recorded via an oscilloscope (PICOSCOPE) and saved on the computer.
2.4. Statistical analysis via Taguchi method
The Taguchi methods are statistical methods initially developed by Genichi Taguchi to improve the quality of manufactured goods. More recently, the techniques have been used in scientific and engineering experiments since they allow for the analysis of many different parameters without a prohibitively high number of experiments. Many researchers now apply robust design as a tool to achieve quality engineering in many fields.
Furthermore, Taguchi offers an experimental design wholly based on statistical design as a tool which is less sensitive to noise factors. The two major tools used are: the signal to noise (S/N) ratio, which measures quality with the emphasis on variation, and orthogonal arrays, which accommodate many design factors simultaneously. The significance of the factor or multiple factors that affect the machining quality performance could be determined in a very short time when this technique is employed.
The method of calculating the S/N ratio response is designed in three different modes depending on whether the quality characteristics is smaller the better, larger the better or nominal the better [37]. In this analysis, the larger the better is preferred to perform high energy. The equations for calculating the S/N ratio are for the larger the better characteristic (in dB) which is . is the number of observations and is the observed data. The S/N ratio values function as a performance measurement to develop processes insensitive to noise factors.
The degree of predictable performance of a product or process in the presence of noise factors could be defined from the S/N ratio values. For each type of characteristics, with the above S/N ratio, the higher the S/N ratio, the better the result. The S/N ratio was presented in response graph and response table.
The Taguchi design of plate vibration experiment was divided into two. For the first mode, the analysis design was L36 orthogonal array. The two factors with two levels and one factor with three levels as shown in Table 5. Meanwhile, for the second mode was L18 with three factors. The two factors with two levels and one factor with four levels as shown in Table 7. Voltage RMS was considered as output result.
3. Result and discussion
3.1. Modal testing
Natural frequencies for different bonded and woven MFC types are shown in Table 4. The plates may optimally deform and deflect during resonance. Hence this can influence the performance of the energy harvesting generated from the MFC. The analysis of the natural frequency in kenaf plates is focused on the range 0 Hz to 400 Hz as indicated in Chapter three, following the methodology of Jenq et al. [35] for wind turbine blades. The reference plate, embedded unwoven plate and embedded woven plate have recorded a single natural frequency at the suggested bandwidth ranges. Mode four for the embedded woven plate is 404 Hz and for the embedded unwoven plate it is 615 Hz. While bonded unwoven and bonded woven plates generate two resonance frequencies in the range 0 Hz to 400 Hz. Generally, the bonded MFC patch reduces the natural frequency of the plate as compared to the reference plate for each mode.
Table 4Natural frequencies of various kenaf plates for the first four modes
Mode | Embedded woven plate (Hz) | Embedded unwoven (Hz) | bonded unwoven (Hz) | Bonded woven plate (Hz) | Reference (Hz) |
1 | 54.3 | 42.5 | 40.3 | 29 | 56.8 |
2 | 114 | 139 | 125 | 92 | 127 |
3 | 316 | 266 | 225 | 168 | 369 |
4 | 404 | 651 | 388 | 310 | 473 |
Theoretically, the main factors influencing the natural frequency of a structure are determined by the mass, the stiffness damping properties and the boundary condition of the structure. Any changes in these factors may change the natural frequency of the structure and the mode shapes as well.
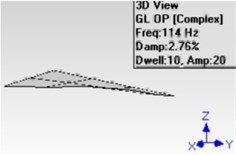
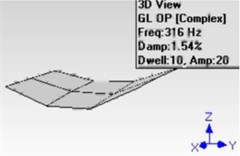
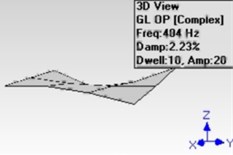
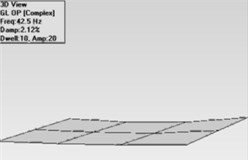
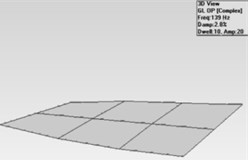
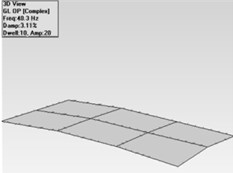
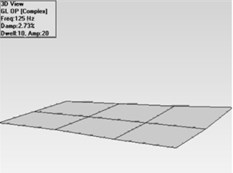
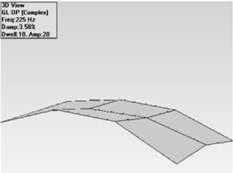
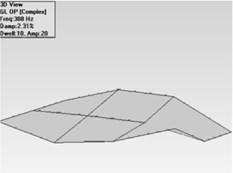
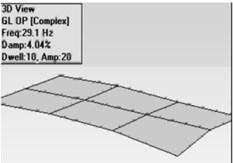
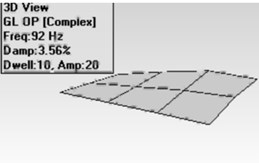
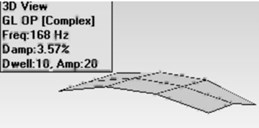
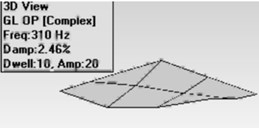
An analysis of the mode shapes for embedded woven plate, embedded unwoven plate, bonded unwoven plate and bonded woven plate is shown in Fig. 12-15 respectively. In the embedded woven plate (Fig. 12), the first mode is deflected by the bending effect, the second mode is deflected by torsion, the third mode is deflected by bending at a different axis and the fourth mode is a combination of both bending and torsion.
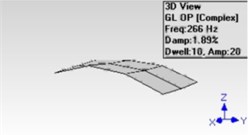
The deflection shapes for embedded unwoven plate (Fig. 13) are defined as bending, torsion, bending at a different axis and a combination of torsion and bending for the first, second, third and fourth modes respectively.
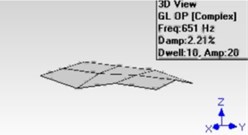
In addition, the mode shapes for the bonded unwoven plate are shown in Fig. 14. The first mode is deflected by bending, the second mode is by torsion, the third mode is by bending and the fourth mode is a combination of torsion and bending. For the bonded woven plate (Fig. 15), the deformation shape for each mode occurred at the same condition as the bonded unwoven plate.
This analysis shows the type of deformation that occurred in the kenaf flat plates. The deformation is influenced by the weight and the plate stiffness. The types of deformations are different at different ranges of vibration frequency. This information may guide researchers to understand the structural deformation pattern at specific ranges of vibration. It also gives ideas about suitable locations for the sensor. Hence, the SHM system and the energy harvesting system can be properly employed and utilised in their best conditions.
Fig. 12Mode shapes for the embedded woven plate a) first mode, b) second mode, c) third mode, d) fourth mode
a)
b)
c)
d)
Fig. 13Mode shapes for embedded unwoven plate a) first mode, b) second mode, c) third mode, d) fourth mode
a)
b)
c)
d)
Fig. 14Mode shapes for bonded unwoven plate a) first mode, b) second mode, c) third mode, d) fourth mode
a)
b)
c)
d)
Fig. 15Mode shapes for bonded woven plate a) first mode, b) second mode, c) third mode, d) fourth mode
a)
b)
c)
d)
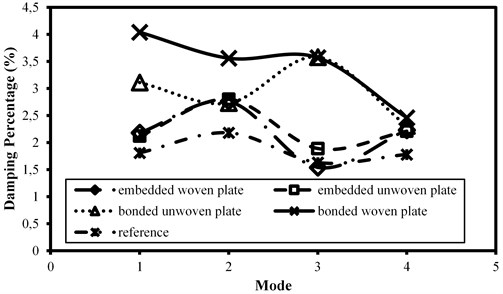
An analysis of the damping percentage has also been conducted. Fig. 16 shows the damping percentage for each of the kenaf plates. The values are considered to be small and do not exceed 4 %. The trend and damping values are almost the same for the embedded woven plates and the embedded unwoven plates. Besides this, the trends for the bonded unwoven plate and the bonded woven plate are almost the same. However, at mode one and two, the difference is about 1 %. The deflection type and the bonded MFC type may contribute to the value and trend of the damping percentage. The reference plate shows the lowest value for the damping percentage, and the trend is the same for the embedded MFC plates for both woven and unwoven kenaf fibre.
Fig. 16Damping percentage for kenaf plates at each mode
Modal testing shows three reports which are: the natural frequency of the kenaf plate, the mode shapes and the damping percentage. The results indicate that for particular kenaf woven and unwoven plates, bonded MFC influenced the damping percentage significantly. The deformation types show a similar condition for the first mode to the fourth mode. The deformations are: bending for the first mode, the second mode is torsion, the third mode is by bending and the fourth mode is a combination of torsion and bending.
3.2. Plate vibration test
3.2.1. First mode analysis
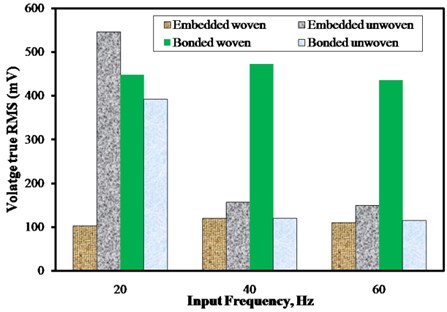
For first mode analysis, the result is presented in Fig. 17. Fig. 17 displays the average value of the voltage RMS in each frequency. All results exhibit a voltage range between 100 mV to 600 mV. Embedded woven plates show the lowest results, which are 103.6 mV, 120.3 mV and 110.9 mV for 20 Hz, 40 Hz and 60 Hz respectively. For the embedded unwoven plates, the results are 546.9 mV, 157.7 mV and 149 mV for 20 Hz, 40 Hz and 60 Hz respectively. The bonded woven results are 448.1 mV, 472.7 mV and 436.7 mV for 20 Hz, 40 Hz and 60 Hz respectively. Meanwhile for bonded unwoven plates, the results are 392.2 mV, 119.9 mV and 115.3 mV for 20 Hz, 40 Hz and 60 Hz respectively.
Fig. 17Voltage RMS result from vibration plates in first mode analysis
3.2.2. Statistical analysis for the first mode
S/N ratio vibration analysis for the first mode is reported in Fig. 18 and Table 6. Table 5 shows the experimental parameters as a reference. Further analysis was conducted using the response table of the S/N ratio and the response graph of the S/N ratio to identify the most influential factor and the optimum level in each factor to obtain a higher voltage response.
Table 5The experimental parameters for first mode plate vibration testing analysis
Factor | Experimental condition levels | ||
1 | 2 | 3 | |
A – Bonding type of MFC patch | Embedded inside the kenaf plate | Bonded on the kenaf plate surface | 0 |
B – Woven type of kenaf | Woven | Unwoven | 0 |
C – Input frequency, Hz | 20 | 40 | 60 |
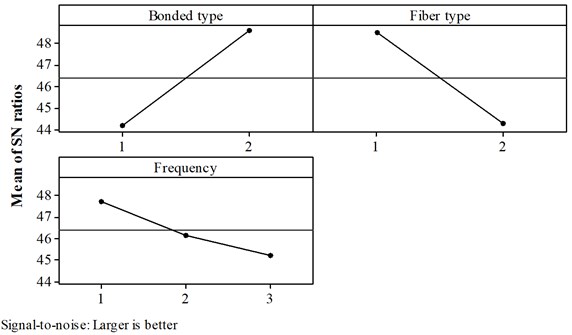
Table 6 shows that the bonded type is proposed as the most influential factor, followed by fibre type and frequency. This result refers to the delta item. Delta is the difference between the minimum and maximum S/N ratio for each of the factors. The higher value means that it is considered as the most influential factor above the others. Rank refers to the order of the influencing factor in each analysis. Number one is considered as the most influential factor followed by number two and so on.
Table 6Response table for S/N ratio in first mode analysis
Level | Factors | ||
Bonding type | Fibre type | Frequency | |
1 | 44.17 | 48.53 | 47.75 |
2 | 48.6 | 44.24 | 46.18 |
3 | 45.23 | ||
Delta | 4.42 | 4.3 | 2.52 |
Rank | 1 | 2 | 3 |
The optimum level is identified from the highest S/N ratio value in each factor. For the bonding type factor, level 2 (which is bonded MFC) is proposed as the optimum level. While for fibre type, level 1 (which is the woven type) is proposed as the optimum level. Lastly, the optimum frequency is suggested at level 1 which is 20 Hz. Fig. 18 depicts that the optimum parameters necessary to achieve a higher voltage RMS is a combination of bonded MFC and woven kenaf fibre and this operates close to natural frequency.
Fig. 18Response graph for S/N ratio in first mode analysis
3.2.3. Second mode analysis
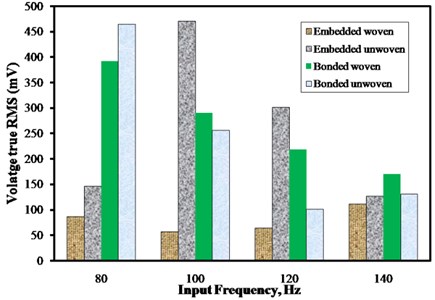
Fig. 19 represents the average result of the voltage RMS recorded in the second mode experiment. All results exhibit a voltage range between 50 mV to 500 mV. The range is almost the same as that for first mode analysis. Generally, the embedded woven plate illustrates the lowest value, similar to first mode analysis, and displays almost constant results. Bonded woven and bonded unwoven plates demonstrate a decreasing trend with the increase of frequency. However, voltage RMS in embedded unwoven plates increased as the frequency increased from 80 Hz to 100 Hz and then decreased with the frequency increment.
The average results for the embedded woven plate are 87.4 mV, 57.1 mV, 64.6 mV and 112.3 mV for 80 Hz, 100 Hz, 120 Hz and 140 Hz respectively. For the embedded unwoven plate, the average results are 147.2 mV, 471.2 mV, 301.8 mV and 127.7 mV for 80 Hz, 100 Hz, 120 Hz and 140 Hz respectively. The bonded woven average results are 391.9 mV, 291 mV, 218.8 mV and 170.9 mV for 80 Hz, 100 Hz, 120 Hz and 140 Hz respectively. Meanwhile for bonded unwoven plates, the average results are 465.2 mV, 257 mV, 101.3 mV and 131.7 mV for 80 Hz, 100 Hz, 120 Hz and 140 Hz respectively.
Fig. 19Voltage RMS results from the vibration plate in second mode analysis
3.2.4. Statistical analysis for the second mode
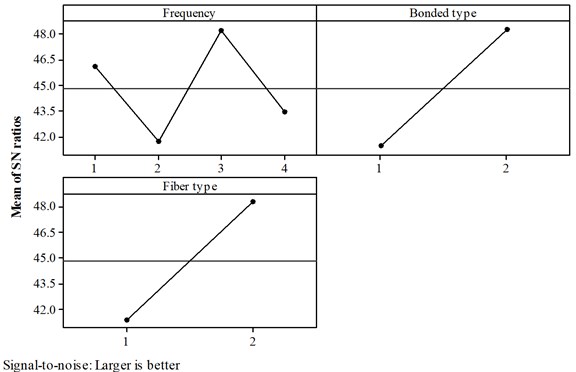
Table 7 shows the experimental parameters as a reference. Table 8 and Fig. 20 exhibit the response table and response graph of the S/N ratio for second mode analysis respectively. Following the analysis method established in the first mode, the fibre type is proposed as the most influential factor, followed by the bonding type and the frequency as shown in Table 8. Meanwhile, Fig. 20 reports that the optimum parameters to achieve a higher voltage RMS is a combination of bonded MFC and unwoven kenaf fibre. The analysis suggested 120 Hz as the optimum frequency compared to the others. The natural frequency for bonded MFC on unwoven kenaf fibre from the modal testing is 125 Hz.
Table 7The experimental parameters for second mode plate vibration testing analysis
Factor | Experimental condition levels | |||
1 | 2 | 3 | 4 | |
A – Bonding type of MFC patch | Embedded inside the kenaf plate | Bonded on the kenaf plate surface | 0 | 0 |
B – Woven type of kenaf | Woven | Unwoven | 0 | 0 |
C – Input frequency, Hz | 80 | 100 | 120 | 140 |
Table 8Response table for S/N ratio in second mode analysis
Level | Factors | ||
Bonding type | Fibre type | Frequency | |
1 | 46.11 | 41.41 | 41.35 |
2 | 41.65 | 48.26 | 48.32 |
3 | 48.18 | ||
4 | 43.4 | ||
Delta | 6.53 | 6.85 | 6.96 |
Rank | 3 | 2 | 1 |
Fig. 20Response graph for S/N ratio in second mode analysis
3.2.5. Discussion of the plate vibration test
The correlation among the factors influencing the micro energy harvester is discussed in this section. First mode and second mode analysis have proposed different optimum parameters. In the first mode, the optimum parameter is a combination of bonded MFC and woven kenaf fibre and operates close to natural frequency. In the second mode, the optimum parameter to achieve a higher voltage RMS is a combination of bonded MFC, unwoven kenaf fibre and operates close to natural frequency. This shows that two different kenaf plates are proposed at different vibration range. The experiments show that the maximum voltage RMS occurred near to the natural frequency of the kenaf plate for the first and second mode.
Hence, the performance of the micro energy harvester for the kenaf plates is influenced by several factors including the fabrication technique, the weight of kenaf plate, the bonding MFC technique, the fibre type, the stiffness, and the excitation vibration. The bonded MFC technique may influence the damping percentage of the structure as reported in modal testing experiments. In addition, the fibre type (whether woven or unwoven) can affect the mechanical properties of the kenaf plate, hence affecting the stiffness of the structure.
Furthermore, the natural frequency of the kenaf plates presents a significant influence on the micro energy harvester performance. Excitation vibration that is near to the natural frequency causes the structures to deform at the maximum condition. Hence, a frequency which is close to the natural frequency is proposed for both the first mode and second mode conditions. These results are consistent with the results by Kahrobiyan [30] who mentioned the resonant effect. In addition, it is important to know the natural frequency of a structure to determine the specification of the structure. The deformation of structure is directly proportional with the micro energy harvester performance.
This study provides extensive information for the production of turbine blade as highlighted in the introduction of this paper. It is very important to identify the natural frequency of the turbine blade in advance. In addition, information concerning the factors that influenced the performance of micro energy harvester must be considered in stages of design and fabrication process. Biocomposite turbine blade fabrication is feasible and MFC is perfectly suitable for applications in turbine blade technology as micro energy harvester and structural health monitoring as well.
4. Conclusions
The modal testing is conducted on five kenaf plates. All plates demonstrated the same condition of deflection. The deflections occurred were bending, torsion, bending at different axis and combination of bending and torsion for the first mode, second mode, third mode and fourth modes respectively. The damping effect studied from analyses show that the bonded MFC type and deflection type may influence the damping percentage and trend for each plate. It shows that the damping percentage of both woven and unwoven kenaf plates increase at 100 % and 50 % respectively when bonded with MFC on their surfaces
Plate vibration testing suggests that the bonding technique is the most influential factor in micro energy harvesting at the vibration range of 20 to 60 Hz. Hence, MFC bonded to the surface is proposed as the best technique for promoting higher micro energy harvesting for woven kenaf plate at the vibration range of 20 to 60 Hz.
Several factors highlighted optimizing bonded technique including the damping effect due to MFC, the kenaf woven type, the distance from neutral axis, the stiffness of structure, the excitation vibration and the neutral frequency of a structure. This information may contribute as guidance for future designer and engineer. Besides that, the results can be used to analyze data in the research to identify the quality of micro energy generated in turbine blades.
References
-
Herbert G. M. J., Iniyan S., Sreevalsan E., Rajapandian S. A review of wind energy technologies. Renewable and Sustainable Energy Reviews, Vol. 11, 2007, p. 1117-1145.
-
Hashim H., Wai S. H. Renewable energy policies and initiatives for a sustainable energy future in Malaysia. Renewable and Sustainable Energy Reviews, Vol. 15, 2011, p. 4780-4787.
-
Sopian K., Othman M. Y. H., Wirsat A. The wind energy potential of Malaysia. Renewable Energy., Vol. 6, 1995, p. 1005-1016.
-
Hamdan A., Mustapha F., Ahmad K. A., Mohd Rafie A. S. A review on the micro energy harvester in structural health monitoring (SHM) of biocomposite material for vertical axis wind turbine (VAWT) system: a Malaysia perspective. Renewable and Sustainable Energy Reviews, Vol. 35, 2014, p. 23-30.
-
Masseran N., Razali A. M., Ibrahim K. An analysis of wind power density derived from several wind speed density functions: the regional assessment on wind power in Malaysia. Renewable and Sustainable Energy Reviews, Vol. 16, 2012, p. 6476-6487.
-
Masseran N., Razali A. M., Ibrahim K., Zin W. Z. W. Evaluating the wind speed persistence for several wind stations in Peninsular Malaysia. Energy, Vol. 37, Issue 1, 2012, p. 649-656.
-
Shalwan A., Yousif B. F. In State of Art: Mechanical and tribological behaviour of polymeric composites based on natural fibres. Materials and Design, 2013, p. 14-24.
-
Stuart T., Liu Q., Hughes M., McCall R. D., Sharma H. S. S., Norton A. Structural biocomposites from flax. Part 1: effect of bio-technical fibre modification on composite properties. Composites Part a-Applied Science and Manufacturing, Vol. 37, 2006, p. 393-404.
-
Oksman K., Skrifvars M., Selin J. F. Natural fibres as reinforcement in polylactic acid (PLA) composites. Composites Science and Technology, Vol. 63, 2003, p. 1317-1324.
-
Lee S. H., Wang S. Q. Biodegradable polymers/bamboo fiber biocomposite with bio-based coupling agent. Composites Part a-Applied Science and Manufacturing, Vol. 37, 2006, p. 80-91.
-
Liu W. J., Misra M., Askeland P., Drzal L. T., Mohanty A. K. ‘Green’ composites from soy based plastic and pineapple leaf fiber: fabrication and properties evaluation. Polymer, Vol. 46, 2005, p. 2710-2721.
-
Plackett D., Andersen T. L., Pedersen W. B., Nielsen L. Biodegradable composites based on L-polylactide and jute fibres. Composites Science and Technology, Vol. 63, 2003, p. 1287-1296.
-
Wambua P., Ivens J., Verpoest I. Natural fibres: can they replace glass in fibre reinforced plastics? Composites Science and Technology, Vol. 63, 2003, p. 1259-1264.
-
Nishino T., Hirao K., Kotera M., Nakamae K., Inagaki H. Kenaf reinforced biodegradable composite. Composites Science and Technology, Vol. 63, 2003, p. 1281-1286.
-
Cao Y., Goda K., Wu Y., Chem Ind P. Mechanical properties of kenaf fibers reinforced biodegradable composites. Proceedings of the International Conference on Advanced Fibers and Polymer Materials, Vols. 1-2, 2007, p. 299-302.
-
Ochi S. Mechanical properties of kenaf fibers and kenaf/PLA composites. Mechanics of Materials, Vol. 40, 2008, p. 446-452.
-
Yahaya R., Sapuan S. M., Jawaid M., Leman Z., Zainudin E. S. Effects of kenaf contents and fiber orientation on physical, mechanical, and morphological properties of hybrid laminated composites for vehicle spall liners. Polymer Composites, Vol. 36, Issue 8, 2015, p. 1469-1476.
-
Faruk O., Bledzkia A. K., Fink H.-P., Sain M. Biocomposites reinforced with natural fibers: 2000-2010. Progress in Polymer Science, Vol. 37, 2012, p. 1552-1596.
-
Davoodi M. M., Sapuan S. M., Ahmad D., Ali A., Khalina A., Jonoobi M. Mechanical properties of hybrid kenaf/glass reinforced epoxy composite for passenger car bumper beam. Materials and Design, Vol. 31, 2010, p. 4927-4932.
-
Zampaloni M., Pourboghrat F., Yankovich S. A., Rodgers B. N., Moore J., Drzal L. T., et al. Kenaf natural fiber reinforced polypropylene composites: a discussion on manufacturing problems and solutions. Composites: Part A, Vol. 38, 2007, p. 1569-1580.
-
Akil H. M., Omar M. F., Mazuki A. A. M., Safiee S., Ishak Z. A. M., Abu Bakar A. Kenaf fiber reinforced composites: a review. Materials and Design, Vol. 32, 2011, p. 4107-4121.
-
Larsen G. C., Hansen M. H., Baumgart A., Carlen I. Modal Analysis of Wind Turbine Blades. Risø National Laboratory, Roskilde, Denmark, 2002.
-
Hyun Jeong S., Choi Y.-T., Wereley N. M., Purekar A. S. Energy harvesting devices using macro-fiber composite materials. Journal of Intelligent Material Systems and Structures, Vol. 21, Issue 6, 2010, p. 647-658.
-
Park S., Lee J.-J., Yun C.-B., Inman D. J. Electro-mechanical impedance-based wireless structural health monitoring using PCA-Data compression and k-means clustering algorithms. Journal of Intelligent Material Systems and Structures, Vol. 19, 2008, p. 509-520.
-
Ali W. G., Ibrahim S. W. Power analysis for piezoelectric energy harvester. Energy and Power Engineering, Vol. 4, 2012, p. 496-505.
-
Anton S. R., Sodano H. A. A review of power harvesting using piezoelectric materials (2003-2006). Smart Materials and Structures, Vol. 16, 2007, p. R1-R21.
-
Erturk A., Inman D. J. An experimentally validated bimorph cantilever model for piezoelectric energy harvesting from base excitations. Smart Materials and Structures, Vol. 18, Issue 2, 2009, p. 025009.
-
Sodano H. A., Inman D. J., Park G. H. Comparison of piezoelectric energy harvesting devices for recharging batteries. Journal of Intelligent Material Systems and Structures, Vol. 16, 2005, p. 799-807.
-
Ralib A. A. M., Nurashikin A., Salleh H. Fabrication techniques and performance of piezoelectric energy harvesters. 3rd International Conference on Energy and Environment, Malacca, 2009.
-
Kahrobaiyan M. H., Asghari M., Ahmadian M. T. A Timoshenko beam element based on the modified couple stress theory. International Journal of Mechanical Sciences, Vol. 79, 2014, p. 78-83.
-
Daqaq M. F., Stabler C., Qaroush Y., Seuaciuc-Osario T. Investigation of power harvesting via parametric excitations. Journal of Intelligent Material Systems and Structures, Vol. 20, 2009, p. 545-57.
-
Song H. J., Choi Y.-T., Purekar A. S., Wereley N. M. Performance evaluation of multi-tier energy harvesters using macro-fiber composite patches. Journal of Intelligent Material Systems and Structures, Vol. 20, 2009, p. 2077-88.
-
Tien C. M. T., Goo N. S. Use of a piezo-composite generating element for harvesting wind energy in an urban region. Aircraft Engineering and Aerospace Technology: An International Journal, Vol. 82, 2010, p. 376-81.
-
Pabut O., Allikas G., Herranen H., Talalaev R., Vene K. Model validation and structural analysis of a small wind turbine blade. 8th International DAAAM Baltic Conference, Tallinn, Estonia, 2012.
-
Jenq S. T., Hwang G. C., Yang S. M. The effect of square cut-outs on the natural frequencies and mode shapes of GRP cross-ply laminates. Composite Science and Technology, Vol. 47, 1993, p. 91-101.
-
Wang W., Yang Z., Song Q. Macro fiber composite (MFC) piezoelectric actuator excitation method for in flight leading edge deicing. Advances in Structural Health Management and Composite Structures, Jeonju, Republic of Korea, 2012.
-
Taguchi G. Introduction to Quality Engineering. Asian Productivity Organization, Tokyo, 1990.
About this article

The authors would like to thanks Ministry of Education, Malaysia and Universiti Putra Malaysia for providing the MyPhD Grants and Fundamental Research Grant Scheme FRGS 5524501 for this research work.
A. Hamdan as main author of the article who was conducting and planed the research activities. Each co-author gives significant contribution in producing the research output and research article. Faizal Mustapha is a Head of Structural Health Monitoring System Laboratory. His expertise was in handling the Modal testing equipment and analyzing modal testing results. Kamarul Ariffin Ahmad and Azmin Shakrine Mohd Rafie is a new team exploring the application of Taguchi method and Signal to Noise ratio analysis in the experiment. This new team works vigorously to specialist in this method for future research. The selection of biocomposite material and resin composite application was conducted in extensive discussion with Mohd Ridzwan Ishak. The best supplier of material for kenaf composite fabrication was proposed by him. Al Emran Ismail give his very best contribution in developing the homemade handloom machine for weaving kenaf yarn. He also proposed the woven orientation of kenaf fiber in this research.
