Abstract
For rolling bearing diagnosis, the major challenge of signal processing technique is to extract the quasi-periodic impulses which generated by rolling bearing fault, especially when rolling bearing operated in the condition of heavy noise. This paper proposed a new bearing fault diagnosis scheme. First, the Minimum Entropy Deconvolution (MED) is taken to obtain the impulse excitations from the bearing vibration signal. Then, two kinds of morphological filter, named average filter(AVG) and difference filter (DIF), are used as the assisted filtering unit to reduce the random noise in original signal and integrate the positive and negative impulse excitations in MED filtered signal, respectively. At last, the STFT based ridge demodulation analysis is applied to the purified signal, and the bearing fault is easily identified by spectral analysis of the demodulated signal. Two simulated signal are analyzed to test the performance of the proposed scheme. In the first case, the periodic impulse signal adding with random noise is analyzed. The result shows that MED-AVG-DIA is the best scheme for impulse feature extraction. In the second case, the pure impulse signal which filtered by MED is analyzed. The result shows that STFT based ridge demodulation analysis can achieve better demodulation effect than other demodulation methods. The proposed fault diagnosis scheme has been further verified by simulation signal and measured vibration signals of defective bearing. The result shown that the proposed scheme is feasible and effective for the fault diagnosis of rolling bearing.
1. Introduction
Rolling bearings are widely used in rotating machinery and play a pivotal role in the advanced manufacturing industry. The failure of rolling bearings is one of the foremost causes of breakdown in engineering application, which could result in the deterioration of machine performance. Therefore, rolling bearing fault diagnosis technique gain a great deal of attention in the past decades [1-3].
Vibration monitoring has been the most commonly used approach for bearing fault detection. When every running roller passes through the localized defect position, a series of quasi-periodic impact signal is excited in low frequency, designated as characteristic frequency [4]. As is well known, the characteristic frequency will appear in different values for different bearing fault types, so it could easily detect the bearing type by utilize the characteristic frequency information. However, the measured vibration signals in real situation is thoroughly complex. Those impacts often have wide-band energy. They could further modulated in amplitude by the load borne and the transfer function of the transmission path [5]. Additionally, the vibration signal acquired form operating machines often contain contribution from several different components as well as noise. Therefore, the major challenge of bearing fault diagnosis is to extract the quasi-periodic impulses which generated by the bearing fault, especially when rolling bearing operated in the condition of heavy noise [6].
In order to extract the sensitive characteristic signal of rolling bearing, various of signal processing methods have been proposed. In the early stage, conventional signal processing techniques, such as Fourier transform, short-time Fourier transform (STFT) and Wigner-Viller distribution (WVD) has been the dominating signal processing tool for bearing fault detection. But, they all assume that the vibration signals are stationary and linear, which is not coincident with the engineering actual situation [7]. Subsequently, Wavelet transform (WT) is proposed to analysis the non-stationary vibration signals [8]. Nevertheless, there are also some crucial restrictions of WT, e.g., its analysis result deeply depends on the predetermined wavelet base function. In short, inner product transform is the salient feature of those described methods, which does not take into account the signal’s own characteristics [9].
Another class of signal processing method, called as data driven techniques or adaptive techniques, has become very attractive in recent year. Empirical Mode Decomposition (EMD) has been the first technique belonging to this category probably. It is a self-adaptive signal processing which the basis function is determined by the signal itself, and it has been widely applied in fault diagnosis of rolling bearing [10, 11]. Minimum Entropy Deconvolution (MED) is another example appertain to adaptive techniques category. Contrary to the EMD, which decompose the complicated signal into a series of almost orthogonal components named intrinsic mode functions (IMFs), the MED algorithm enhances the peakedness of the signal by deconvolving the impulse excitation from the measured signal [12].
The MED is particularly effective to reduce the spread of impulse response function, and obtain the original impulse signals that rise to them. There are many relevant work has been done by using MED for fault diagnosis of mechanical systems, e.g., Endo et al. [13] combined AR and MED filter for gear fault diagnosis. Barazcz et al. [14] and Sawalhi et al. [15] using MED and MED-spectral kurtosis method for fault detection enhancement of rolling bearing, respectively. However, in practical applications of MED, some problems still need to be solved, e.g., the reducing of random noise masked in original signal, the integrating of positive and negative impulse excitations in MED filtered signal and the selecting of appropriate demodulation method for MED filtered signal. In order to solved those problems in practical applications of MED, morphological filter and ridge demodulation method are introduced in this paper.
The morphological filter has been used in fault diagnosis of rolling bearing successfully. To reduce the random noises, a morphological de-noising filter, named average filter (AVG) in ref [16], can inhibit the pulse interference and the random noises effectively. To integrate the positive and negative impulse excitations in MED filtered signal, the another morphological filter, named difference filter (DIF) in ref [17], can be used to extract the positive and negative impact features simultaneously. In brief, the morphological filter can overcome the first two shortcomings with different morphological filter.
Conventional demodulation method is based on the time domain. It has its own merits as well as deficiencies, e.g., envelope analysis (EA) usually require a suitable frequency band which is centered on the resonance frequency, energy separation algorithm (ESA) require that the signal to be processed is a narrow-band monocomponent [18, 19]. Compared with conventional demodulation method, ridge demodulation method, which uses STFT or WT to obtain instantaneous amplitude (IA) and instantaneous frequency(IF) in time-frequency domain, has been applied to capture the demodulation information effectively [7]. For lack of relevant studies on select a suitable demodulation method for MED filtered signal, and ridge demodulation method has higher accuracy than EA in simulated modulation signal [21]. Therefore, the ridge demodulation method would be a reasonable choice for demodulate the characteristic frequency from MED filtered signal.
For the above reasons, this paper proposed a new bearing fault diagnosis scheme using MED-morphological filter and ridge demodulation analysis. First, the MED filter is taken to obtain the impulse excitation from the measured vibration signal. Then, to reduce the random noise in original signal and extract the positive and negative impulse excitations in MED filtered signal, two kinds of morphological filter (AVG and DIF) is used as assisted filtering unit. At last, the ridge demodulation method is applied to the purified signal and the bearing fault is easily identified by spectral analysis of the demodulated signal.
The rest of this paper is organized as follows. We briefly summarize the basic principle of MED and morphological filter in Section 2.1 and 2.2, respectively. In Section 2.3, in order to extracted the impulse excitation effectively, the combination of MED and morphological filter is applied to a simulate synthesized signal. The fundamental theory of ridge analysis and its demodulation effect analysis is carried out in Section 3.1 and 3.2, respectively. Then the proposed fault diagnosis scheme and its anti-noise performance are shown in Section 4. In Section 5, experimental analysis of the defective bearing vibration signal is conducted, to verify the effectiveness of the proposed scheme. Finally, conclusions are drawn in Section 6.
2. Minimum entropy deconvolution and morphological filter
2.1. Minimum entropy deconvolution
The minimum entropy deconvolution (MED) method was initially introduced by Wiggins and has shown its effectiveness to sharpen the reflectivity information from different subterranean layers in reflection seismic signals [22]. The basic idea is interactively selects an optimum filter to minimize the entropy of the filtered signal without any prior knowledge [23]. In the case of vibration signal of rolling bearing with localized defect, minimizing the entropy corresponds to enhancing the structured impulse signals, and thus have high kurtosis. Therefore, Randall also called this method by another name ‘maximum kurtosis deconvolution’ [12]. Theoretically, the process can be summarized as follows:
Let denote an structural function representing all the paths between the rolling bearing and the sensor, the measured vibration signal with addition noise are shown as:
where represent the impulse excitation when rolling element pass through localized defect position. Therefore, the goal of the deconvolution is to search for an optimum filter that recovering the impulse excitation from the measured signal . If a filter is applied to the signal , it is possible to obtain:
Expressing the Eq. (2) as a function of discrete sampled points, it can be reconstructed as:
where and . is the signal length and is the filter length.
Considering the output of Eq. (3), the final signal is a simple solution, characterized by maximum value of kurtosis. The kurtosis is taken as the normalized fourth order moment, and the varimax criterion is defined by [12]:
By exploiting the varimax criterion definition, the signal kurtosis can be maximized by means of iteratively selects an optimum filter . The criterion maximization allows finding the output which best fits the impulse excitation of .
In addition, the toolbox for MED was written by McDonald, and the length of the finite impulse filter and the termination condition are two key parameters for the MED. In this paper, the values of each parameter are selected 30 and 0.01, respectively, as suggested in Ref. [23].
2.2. Morphological filter
Mathematical morphological was originally introduced in images processing by Serra [24]. Then it was extended to other signal processing areas, such as electrocardiogram signal and vibration signal [25-27]. The basic concept of morphological signal processing is to modify the signal by the algebra of non-linear operators, which transforming it through its intersection with another object called structuring element (SE). The primary morphological operators are dilation and erosion, and from these two, derived operations such as opening and closing can be constituted.
Let be the original 1-D vibration signal and be the set of a SE, while and is defined over a domain and , respectively. Two basic morphological operators, dilation and erosion, can be defined as follows [17]:
where denote the dilation operator and denote the erosion operator.
Follow by the defined of dilation and erosion, more complex morphological operations such as closing operator and opening operator can be constituted as follow [17]:
where denote the closing operator and denote the opening operator.
Since different morphological operators can be used to extract different morphological features, in practice, morphological operators are chosen based on application needs. Zhang et al. [17] had already summarized the various effects of the morphological operators for impulsive features signal. It could be concluded from his studies that the closing operator mainly preserves the positive impulse and inhibit the negative impulse, but the contrary is the case in opening operator. Therefore, some kinds of combination of closing operator and opening operator need to be defined, such as AVG and DIF.
The morphological AVG filter can be used to smooth the positive and negative impulsive features, corresponding to filter noises. It is defined as follow [28]:
The morphological DIF filter, which can integrate the positive and negative impact signal, is defined as follow [28]:
where is used to extract negative impulsive features while is used to extract positive impulsive features. Therefore, the DIF filter can extract the positive and positive impulsive features simultaneously.
SE is another critical issue to be analysis in addition to the morphological operators. Generally, the attributes of SE are controlled by its shape, height and length. The shapes of SE would be constituted in various forms, such as flat, triangle, semicircle and so on. In order to get better morphological filtering effect, the suitable parameter is selected based on prior knowledge of the vibration signal. In the present study, the flat SE is used for detecting impulse signal because it is the simplest and suitable method, with its heights are defined as zero [28]. Furthermore, it is confirmed that the length of SE is another important parameter for morphological filter. In general, the width of MED filtered signal is very narrow. Therefore, the SEs length is selected as 5 point according to Ref. [26].
2.3. The combination of MED and morphological filter
Since AVG and DIF are two kinds of morphological filter for different application needs, when combine MED and morphological filter, it is actually a combination of the three method (MED, AVG and DIF). On the other hand, this combination is based on some facts. First, the relationship between AVG and MED is parallel. Second, DIF will be implement as a final step. Therefore, there are two combinations in all, marks as AVG-MED-DIF and MED-AVG-DIF. In order to study the performance of those different combination forms, simulations will be carried out as follow:
(1) AVG-MED;
(2) MED-AVG;
(3) AVG-MED-DIF;
(4) MED-AVG-DIF;
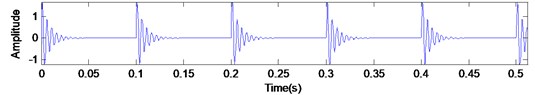
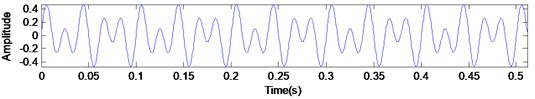
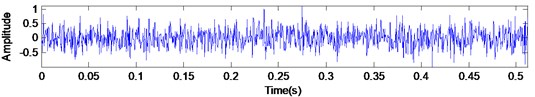
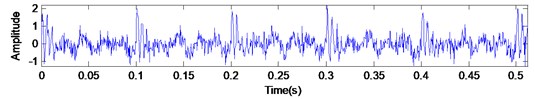
Suppose the simulated signal is:
where is a series of impulse response signal with the period of 0.1 s. is the hybrid signal of two harmonic waves which the frequency parameters are 30 Hz and 50 Hz, respectively:
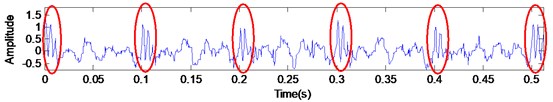
And is the Gaussian noise (signal to noise ratio SNR 10 dB). The three components and the simulation signal combined by them are shown in Fig. 1, respectively. We can easily find that the impulse signal is immersed in heavy noises.
Fig. 1The three components and the simulation signal
a)
b)
c)
d)
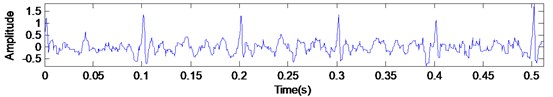
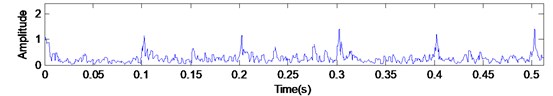
Fig. 2Comparison of impulse extract method by different algorithms
a) AVG-MED
b) MED-AVG
c) AVG-MED-DIF
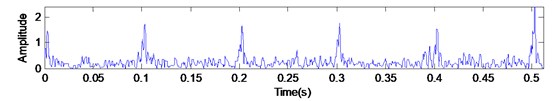
d) MED-AVG-DIF
The impulse feature extraction results of the four methods are shown in Fig. 2. It can be seen that the AVG-MED method in Fig. 2(a) suffers from the disadvantages that a single impulse is turn into two ones (framed by ellipses), so the process effect in Fig. 2(b) is superior to the result in Fig. 2(a). After adding the DIV method, the processed signal in Fig. 2(c), (d) are better than the filtered signal in Fig. 2(a), (b). Besides that, it is observed that the MED-AVG-DIV method can obviously extract the impulse signal effectively.
Since the goal of MED is interactively select an optimum filter to maximize the value of kurtosis, kurtosis is an important indicator to evaluate the MED filtered result. Extending this conceive, the signal which filtered by the four methods are further measured by kurtosis as shown in Table 1. The MED-AVG-DIA has the maximum kurtosis (19.0606). Therefore, it also proved that the MED-AVG-DIA is the best scheme for impulse feature extraction.
Table 1The kurtosis of the four impulse extraction methods
Evaluation index | Original signal | AVG-MED | MED-AVG | AVG-MED-DIA | MED-AVG-DIA |
Kurtosis | 4.9155 | 9.7466 | 16.3002 | 16.7015 | 19.0606 |
3. Ridge demodulation analysis
3.1. Time-frequency ridge analysis
Time-frequency ridges analysis was initially introduced by Delprat to extract the time-frequency characteristics of musical sounds [29]. In general, Time-frequency ridge analysis involves two approaches, named STFT based ridge analysis and CWT based ridge analysis. Due to the paper length, a brief introduction of STFT based ridge analysis is summarized as follow and the CWT based ridge analysis could be found in [20].
Suppose the analytic function of a real signal can be expressed as [29]:
where is the analytic amplitude of the signal and is the instantaneous frequency.
For a fixed windows function scale , after selecting the corresponding short time Fourier atoms , the resulting windowed Fourier transform is [20]:
The spectrogram measures the energy of in a time-frequency neighborhood of . The relationship between and the instantaneous frequency of as follows [7]:
The instantaneous frequency can be further calculate form ridge frequency as and the instantaneous amplitude is calculated by [20]:
It can be seen from Eq. (15) and Eq. (16) that the ridge algorithm computes the signal instantaneous frequencies and amplitudes from the local maxima of spectrogram, and the frequency and amplitude modulation laws are obtained. Therefore, time-frequency ridge analysis is also a kind of demodulation method.
3.2. The combination of MED and ridge demodulation analysis
Suppose the simulated signal is a series of impulse response signal with same amplitude but different impulse response function. The sampling frequency is 3000 Hz and the time period between each interval impact is 0.1 s. The time domain waveforms of simulated signal and the MED filtered signal is shown in Fig. 3(a) and (b), respectively. As shown in Fig. 3(b), the MED filtered signal, similar to a series of pulse signal, is extracted from the original signal without any impulse response functions. While the advantage of MED seems obvious, the study of corresponding demodulation method will be discussed in greater detail in subsequent content.
Fig. 3The time domain waveform of the simulated signal and the MED filtered signal
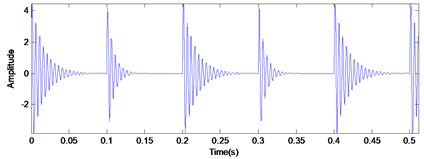
a) The simulated signal
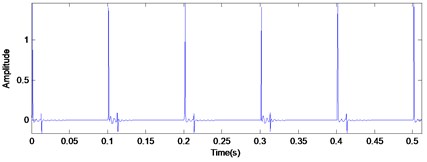
b) The MED filtered signal
Because ridge analysis involves two approaches (STFT based ridge analysis and CWT based ridge analysis), there are two combination forms between MED and ridge analysis. In addition, the MED and envelope analysis is available for comparative study as well. Therefore, simulation experiments will be implemented to study the performance of different combination forms as follow:
(1) MED-STFT based ridge analysis;
(2) MED-CWT based ridge analysis;
(3) MED-envelope analysis.
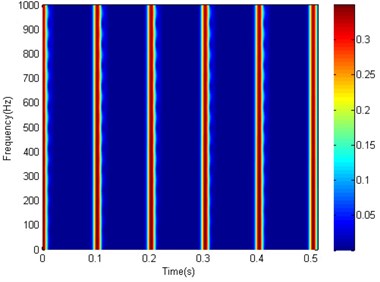
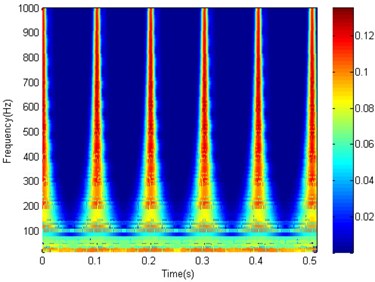
Since time-frequency ridge analysis need to construct the spectrogram first, the MED filtered signal in Fig. 3(b) is processed by STFT and CWT, respectively, with the same windows function scale (64). Fig. 4(a) is the analysis result of STFT spectrogram and Fig. 4(b) is the analysis result of CWT spectrogram. It is easy to find that the STFT spectrogram of each pulse has a constant width, while the CWT spectrogram of each pulse is similar to a tip hat (narrow at the top and wide at the bottom). The main reason for those different is that the STFT time-frequency resolution is constant while the CWT time-frequency resolution is different (low frequency has good frequency resolution and high frequency has good time resolution).
Fig. 4The time-frequency spectrogram of the MED filtered signal
a) STFT based spectrogram (64)
b) CWT based spectrogram (64)
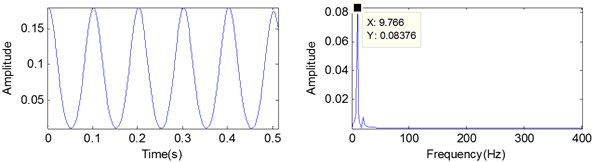
Fig. 5Analyzed results of MED filtered signal by: a) MED-STFT based ridge analysis; b) MED-CWT based ridge analysis; and c) MED-envelope analysis
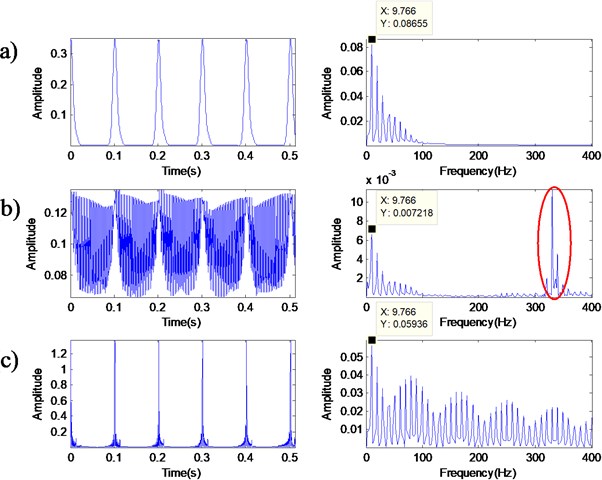
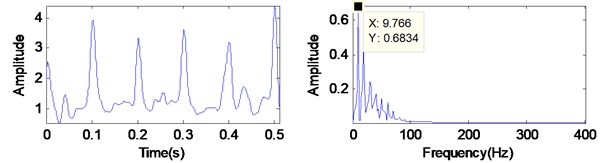
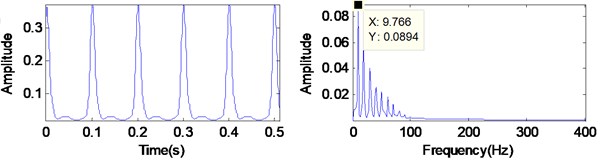
Based on these different spectrogram, the STFT based demodulation ridge and its spectrum is shown in Fig. 5(a), and the CWT based demodulation ridge and its spectrum is shown in Fig. 5(b). Fig. 5(c) display the envelop of the MED filtered signal and its spectrum. From the demodulated spectrum with different method, we could obtain the interval of impulse easily (nearly 10 Hz). However, the high frequency (framed by ellipses) in Fig. 5(b) would interfere with the analysis result and serious frequency doubling phenomenon occurred in Fig. 5(c), so the demodulated result of MED-CWT based ridge analysis and MED-envelope analysis can’t compare with the work in MED-STFT based ridge analysis. The main reason for those high frequency happened in Fig. 5(b) can be analyzed as follow. When facing the pulse signal, the wavelet coefficient in low frequency changes very quickly, due to the fact that CWT have characteristics of multi-resolution. Hence, the fluctuation of ridge demodulation signal also increased with the wavelet coefficient, and those high frequency component formed. So MED-CWT based ridge analysis is unfit for analysis the MED filtered signal. On the other hand, the traditional envelope analysis is unsuited to demodulate the MED filtered signal because the envelop result is as well as pulse signal. This characteristic determines the frequency doubling phenomenon will not decay. Therefore, MED-STFT based ridge analysis can achieve better result than others.
Fig. 6The STFT based spectrogram of the MED filtered signal
a)128
b)256
Fig. 7The demodulation signal using STFT based ridge analysis and its spectrums
a)128
b)256
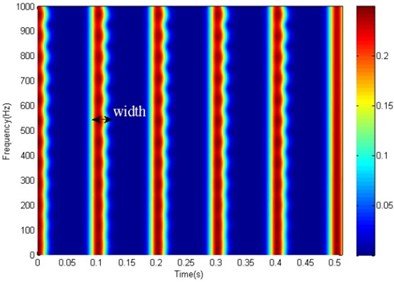
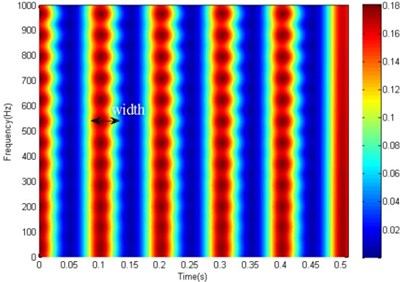
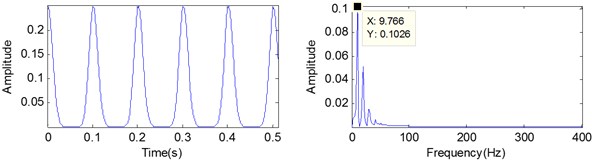
When applying the STFT based ridge analysis, it should be noted that the success of the performance would depend crucially on the scale of windows function as described in Section 3.1. Fig. 6(a) and Fig. 6(b) are the STFT spectrogram with the same MED filtered signal when the scale chosen is 128 and 256, respectively. Meanwhile, the demodulation signal and its spectrums are shown in Fig. 7. It can be seen from Fig. 6 that the width of spectrogram in each impact increased with the scale of windows function. A suitable scale can obtain impulse frequency with less interference, especially when the scale is select as 256 as shown in Fig. 7(b). Besides that, 256 sampling point approximately equal to the time period between each interval impact (0.1 s in time domain). Therefore, in order to obtain a good analysis result for periodic impact signal, the windows function scale may select as the reciprocal of time period between each interval impact. Extending this conceive, for rolling bearing fault diagnosis, the windows function scale may select as the reciprocal of the theoretical fault characteristic frequency.
4. Proposed bearing fault diagnosis scheme and its anti-noise performance
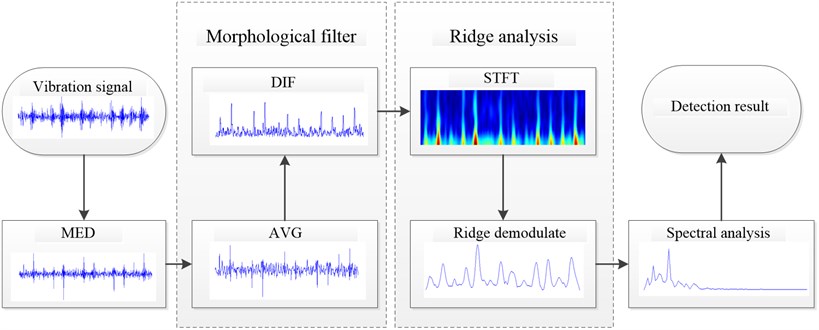
For those above reason, the scheme of bearing fault diagnosis using MED-morphological filter and ridge demodulation analysis is proposed. The complete scheme of the proposed method is show in Fig. 8. In this scheme, some key parameters need to be determined in advance, e.g., the length of the finite impulse filter and the termination condition in MED, the length of SE in morphological, and the scale of STFT windows function in ridge analysis. Since only a small number of parameters have to be adjusted depending on the analyzed signal, the fault diagnosis scheme is an semi-automated method essentially.
Fig. 8The proposed scheme of bearing fault diagnosis
To test how well the proposed fault diagnosis scheme work with the additive noise, the simulated signal in Section 2.3 is further analyzed. Fig. 9(a) is the analysis result of the simulated signal (which add with 10 dB Gaussian noise), and Fig. 9(b) is the analysis result of the simulated signal (which without any noise). Form Fig. 9, both the interval of impulse (nearly 10 Hz) are easily recognizable and both the frequency composition are consistent, even though the signal amplitude is different. The simulated result show that the proposed method has the capability of noise immunity.
5. Experimental validation
In this section, the capability of the proposed approach is further verified by defective bearing vibration data. The real vibration signal come from the bearing data center website of Case Western Reserve University, which has become a standard data used to test new diagnostic algorithms. During the experiments, the motor bearing type is 6205-2RS JEM SKF and defective bearings which seeded with single point faults (including outer race fault, inner race fault and rolling element fault) using electro-discharge machining were reinstalled on the test motor. The discrete vibration signal was measured using data acquisition system in real time.
Fig. 9Analyzed results of by the proposed method
a) The simulated signal in Section 2.3 which add with 10 dB Gaussian noise
b) The simulated signal in Section 2.3 without any noise
5.1. Experimental analysis of the defective bearing with an inner race fault
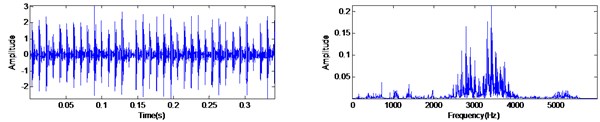
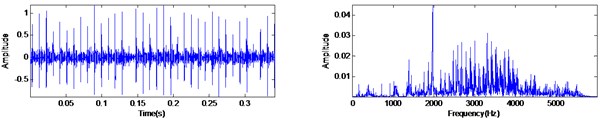
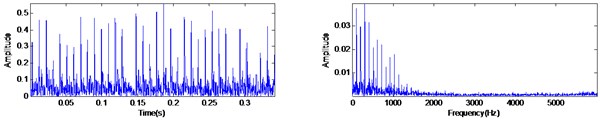
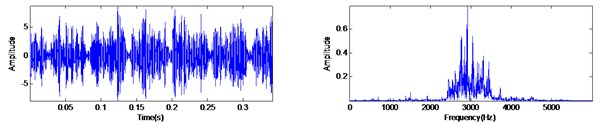
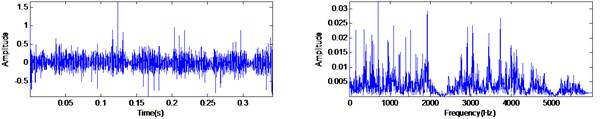
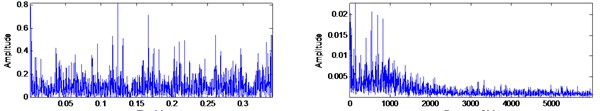
The inner race fault experiment is performed with sampling frequency of 12 KHz at the rotating speed of 1730 rpm (the rotating frequency of the rotor is 29.6 Hz). According to the specifications of the bearing, the fault characteristic frequency of the inner race can be calculated as 157.94 Hz. The original waveform of and its spectrum are shown in Fig. 10(a). It can be seen that the vibration signal presents the quasi-periodic impact features which generated by the bearing fault. The MED filtered signal and proposed MED-AVG-DIF method filtered signal are shown in Fig. 10(b) and Fig. 10(c), respectively. From Fig. 10(b), the impacts signal without any impulse response functions is extracted, but there exist serious noise and the positive and negative impacts existing all at once. Meanwhile, the experiment result in Fig. 10(c) have shown some improvement, e.g., the positive and negative impacts all transform into positive impacts and more impact signals are extracted obviously. In addition, the low frequency components have been retained while the high frequency components have been removed in MED-AVG-DIF filtered signal comparing with the original signal in Fig. 10(a).
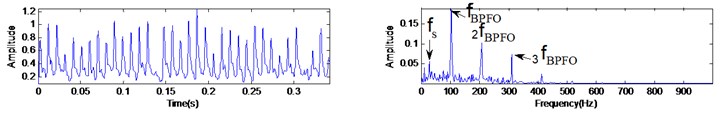
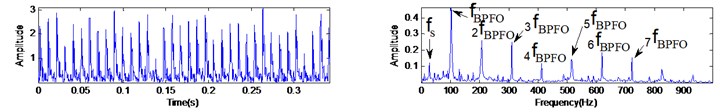
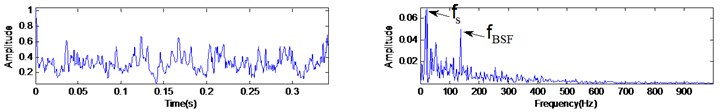
By applying STFT based demodulation ridge analysis to MED-AVG-DIF filtered signal, where STFT windows function scale 128, the demodulated waveform and its spectrum is shown in Fig. 11(a). The rotating frequency and the fault characteristic frequency are revealed obviously. This confirms the effectiveness of the proposed method for inner race fault diagnosis.
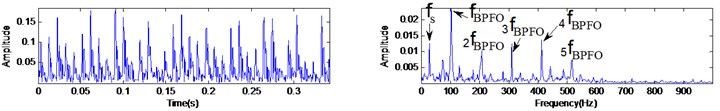
As a comparison, the original signal is analyzed by MED-ridge demodulation analysis in Fig. 11(b), which does not use the morphological filter compare to the proposed scheme. Because the interference frequency appears (framed by ellipses), the MED-ridge demodulation analysis cannot compare with the proposed scheme. Moreover, in order to validate the benefits of the proposed bearing fault diagnosis scheme, this signal is further analyzed by other widely used bearing fault diagnosis techniques, such as EEMD-based envelope analysis method and kurtogram-based envelope analysis method. In the EEMD-based envelope analysis method, the first two IMFs will be retained for envelope analysis, due to the fact that high-frequency band of vibration signal contains the key fault information of rolling bearing in Ref. [27]. The EEMD-based envelop and its spectrum is provided in Fig. 11(c). The rotating frequency and the fault characteristic frequency can be identified. however, there also exist many high frequency components (framed by ellipses), which may interfere with the diagnosis of the bearing fault.
In kurtogram-based envelope analysis method, the filter parameters, such as the central frequency and the frequency band, are identified by WPT based kurtogram with the maximal value of kurtosis. Then the filtered signal with the frequency band parameter of [3750, 4500] Hz is selected for envelope analysis. The kurtogram-based envelope and its spectrum is shown in Fig. 11(d). Though the fault characteristic frequency and its harmonic can be discovered observably, there also exist some high frequency noise. Therefore, it can be concluded that the proposed method is more effective than the other diagnosis method in detecting inner race bearing fault.
Fig. 10The vibration signal of inner race fault and the filtering result
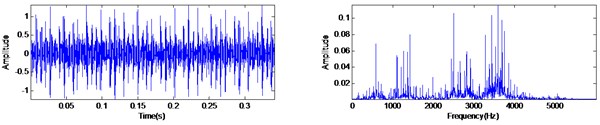
a) The original signal and its spectrum
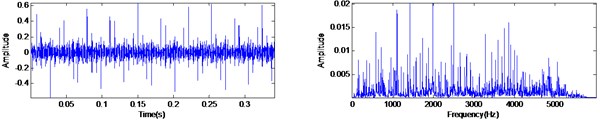
b) The MED filtered signal and its spectrum
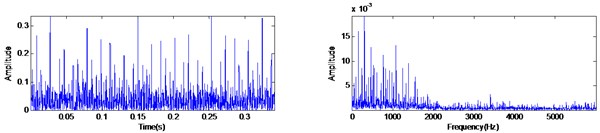
c) The MED-AVG-DIF filtered signal and its spectrum
Fig. 11Analyzed results of the inner race fault vibration signal
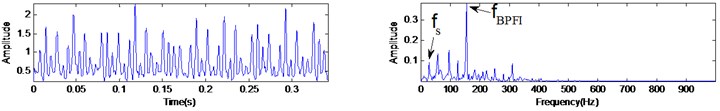
a) MED- morphological filter and ridge analysis
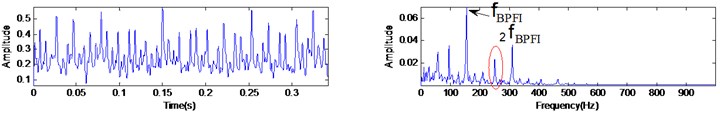
b) MED and ridge analysis
c) EEMD based envelope analysis
d) Kurtogram based envelope analysis
5.2. Experimental analysis of the defective bearing with an outer race fault
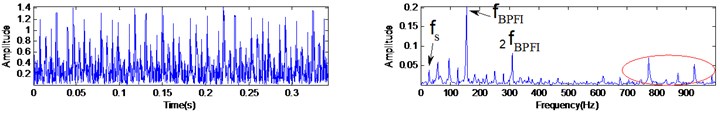
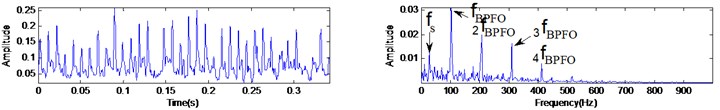
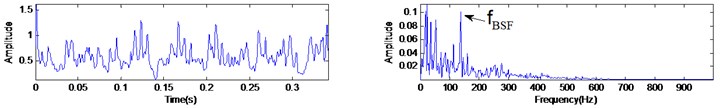
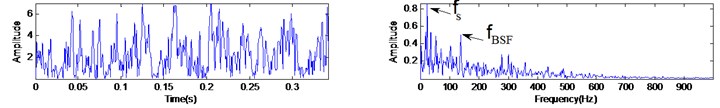
With the same condition of operating speed and sampling frequency in previous section, a typical bearing vibration signal with outer race fault is shown in Fig. 12(a). By comparing Fig. 12(a) with Fig. 10(a), it can be found that the outer race fault signal has a periodic features even more obvious because the background noise is very weak. Moreover, the frequency of rotor rotating is 29.6 Hz and the ball pass frequency in outer race (BPFI) is estimated at 104.56 Hz. The filtered signal using MED and MED-AVG-DIF is shown in Fig. 12(b) and Fig. 12(c), respectively. The experiment results show that both of the two method can extract the impacts signal effectively.
The MED-AVG-DIF filtered signal is further demodulated by STFT based ridge demodulation analysis, where STFT windows function scale 128. The demodulated waveform and its spectrum is shown in Fig. 13(a). From Fig. 13(a), the BPFI together with its second-order, third-order harmonics are prominent. Therefore, it can be inferred that there exists an outer race fault.
Fig. 12The vibration signal of outer race fault and the filtering result
a) The original signal and its spectrum
b) The MED filtered signal and its spectrum
c) The MED-AVG-DIF filtered signal and its spectrum
By contrast, the MED-ridge demodulation method, EEMD-envelop method and kurtogram-envelop method are also analyze as shown in Fig. 13(b), Fig. 13(c) and Fig. 13(d), respectively. Among them, the first two IMFs is retained in EEMD. The frequency band [4500, 5250] Hz is calculated by WPT based kurtogram. From the experiment result of the above three methods, there are more higher-order harmonics occurred which seems redundant, so the proposed method is more fit to detecting outer race bearing fault.
5.3. Experimental analysis of the defective bearing with a rolling element fault
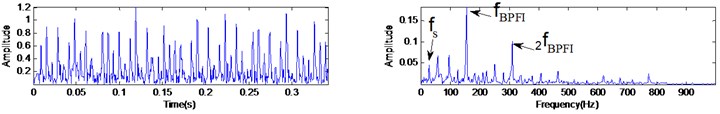
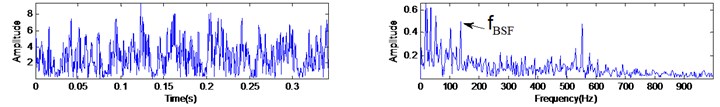
For the rotor with a rotating speed of 1750 rpm, the bearing signal with rolling element fault is measured, sampled with the frequency of 12 KHz. The ball passing spin frequency is 137.48 Hz. The original signal and its spectrum are shown in Fig. 14(a). From Fig. 14(a), it could be found that the impacts response is considerably obvious, while the periodic property among each impact is not clear. The filtered signal using MED and MED-AVG-DIF is shown in Fig. 14(b) and Fig. 14(c), respectively. This comparison shows the MED-AVG-DIF can obtain more impact characteristic form the original signal.
Applying STFT based ridge demodulation analysis to MED-AVG-DIF filtered signal, where STFT windows function scale 128, the demodulated signal and its spectrum is shown in Fig. 15(a), and the frequency of 137.48 Hz which corresponding to characteristic frequency of rolling element fault is identified clearly. It reveals that the proposed bearing fault diagnosis scheme is effective for the fault detection of rolling bearing.
Fig. 13Analyzed results of the outer race fault vibration signal
a) MED-morphological filter and ridge analysis
b) MED and ridge analysis
c) EEMD based envelope analysis
d) Kurtogram based envelope analysis
Fig. 14The vibration signal of rolling element fault and the filter result
a) The original signal and its spectrum
b) The MED filtered signal and its spectrum
c) The MED-AVG-DIF filtered signal and its spectrum
Applying MED-ridge demodulation analysis to the original signal, the characteristic frequency is also identified as displayed in Fig. 15(b), but there exists low frequency interference. Utilizing the EEMD-envelope analysis. The first two IMFs is reserved. The envelop of the reserved signal and its spectrum is shown in Fig. 15(c). There exists some high frequency which would interfere the diagnosis result. The kurtogram-envelope analysis method is also applied to the original signal with the selection of the frequency band [2250, 3000] Hz. The envelop signal and its spectrum is shown in Fig. 15(d). Although the fault frequency can be found in envelop spectrum, there still include of some high frequency components which make the result not convincing. In summary, the proposed method can achieve better experimental results than the other method in detecting rolling element bearing fault.
Fig. 15Analyzed results of the rolling element fault vibration signal
a) MED-morphological filter and ridge analysis
b) MED and ridge analysis
c) EEMD based envelope analysis
d) Kurtogram based envelope analysis
6. Conclusions
This paper proposes a new signal processing scheme for fault detection of rolling element bearing. Firstly, the MED is taken to obtain the impulse excitation from the bearing vibration signal. Secondly, to solve the problems occurred in practical applications of MED, e.g., the random noise in original signal and the positive and negative impacts in MED filtered signal, two kinds of morphological filter (AVG and DIF) are used as the assisted filtering unit. In order to study the different combination forms between MED and morphological filter, the periodic impulses signal adding with noise is analyzed. Simulation result demonstrate that the MED-AVG-DIA is the best choice in impulse extraction methods. Thirdly, to select an appropriate demodulation method for MED filtered signal, the pure impulses signal which filtered by MED is analyzed. The result shows that STFT based ridge demodulation analysis can achieve better demodulation effect than CWT based ridge demodulation analysis and envelop analysis. At last, the STFT based ridge demodulation analysis is applied to the MED-AVG-DIF filtered signal, and the specific fault is easily identified by spectral analysis of the ridge demodulated signal. The proposed bearing fault diagnosis scheme have been further verified by experimental analysis of defective bearing vibration signals. The result shown that the proposed scheme is feasible and effective for the fault diagnosis of rolling bearing in comparison with traditional method.
Although the effectiveness of the proposed fault diagnosis scheme has been verified through simulation analysis and laboratory experiments, some problems still exist in real applications: 1) the rolling bearing vibration signals in industrial environment is more complex than it in laboratory condition, e.g., it often contain irrelevant impulse which contribution from other components. Those irrelevant impulse could weaken the fault diagnosis ability of the proposed method. Therefore, how to identify the fault relevant impulse form the original signal need further investigation. 2) the MED method played an important role in the whole diagnosis scheme. However, the amplitude of MED filtered signal may different when facing different SNR noise. It may complicate the fault diagnosis result for different levels rolling bearing fault. In future work, some normalization method could be introduced also.
References
-
Kankar P. K., Sharma S. C., Harsha S. P. Fault diagnosis of ball bearings using machine learning methods. Expert Systems with Applications, Vol. 38, Issue 3, 2011, p. 1876-1886.
-
Ali J. B., Fnaiech N., Saidi L., et al. Application of empirical mode decomposition and artificial neural network for automatic bearing fault diagnosis based on vibration signals. Applied Acoustics, Vol. 89, 2015, p. 16-27.
-
Yang Y., Yu D., Cheng J. A fault diagnosis approach for roller bearing based on IMF envelope spectrum and SVM. Measurement, Vol. 40, Issue 9, 2007, p. 943-950.
-
Wang D., Peter W. T., Tsui K. L. An enhanced Kurtogram method for fault diagnosis of rolling element bearings. Mechanical Systems and Signal Processing, Vol. 35, Issue 1, 2013, p. 176-199.
-
Jiang R., Liu S., Tang Y., et al. A novel method of fault diagnosis for rolling element bearings based on the accumulated envelope spectrum of the wavelet packet. Journal of Vibration and Control, Vol. 21, Issue 8, 2015, p. 1580-1593.
-
Peng Z. K., Peter W. T., Chu F. L. A comparison study of improved Hilbert-Huang transform and wavelet transform: application to fault diagnosis for rolling bearing. Mechanical systems and signal processing, Vol. 19, Issue 5, 2005, p. 974-988.
-
Wang J., He Q., Kong F. Automatic fault diagnosis of rotating machines by time-scale manifold ridge analysis. Mechanical Systems and Signal Processing, Vol. 40, Issue 1, 2013, p. 237-256.
-
Yan R., Gao R. X., Chen X. Wavelets for fault diagnosis of rotary machines: A review with applications. Signal Processing, Vol. 96, 2014, p. 1-15.
-
Jiang R., Liu S., Jiang C. A method of fault diagnosis for rolling element bearings based on non-parametric atom matching. Journal of Vibroengineering, Vol. 16, Issue 7, 2014, p. 3317-3330.
-
Lei Y., Li N., Lin J., Wang S. Fault diagnosis of rotating machinery based on an adaptive ensemble empirical mode decomposition. Sensors, Vol. 13, Issue 12, 2013, p. 16950-16964.
-
Lei Y., Lin J., He Z., et al. A review on empirical mode decomposition in fault diagnosis of rotating machinery. Mechanical Systems and Signal Processing, Vol. 35, Issue 1, 2013, p. 108-126.
-
Randall R. B., Robert B., Antoni J. Rolling element bearing diagnostics – a tutorial. Mechanical Systems and Signal Processing, Vol. 25, Issue 2, 2011, p. 485-26.
-
Endo H., Randall R. B. Enhancement of autoregressive model based gear tooth fault detection technique by the use of minimum entropy deconvolution filter. Mechanical Systems and Signal Processing, Vol. 21, Issue 2, 2007, p. 906-919.
-
Barszcz T., Sawlhi N. Fault detection enhancement in rolling element bearings using the minimum entropy deconvolution. Archives of Acoustics, Vol. 37, Issue 2, 2012, p. 131-141.
-
Sawalhi N., Randall R. B., Endo H. The enhancement of fault detection and diagnosis in rolling element bearings using minimum entropy deconvolution combined with spectral kurtosis. Mechanical Systems and Signal Processing, Vol. 21, Issue 6, 2007, p. 2616-2633.
-
Hu A. J., Tang G. J., An L. S. De-noising technique for vibration signals of rotating machinery based on mathematical morphology filter. Chinese Journal of Mechanical Engineering, Vol. 42, Issue 4, 2006, p. 127-130.
-
Zhang L., Xu J., Yang J. Multiscale morphology analysis and its application to fault diagnosis. Mechanical Systems and Signal Processing, Vol. 22, Issue 3, 2008, p. 597-610.
-
Antoni J., Randall R. B. The spectral kurtosis: application to the vibratory surveillance and diagnostics of rotating machines. Mechanical Systems and Signal Processing, Vol. 20, Issue 2, 2006, p. 308-331.
-
Feng Z., Liang M., Zhang Y., et al. Fault diagnosis for wind turbine planetary gearboxes via demodulation analysis based on ensemble empirical mode decomposition and energy separation. Renewable Energy, Vol. 47, 2012, p. 112-126.
-
Mallat S. A Wavelet Tour of Signal Processing: the Sparse Way. 3rd Edition, Academic Press, 2008.
-
Luo S., Cheng J., Fu J. Application of self-adaptive wavelet ridge demodulation method based on LCD to incipient fault diagnosis. Shock and Vibration, 2015, (Available Online).
-
Kwak D. H., Lee D. H., Ahn J. H., et al. Fault detection of roller-bearings using signal processing and optimization algorithms. Sensors, Vol. 14, Issue 1, 2013, p. 283-298.
-
McDonald G. L., Zhao Q., Zuo M. J. Maximum correlated Kurtosis deconvolution and application on gear tooth chip fault detection. Mechanical Systems and Signal Processing, Vol. 33, 2012, p. 237-255.
-
Serra J. Image Analysis and Mathematical Morphology. Academic Press, 1983.
-
Buber J., Luria D., Sternik L., et al. Morphological features of the P-waves at surface electrocardiogram as surrogate to mechanical function of the left atrium following a successful modified maze procedure. Europace, Vol. 16, Issue 4, 2014, p. 578-586.
-
Meng L., Xiang J., Wang Y., et al. A hybrid fault diagnosis method using morphological filter-translation invariant wavelet and improved ensemble empirical mode decomposition. Mechanical Systems and Signal Processing, Vol. 50, 2015, p. 101-115.
-
He W., Jiang Z., Qin Q. A joint adaptive wavelet filter and morphological signal processing method for weak mechanical impulse extraction. Journal of Mechanical Science and Technology, Vol. 24, Issue 8, 2010, p. 1709-1726.
-
Hu A., Sun J., Xiang L. Analysis of morphological filter’s frequency response characteristics in vibration signal processing. Chinese Journal of Mechanical Engineering, Vol. 48, Issue 1, 2012, p. 98-103.
-
Delprat N., Escudie B., Guillemain P., et al. Asymptotic wavelet and Gabor analysis: extraction of instantaneous frequencies. IEEE transactions on Information Theory, Vol. 38, Issue 2, 1992, p. 644-664.
About this article
This work is supported financially by the National Natural Science Foundation of China (Nos. 51175316 and 51575331). The authors would like to thank the CWRU for supplying the bearing experimental data. The authors also would like to thank the anonymous reviewers for the valuable comments and suggestions to improve the manuscript.
