Abstract
A set of single-exciter fatigue loading scheme driven by an unbalanced shaft was designed in order to perform the fatigue test for wind turbine blades. To analyze the vibration characteristic of blade, the modal tests were carried out firstly on aeroblade 2.0-45.3 wind turbine blade to acquire the low-order natural frequency 1st = 0.88 Hz and 2nd = 2.72 Hz in the minimum flapwise direction respectively. Then, the vibration mathematical model of fatigue loading equipment was deduced based on Lagrange equation, and the parameters affecting blade vibration rules were obtained. Next, the simulation model was built with Matlab/Simulink software, and vibration characteristics of the wind turbine blade under different loading frequencies were also obtained. When the loading frequency was 0.80 Hz, the amplitude of the loading point became disorder. When the loading frequency increased to 0.84 Hz continuously, the amplitude of the loading point was stable at around 400 mm. When the loading frequency was 0.88 Hz which was equal to the first-order natural frequency of the blade, the amplitude reached 1000 mm. At this time, resonance phenomenon occurred, which could cause fatigue damage to the blade greatly. When the loading frequency continued to increase to 0.92 Hz, the amplitude reduced to about 400 mm. Finally, a set of single-exciter fatigue loading system for the wind turbine blade was established, and test verification on the blade vibration characteristics was carried out. Test results were basically consistent with the simulation results, thus the validity of mathematical model and simulation model were verified. The above conclusions have important reference value for fatigue loading test of wind turbine blades.
1. Introduction
Wind energy is a renewable, non-polluting natural resource. Of all components of the wind turbine, blade is main component to receive wind energy. Because blade is subjected to alternating load over a long period of time, its reliable quality is a decisive factor to guarantee the normal and stable operation of the wind turbine. A large number of studies showed that fatigue failure is one of the main failure modes for wind turbine blades, and it seriously affected the reliability of wind turbine operation [1-4]. Fatigue loading test on wind turbine blades is the most reliable and effective way to determine the anti-fatigue performance of the blade before serving. Therefore, blade fatigue damage and its related fields have been hot spots in recently years [5].
Scholars domestic and foreign in this field mainly applied theoretical analysis and numerical simulation methods in their researches. White DL et al. [6] compared the fatigue damage of oriented load with that of tangential load in different phase angle conditions, and the effect of phase angle on the blade fatigue damage was obtained. Chen Xiao et al [7] studied wind turbine blade fatigue damage quantitatively using the finite element analysis method, and the basic law of fatigue damage was got according to the fatigue damage finite element model. Document [8] took 1.5 MW wind turbine blade as an example, studied the effect of environment temperature, humidity and other factors on the fatigue test process. However, the research on vibration characteristics of blade in fatigue test was seldom reported.
In this paper, firstly, the low-order natural frequency of the blade was obtained by modal tests, vibration characteristics mathematical model of the wind turbine blade was deduced, and factors affecting blade vibration rules were obtained. Then, the simulation model was built with Matlab/Simulink software, thus the relationship between blade amplitude and loading frequency was visibly obtained. Finally, the validity of mathematical model and simulation model was verified by on-site test, which laid the foundation for the successful accomplishment of the fatigue test for wind turbine blades.
1.1. Construction of fatigue loading scheme
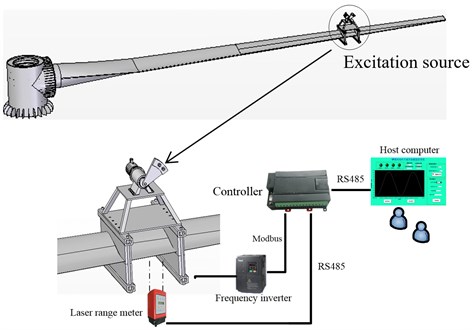
The blade root was fixed on the cylinder type loading bearing through a plurality of high strength bolts, and an excitation source was installed on the loading point at about 70 % along the blade spanwise. The excitation system was composed of an unbalanced shaft, motor, blade fixture, reduction gearbox and electronic control system. The control scheme was shown in Fig. 1.
Fig. 1Fatigue loading system structure
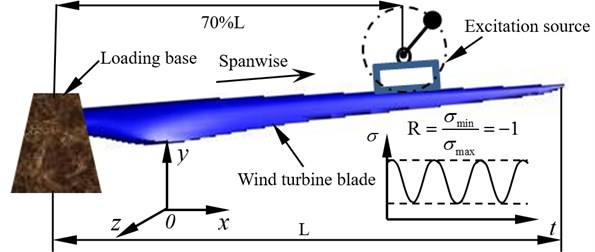
Fatigue loading process was based on the theoretical moment distribution curve and excitation times. The single-loading source applied alternating load on the blade in the blade oriented direction ( plane) or tangential direction ( plane). The test was performed under equal amplitude loading mode (stress ratio –1) and the equivalent excitation times. The loading scheme was shown in Fig. 2.
Fig. 2Wind turbine blade fatigue loading scheme
1.2. Acquisition of low-order natural frequency
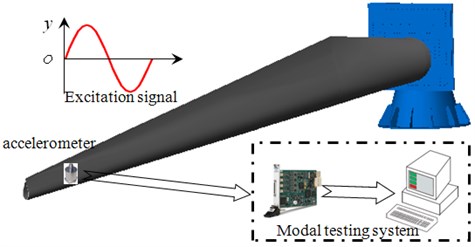
Low-order natural frequency of the blade was needed to measure before fatigue test. Firstly, the blade was mounted on the cylinder type test platform, then the acceleration sensor was fixed on the tip of the blade, finally the acceleration signal was collected by data acquisition instrument. The overall scheme was shown in Fig. 3.
Fig. 3Modal testing scheme
Taking the min flapwise direction of the blade as an example, the FFT transform is performed according to the time domain response curve measured by the acceleration sensor. The spectrum of the direction was shown in Fig. 4, and the experimental parameters were shown in Table 1.
Fig. 4Min flapwise frequency spectrum
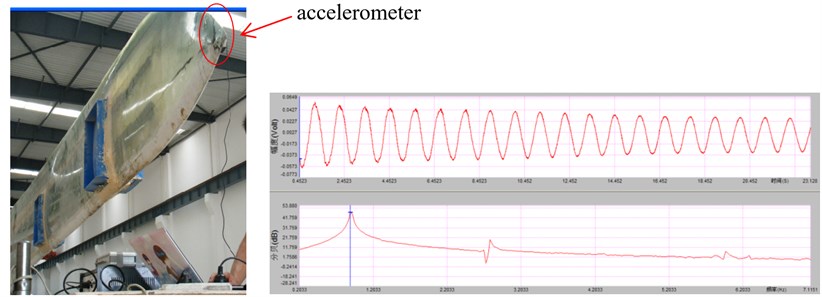
It could be obtained from Fig. 4 that the low-order natural frequency of the blade in min tangential direction were respectively: 1st 0.88 Hz, 2nd 2.64 Hz.
Table 1Modal test parameters
Parameter | Value (or Type) |
Length of the blade / m | 45.3 |
Power of the blade / MW | 2 |
Weight of the blade / kg | 8424 |
Modal testing system | DHDAS3817 |
Accelerometer | DH610 |
Temperature / °C | 10.7 |
Humidity/RH Test location | 45 indoor |
2. Vibrations mathematical model of wind turbine blade
2.1. Construction of mathematical model
According to loading scheme of wind turbine blades as shown in Fig. 1, in order to facilitate the subsequent modeling process, some assumptions were made as follows:
1) The blade is flexible elastomer, and the loading source is rigidly connected to the blade;
2) When the blade vibrates, air damping force and elastic force are proportional to the velocity and displacement of the blade respectively;
3) plane is in the blade tangential direction, and plane is in the blade oriented direction.
Three coordinate systems and five degrees of freedom were defined while modeling: translatory motion along the axis, axis, and axis and rotation around the axis, axis respectively. Dynamic model constructed was shown in Fig. 5.
Fig. 5Dynamic model of wind turbine blade fatigue loading system
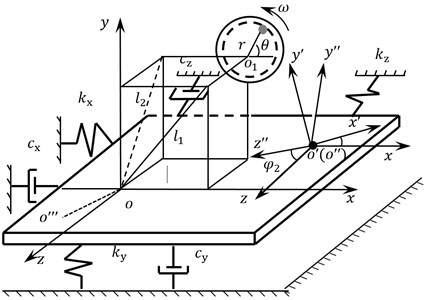
In Fig. 5, is the absolute coordinate system, and are the moving coordinate system, is the centroid of the whole vibration system (include the blade and the loading equipment), is the total weight of the blade. is the rotary center of the unbalanced shaft, is the weight of the unbalanced shaft, is the equivalent arm length of the unbalanced shaft, and are the rotary angle and angular velocity of the unbalanced shaft.
The system kinetic energy can be expressed as:
The system potential energy is:
External force of the system is:
where , , , and (1, 2) were regarded as generalized coordinates, then according to Lagrange equation [9], the dynamic equation of the fatigue loading system is established as follows:
where, is the projection of in the plane and is the projection of in the plane . is the included dangle of and the positive direction of -axis, is the included angle of and the positive direction of -axis, , , and are the stiffness coefficient of , , and direction,respectively., , and are the damping coefficient of , , and direction,respectively. is the rotational inertia of the system around axis and axis, is the rotational inertia of the asynchronous motor, is the electromagnetic torque of the shaft of the asynchronous motor.
From the Eq. (4), it could be inferred that parameters affecting the blade vibration characteristics were position of the loading point, quality of the unbalanced shaft, the initial phase and loading frequency, etc. The affecting laws of loading frequency on the blade vibration characteristic were mainly studied in this paper.
In the fatigue loading equipment, the unbalanced shaft was driven by a three-phase asynchronous motor. So the mathematical model of the three-phase asynchronous-motor was also needed to be built. However, the model of asynchronous motor in the case of three-phase was complicated, so in practice, the mathematical model based on two-phase synchronous rotating coordinate system was applied to represent the original model in system [10].
The coordinate transformation equation of three-phase asynchronous motor from system to system is expressed by:
The voltage equation of three-phase asynchronous motor based on system was expressed by:
The flux linkage equation of three-phase asynchronous motor based on system was expressed by:
The electromagnetic torque and the load torque equation were expressed by:
where, and are the terminal currents of the stator in system, and are the terminal voltages of the rotor in system. is the angular velocity of the rotor, and are the flux linkage of the stator in system, and are the flux linkage of the rotor in system, and are the self-inductance of the stator and rotor winding resistance, is the mutual-inductance of the stator and rotor winding, is the load torque, is the number of pole pairs, is the differential operator.
Eqs. (1)-(8) constituted the electromechanical coupling mathematical model of fatigue loading system of wind turbine blades. This mathematical model was a non-ideal space coupling model and described the space coupling effect between the power system and vibration system during the loading process. It could be seen that the factors affecting the vibration coupling were the rotary driving speed of the motor, the initial phase of the unbalanced shaft and the mechanical properties of asynchronous motor, etc.
2.2. Numerical simulation
The vibration simulation model of the blade was established using the mathematical model derived before with the Matlab/Simulink software. The vibration characteristics in vertical direction of wind turbine blades was equivalent to elastic support unbalance rotor driving system. The simulation parameters were: 8424 kg, 380 kg, 74700 N/m, 1.0, 9.5 m, 0.65 m, 3.2 m, 1.4 m, 3.6°, 20°, 56°, and the first-order natural frequency of the blade in min tangential direction was 0.88 Hz. The loading frequencies were 0.80 Hz, 0.84 Hz, 0.88 Hz, 0.92 Hz respectively. The simulation results were shown in Fig. 6.
Fig. 6Amplitude variable simulation curve
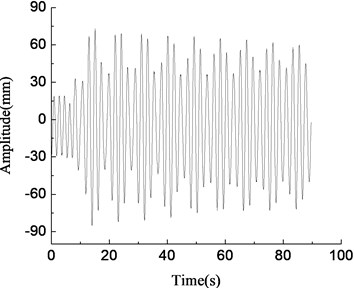
a)0.80 Hz, amplitude variable simulation curve
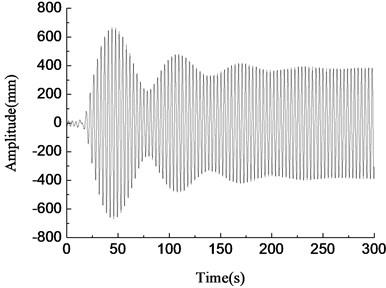
b)0.84 Hz, amplitude variable simulation curve
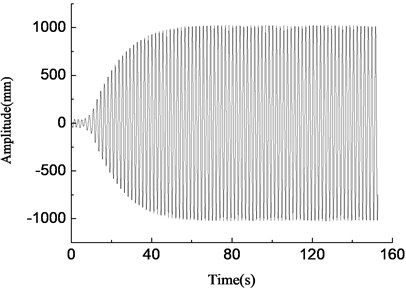
c)0.88 Hz, amplitude variable simulation curve
d)0.92 Hz, amplitude variable simulation curve
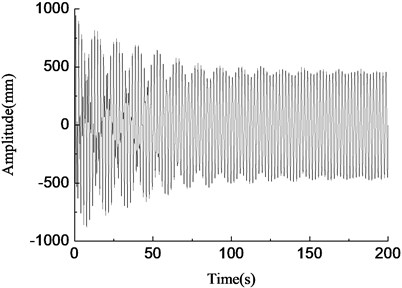
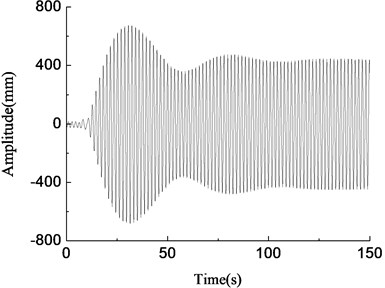
In Fig. 6(c), when the loading frequency was 0.88 Hz which was equal to the first-order natural frequency of the blade, the blade amplitude of the loading point increased steadily, at about 1000 mm, and the resonance phenomenon occurred at this time. When the loading frequency was 0.80 Hz which was less than the natural frequency of the blade and the deviation was large, blade amplitude was smaller and fluctuated irregularly, as shown in Fig. 6(a). When the loading frequency was 0.84 Hz which was slightly less than the first-order frequency of the blade, the blade amplitude gradually stabilized after the initial fluctuations, at about 400 mm, and the frequency capture phenomenon happened at this time, as shown in Fig. 6(b). When the loading frequency was 0.92 Hz which was greater than the first-order natural frequency of the blade, blade amplitude fluctuated largely, and amplitude became smaller and tended to be stable eventually, as shown in Fig. 6(d). According to the above analysis, the loading frequency should be consistent with the first-order natural frequency of the blade when fatigue loading tests were carried out.
3. Experimental verification
3.1. Construction of test platform
In order to verify the correctness of the theoretical analysis and simulation results, single-exciter fatigue loading test was carried out using the blade, and the test site was shown in Fig. 7. Variation laws of blade amplitude under different loading frequencies were obtained by controlling the output frequency of the inverter. The amplitude of the loading point was collected using laser range finder (ADSL-30), and the test parameters were shown in Table 2.
Fig. 7Wind turbine blade fatigue loading test
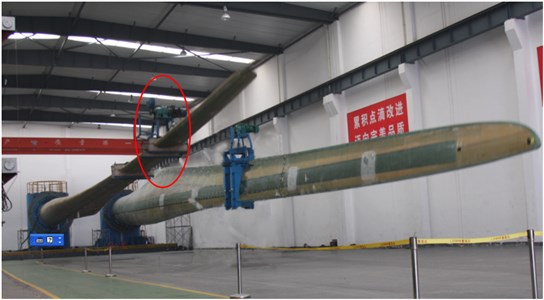
Table 2Test parameters
Name | Parameter |
Stiffness of blade (N/m) | 61660 |
Natural frequency (Hz) | 0.92 |
Weight of the unbalanced shaft (kg) | 380 |
Equivalent arm length of the unbalanced shaft (m) | 1.0 |
Power of motor (kW) | 25 |
Temperature (°C) | 20 |
Humidity (RH) | 50 |
3.2. Analysis of test results
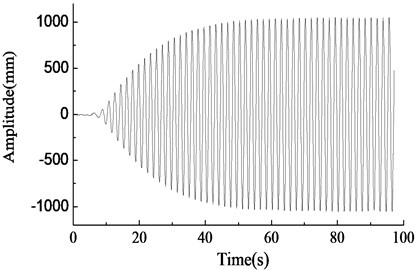
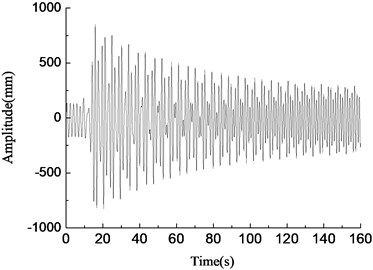
With the same test parameters, the loading frequencies were set as follows: 0.80 Hz, 0.84 Hz, 0.88 Hz, 0.92 Hz, and amplitude variable test curves of the loading point for the aeroblade 2.0-45.3 wind turbine blade were obtained. The test results were shown in Fig. 8.
In Fig. 8, the blade was in the resonance state when the rotary driving frequency of the unbalanced shaft was equal to the natural frequency of the blade, as shown in Fig. 8(d). At this time, the vibration amplitude of the blade increased gradually, the energy accumulated until the amplitude became stable, and the maximum amplitude was about 1000 mm. When the rotary driving frequency of the unbalanced shaft deviated slightly from the natural frequency of the blade, the blade vibration amplitude increased firstly and then decreased, and eventually tended to be stable, the amplitude was smaller, which was basically consistent with the simulation results, as shown in Fig. 8(c) and (e). When the rotary driving frequency of the eccentric mass block differed from the natural frequency of the blade largely, the vibration amplitude of the blade fluctuated largely, the larger the rotary driving frequency departed from the blade natural frequency, the smaller the blade amplitude was, and test results were shown in Fig. 8(a), (b) and (f). The above test results were basically consistent with the simulation results.
Fig. 8Blade amplitude variable test curve
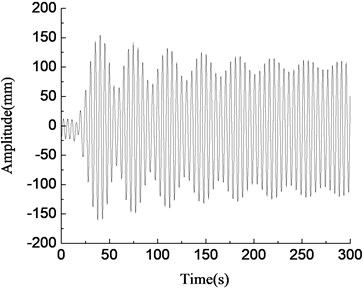
a)0.80 Hz, amplitude variable test curve
b)0.84 Hz, amplitude variable test curve
c)0.88 Hz, amplitude variable test curve
d)0.92 Hz, amplitude variable test curve
Fig. 9Relationship of blade amplitude with frequency ratio
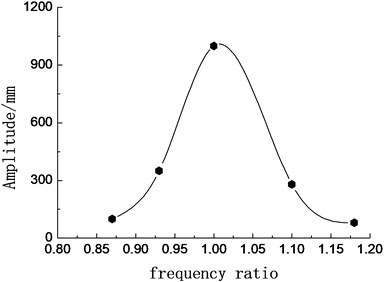
Frequency ratio is defined as: the ratio of the loading frequency and the natural frequency of the blade. Fitting the test data, the relationship curve between the frequency ratio and blade amplitude was obtained, as shown in Fig. 9. When the frequency ratio was equal to 1, the amplitude of the blade was largest. When the frequency ratio 1 or 1, the amplitude of the blade attenuated seriously.
4. Conclusions
The vibration characteristics of wind turbine blades in fatigue test were studied in this paper, and the conclusions could be drawn as follows:
1) A series of parameters affecting vibration characteristics of the blade were obtained by constructing the vibration characteristics mathematical model of wind turbine blades in fatigue test, such as position of the loading point, quality of the unbalanced shaft, eccentricity, the initial phase and the driving frequency, etc.
2) The simulation model was built using Matlab/Simulink software; under different loading frequencies, the vibration curves of the blade whose natural frequency is 0.88 Hz were obtained. The on-site test results showed that when the loading frequency increased from 0.80 Hz to 0.88 Hz gradually, the blade amplitude of the loading point was disorder firstly and then stabilized gradually, and the amplitude of the steady state was smaller. When the loading frequency was 0.88 Hz, the amplitude of the blade was the largest and stable, at this time the fatigue damage on the blade was the largest. When the loading frequency continued to increase, the amplitude of the blade decreased inversely. Therefore, the loading frequency should be the same as the first-order natural frequency of the blade when the fatigue test of wind turbine blades was carried out. At this time, the blade amplitude of the steady state was the largest, the test period was the shortest, and the loading efficiency was the highest.
3) The corresponding relationship between the frequency ratio and the blade amplitude of the loading point was obtained through theoretical analysis, simulation and verified by on site test, which has important reference value for the fatigue test of large wind turbine blades.
References
-
Court R. S., Ridley S., Jones H., et al. Fatigue testing of wind turbine blades with computational verification. ICCM-17, Edinburgh, 2009.
-
Kong C., Bang J., Sugiyama Y. Structural investigation of composite wind turbine blade considering various load cases and fatigue life. Energy, Vol. 30, 2005, p. 2101-2114.
-
Jensen F. M., Falzon B. G., Ankersen J., et al. Structural testing and numerical simulation of a 34 m composite wind turbine blade. Composite Structures, Vol. 76, 2006, p. 52-61.
-
Liu Deshun, Dai Juchuan, Hu Yanping, et al. Status and development trends of modern large-scale wind turbines. China Mechanical Engineering, Vol. 24, Issue 1, 2013, p. 125-135.
-
Li Shuhu,Wang Danyong, Qin Zhenming, et al. Summary of property testing for composites wind turbine blade. Engineering Plastics Application, Vol. 38, Issue 9, 2010, p. 54-58.
-
White D., Musial W., Egbert S. Evaluation of the NEW B-REX fatigue testing system for multi-megawatt wind turbine blades. 43rd AIAA Aerospace Sciences Meeting and Exhibit, USA, Vol. 6, 2005, p. 10-13.
-
Xiao Chen, Wei Zhao, Xiao Lu Zhao, et al. Failure test and finite element simulation of a large wind turbine composite blade under static loading. Energy, Vol. 7, 2014, p. 2274-2297.
-
Han Qingkai, Yang Xiaoguang, Qin Zhaoye, et al. Effects of exciter parameters on self-synchronous vibration system. Journal of Northeastern University (Natural Science), Vol. 28, Issue 7, 2013, p. 1009-1013.
-
Lai Xin, Wu Jianzhong, Wang Weida, et al. Theoretical and experimental study on electromechanical coupling of joint pile-hammer system. Journal of Mechanical Engineering, Vol. 48, Issue 3, 2012, p. 108-114.
-
Li Lan, Yang Guanlu, Sun Xuezheng Mathematical model and steady state characteristics of brushless wire-wound asynchronous motor. Transactions of China Electro Technical Society, Vol. 16, Issue 5, 2001, p. 16-19.
About this article
This work is sponsored by National Natural Science Foundation of China (No. 51405275 and No. 51305243) and Shandong Provincial Natural Science Foundation (No. ZR2014EL027) and China Postdoctoral Science Foundation (2015M571840).
