Abstract
A piecewise nonlinear vibration isolator with high-static-low-dynamic-stiffness (HSLDS) is presented in this paper. This nonlinear vibration isolator is comprised of a vertical spring and two pre-compressed cam-roller-spring mechanisms used as the stiffness correctors. Firstly, the static analysis of the vibration isolator is analyzed. The primary resonance of the system under harmonic base excitation is derived by applying the averaging method and further verified by the direct numerical integration. The effect of base excitation amplitude and damping ratio on the resonance frequency is considered. The stability analysis of the primary resonance is also studied. Then, the frequency island phenomenon is found and confirmed by numerical method. The parameter analysis on the appearance of frequency island is also considered. Finally, the absolute displacement transmissibility of the vibration isolator is defined and compared with the conventional HSLDS vibration isolator and the equivalent linear one. The results show that it exhibits a wider frequency range of vibration isolation than the equivalent linear vibration isolator. When the base excitation amplitude takes a larger value, the unbounded response which occurs in the conventional HSLDS vibration isolator can also be avoided, then a better isolation performance can be achieved.
1. Introduction
Passive vibration isolators [1] have been widely used in engineering for vibration isolation. As is well known, a linear passive vibration isolator can provide effective vibration attenuation when the excitation frequency is larger than times of the natural frequency of the isolation system. In order to obtain a wider frequency range of vibration isolation, the stiffness of the linear vibration isolators has to be reduced to lower the natural frequency, which results in a large static displacement and low load bearing capacity. However, this dilemma can be avoided by using the nonlinear vibration isolators with HSLDS characteristic. The HSLDS vibration isolators can be designed to achieve a lower natural frequency for wider isolation range without sacrificing load bearing capacity. The HSLDS vibration isolators are usually comprised of vertical spring and negative stiffness mechanisms used to provide negative stiffness. After being loaded at the static equilibrium position, the positive stiffness is counteracted by the negative stiffness, leading to a small dynamic stiffness. The negative stiffness mechanisms are also called the stiffness correctors and there are a number of ways to achieve the HSLDS characteristic. Alabuzhev et al. [2] introduced a number of vibration protection systems with HSLDS property. Platus [3] proposed a HSLDS vibration isolator using the beam as stiffness corrector to enhance the low-frequency performance of vibration isolation. Ibrahim [1] summarized a detailed review of nonlinear passive vibration isolators. Carrella et al. [4, 5] studied the dynamic characteristics and isolation performance of a HSLDS vibration isolator using two inclined springs as stiffness corrector theoretically and experimentally. Le and Ahn [6] used two symmetric negative stiffness structures as stiffness correctors and applied the HSLDS vibration isolator in the vehicle seat. Carrella, Robertson, Zhou and Xu et al. [7-10] presented the HSLDS vibration isolators using electromagnetic or magnetic devices as stiffness correctors and investigated the dynamic characteristics comprehensively. Liu et al. [11, 12] built the HSLDS vibration isolator using Euler buckled beam as stiffness corrector and studied the nonlinear dynamic characteristics systematically.
These researches demonstrate that the HSLDS vibration isolators possess wide frequency band for vibration attenuation and achieve better isolation performance under small excitation amplitude [3-16]. Because of the existence of nonlinear stiffness, the isolation performance of the HSLDS vibration isolator becomes worse with the increase of excitation amplitude and eventually worse than the equivalent linear one. Moreover, the phenomenon of unbounded response subjected to base excitation would also occur when the damping ratio is small or the base excitation amplitude takes large values [11, 15]. However, these limitations can be eliminated by the piecewise nonlinear-linear vibration isolator using the cam-roller-spring mechanisms [2] as stiffness correctors as shown in Fig. 1. When the cam contacts with the roller, the negative stiffness mechanism works and the negative stiffness is provided by the pre-compressed spring. Thus, the positive stiffness is balanced by the negative stiffness and the HSLDS characteristic can be achieved at the static equilibrium position. If the cam detaches from the roller, the stiffness is only provided by the vertical spring. When the vibration isolator is subjected to the large excitation amplitude, the cam and roller undergo the contact and detachment repeatedly, resulting in a piecewise nonlinear-linear stiffness and restoring force. At the segment points, the restoring force would undergo the jump phenomenon or not based on the chosen structure parameters. Zhou [16] studied the dynamic characteristics of this similar HSLDS vibration isolator under the force excitation when the restoring force of the system experienced the jump. This jump phenomenon is adverse to the protected equipment. The works in this paper are based on the no-jump condition for the restoring force and reveal the phenomenon of frequency island of this vibration isolator under base excitation.
The stiffness of the HSLDS vibration isolator investigated in this paper is piecewise nonlinear-linear, indicating the system is strongly nonlinear. For the non-smooth stiffness system, the common perturbation methods, such as Lindstedt-Poincaré method and multiple scales method, cannot be directly used to obtain the analytical solution. The effective ways for obtaining the analytical solution of piecewise system include harmonic balance method (HBM) [17] or incremental harmonic balance method (IHBM) [18, 19], averaging method [20-24] and matching method [25, 26]. Choi et al. [17] investigated the nonlinear behavior and chaotic motions of a single-degree-of-freedom (SDOF) system with piecewise nonlinear stiffness based on HBM. Lau et al. [18] applied the incremental harmonic balance method (IHBM) in the piecewise linear vibration system, but the accuracy of the HBM and IHBM mainly depends on the number of harmonic terms, besides, these two methods are also time-consuming. Hu [20] studied the primary resonance of an oscillator with a pair of symmetric set-up elastic stops by using the averaging method. Narimani et al. [21] obtained the analytical solution in a closed form for a piecewise linear suspension system using the modified averaging method. The averaging method can offer a closed-form solution which is convenient for dynamic analysis and stability analysis. Hansen [26] obtained the analytical solution of the primary resonance of a piecewise nonlinear-linear oscillator using the matching method, but this method is complex and cannot obtain the closed-form solution. So the averaging method is used in this paper.
This paper is organized as follows. A simple model of the HSLDS vibration isolator is built and the static analysis is conducted in Section 2. In Section 3, the dynamical model is established as the description of equation. The primary resonance subjected to the base excitation is obtained analytically by using the averaging method and the stability analysis is also considered. In Section 4, the existence of the frequency island is confirmed and the parameter analysis on the appearance of island is considered. In Section 5, the absolute displacement transmissibility of the vibration isolator is defined and compared with the conventional HSLDS vibration isolator and the equivalent linear one. Some conclusions are drawn in Section 6.
2. Static analysis of the HSLDS vibration isolator
The schematic diagram of the HSLDS vibration isolator at the static equilibrium position is shown in Fig. 1. The lumped mass denotes the equipment to be protected from the base excitation. The positive stiffness element is the vertical spring with stiffness which is connected with the mass and base to bear the load. The cam-roller-spring mechanism is used to provide the negative stiffness and is comprised of a horizontal pre-compressed spring with stiffness and a contact pair of the cam and roller. The two ends of the horizontal spring are connected to the base and roller, respectively. The radiuses of the cam and roller are and . is the displacement of the mass from the static equilibrium position and the damping coefficient of the damper is . The excitation is harmonic base excitation , where is the amplitude and is the excitation frequency. When the vibration isolator works, the rollers roll on the cams back and forth, with the horizontal springs sliding in the horizontal direction and providing negative stiffness. The stiffness of the vibration isolator is piecewise nonlinear-linear or continuous depending on the base excitation amplitude.
Fig. 1Schematic diagram of the piecewise nonlinear-linear HSLDS vibration isolator with cam-roller-spring mechanisms
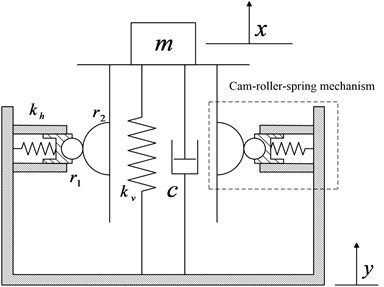
Fig. 2Schematic diagram of cam and roller in different states
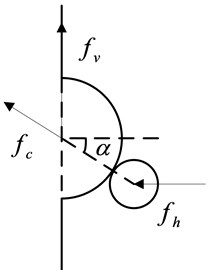
a) Contact state
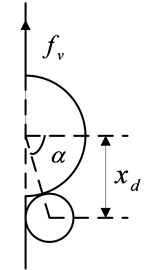
b) Critical state
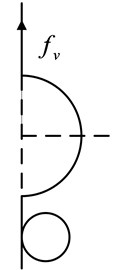
c) Detached state
The schematic diagram of the cam and roller in different states is depicted in Fig. 2. When the roller rolls on the cam, the displacement satisfies , where is the critical displacement. The restoring force of the isolation system is given as:
where and are the restoring force of vertical and horizontal springs, respectively, and is the angle between the horizontal direction and the center line of the cam and roller, the expressions in Eq. (1) can be obtained as:
where is the compression length of the vertical spring at the static equilibrium position, is the pre-compression length of the horizontal springs. Substituting Eq. (2a)-(2d) into Eq. (1), the restoring force can be written as:
When the roller detaches from the cam as shown in Fig. 2(c), the displacement satisfies and the mass is only supported by the vertical spring. Then the restoring force is determined by:
Writing Eq. (3) and Eq. (4) in a non-dimensional form yields:
where:
Fig. 3Non-dimensional force-displacement curves for different δ^ (x^d= 0.6, β= 0.7)
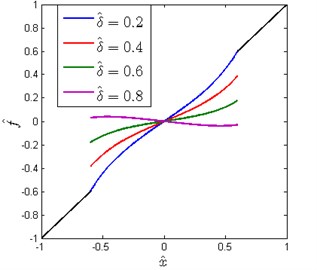
The non-dimensional force-displacement curves for different are shown in Fig. 3. It can be observed that the restoring force is piecewise nonlinear-linear and undergoes a finite jump at the points . Moreover, there exists a for which the jump phenomenon that occurred in restoring force can be avoided. can be determined by equating Eq. (5) at the segment point :
Obviously, is only determined by the critical displacement . The jump phenomenon is adverse to the protected equipment, so the subsequent work is mainly based on the no-jump condition for the restoring force.
The non-dimensional stiffness of the system can be obtained by differentiating the first expression of Eq. (5) with respect to :
The non-dimensional stiffness at the static equilibrium position can be obtained by substituting into Eq. (7):
If the stiffness of the HSLDS vibration isolator is zero at the static equilibrium position, then the quasi-zero-stiffness (QZS) characteristic can be obtained and the value of is given as:
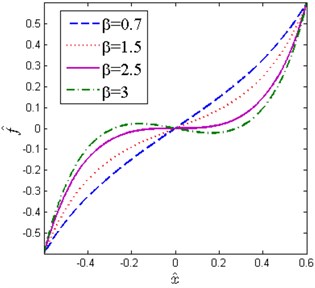
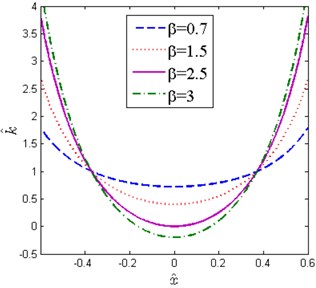
The non-dimensional force-displacement and stiffness-displacement curves for various with 0.2 are shown in Fig. 4. It can be clearly seen that the stiffness at the static equilibrium position decreases gradually with the increase of and becomes zero when (2.5). If , the stiffness is negative near the static equilibrium position, which cannot be used in practice because the system is unstable. Considering the existence of some inevitable errors in practice, the QZS characteristic is hard to achieve. To make sure a stable system, a small positive value should be kept for the stiffness of the system at the static equilibrium position, then a common HSLDS characteristic is obtained. The case is considered in this paper.
Fig. 4Non-dimensional force-displacement and stiffness-displacement curves for various β (x^d= 0.6, δ^= 0.2)
a)
b)
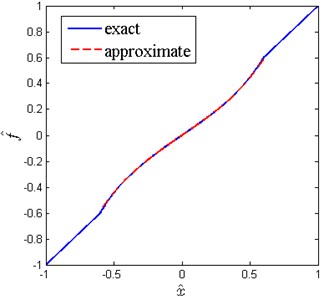
When the displacement amplitude is small, the first expression of Eq. (5) can be approximated by the five-order Taylor series expansion at the static equilibrium position for simplicity:
where , and .
The exact and approximate force-displacement curves are shown in Fig. 5. Obviously, the approximate restoring force matches very well with the exact one. It is reasonable and convenient to use the approximate restoring force for subsequent dynamical analysis.
Fig. 5Comparison of exact and approximate force-displacement curves (δ^= 0.2, x^d= 0.6, β= 0.7)
3. Primary resonance analysis
3.1. Frequency response
Considering the effect of linear viscous damping term, the exact equation of motion for the mass can be written as follows:
where , is the exact restoring force given by Eq. (3).
Introducing the following non-dimensional parameters:
The non-dimensional dynamical equation is obtained by substituting Eq. (12) into Eq. (11):
where is defined by Eq. (5). Eq. (13) can be approximated by the following non-dimensional dynamical equation:
where is defined by Eq. (10).
Introducing a dummy perturbation parameter [22], Eq. (14) can be written in a suitable form for the application of the averaging method:
Introducing , where is the detuning parameter, Eq. (15) can be written as:
where:
Assuming the approximate solution is , where and are the function of . Applying the averaging method, a set of autonomous differential equations that govern the time varying amplitude and phase can be obtained:
where .
If the response amplitude , substituting the first expression of Eq. (17) into Eq. (18) and Eq. (19), and integrating them in the interval [0, 2] obtains:
The steady state solutions occur when , 1. Substituting Eqs. (20) and (21) into Eqs. (18) and (19), respectively, the amplitude-frequency relationship and phase-frequency relationship in a form of implicit function can be obtained:
If the response amplitude , the function is piecewise, and the segment point satisfies . So the integrands change and should be integrated separately in the intervals , , , . The amplitude-frequency relationship and phase-frequency relationship can be obtained by the same procedure:
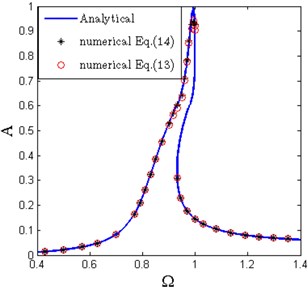
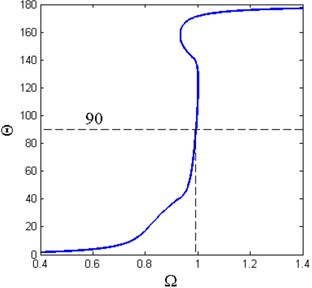
So the overall amplitude-frequency relationship and phase-frequency relationship of the system can be obtained by combining Eqs. (22), (23), (26) and (27). The amplitude-frequency and phase-frequency curves are shown in Fig. 6. The amplitude-frequency curve is composed of two parts. The upper curve is similar to a linear system, while the lower one corresponds to a hardening Duffing oscillator. The nonlinear phenomena, such as multiple solutions and the amplitude jump phenomena also can be observed in the amplitude-frequency curve. In Fig. 6(b), it can be clearly seen that the phase corresponding to the resonance frequency is very close to , which coincides with the linear vibration theory.
To verify the validity of the approximate analytical solution of the primary resonance, the fourth order Runge-Kutta scheme is used, and the fast Fourier transform (FFT) technique is utilized to obtain the basic harmonic component of the response. Fig. 6(a) shows the comparison of approximate analytical solution and numerical results of Eq. (13) and Eq. (14). It can be observed that the numerical results from two dynamic equations are nearly identical, which confirms the accuracy of the approximate dynamic equation. Besides, the approximate analytical solutions are in good agreement with theses two numerical results. It is worth noting that the numerical method can only obtain the stable response of the system, while the unstable numerical solution cannot be simulated.
Fig. 6Amplitude-frequency and phase-frequency curves of the primary resonance (ζ= 0.02, Y^= 0.04, x^d= 0.6, δ^= 0.2, β= 0.7)
a)
b)
To determine the critical base excitation amplitude at which the cam detaches from the roller, solving Eq. (22) for gives:
The peak amplitude can be determined by setting the inner radicand in Eq. (28) to zero, thus the following equation can be obtained:
The critical base excitation amplitude can be obtained by substituting into Eq. (29):
Fig. 7 shows the critical value of base excitation amplitude for various damping ratio. It can be seen that the relationship between and is nearly linear and the critical value increases for the general trend with the increase of damping ratio. When the base excitation amplitude exceeds the critical value , the cam and the roller would undergo the contact and detachment repeatedly, and the stiffness could be piecewise nonlinear-linear.
Fig. 7Critical value of base excitation amplitude for various damping ratio (x^d= 0.6, δ^= 0.2, β= 0.7)
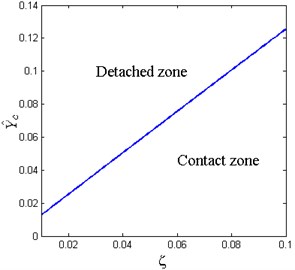
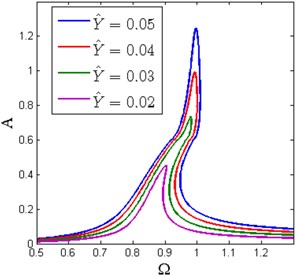
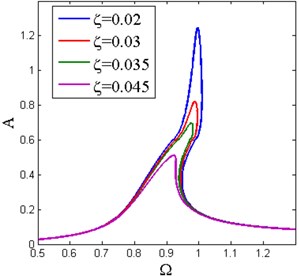
Fig. 8 shows the amplitude-frequency curves under different base excitation amplitude and damping ratio, respectively. It can be observed that the lower branches of amplitude-frequency curves bend to the right induced by the nonlinear stiffness. The amplitude increases in the whole frequency band and the resonance frequency shifts towards the higher frequency region with the increase of base excitation amplitude. The response is continuous when the excitation amplitude is less than the critical value , which corresponds to the conventional HSLDS vibration isolator. The conventional HSLDS vibration isolator here indicates that the radius of the cam is large enough than the roller, so the cam and roller keep the contact state all the time and would never detach. The response becomes piecewise when the base excitation amplitude exceeds the critical value.
When the damping ratio increases, the response amplitude near the resonance frequency decreases. The effect of damping ratio on the resonance frequency is similar to that of the base excitation amplitude. The resonance frequency varies slowly when the damping ratio is small.
Fig. 8Amplitude-frequency curves under different a) base excitation amplitude with ζ= 0.02 and b) damping ratio with Y^= 0.05 (x^d= 0.6, δ^= 0.2, β= 0.7)
a)
b)
Solving Eq. (29) numerically obtains the peak amplitude , thus the resonance frequency can be obtained by substituting into Eq. (28):
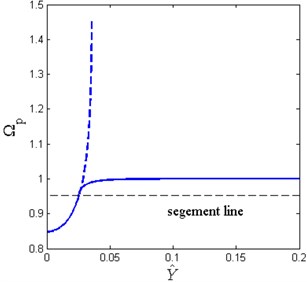
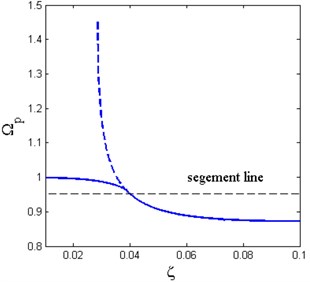
The effect of the base excitation amplitude and damping ratio on the resonance frequency is shown in Fig. 9. The solid line denotes the piecewise nonlinear-linear HSLDS vibration isolator, and the dashed line denotes the conventional HSLDS vibration isolator. When the base excitation amplitude takes small values, the resonance frequency of the piecewise nonlinear-linear HSLDS vibration isolator increases rapidly with the increase of base excitation amplitude. When the excitation amplitude exceeds the critical value, the slope of the curve becomes smaller and tends to zero, and the resonance frequency also tends to one. When the damping ratio is very small, the resonance frequency is close to one and would never exceed it. The resonance frequency decreases gradually with the increase of damping ratio.
Fig. 9The resonance frequency under different a) base excitation amplitude with ζ= 0.02; b) damping ratio with Y^= 0.05 ( x^d= 0.6, δ^= 0.2, β= 0.7)
a)
b)
From these two figures, the resonance frequency of the piecewise nonlinear-linear HSLDS vibration isolator would never exceed one, though the excitation amplitude takes a large value or the damping ratio is very small, which is superior than the conventional HSLDS vibration isolator. The resonance frequency of the conventional HSLDS vibration isolator may tend to infinite under a large excitation amplitude or a small damping ratio, which can be observed in these two figures. The infinite resonance frequency means an unbounded response which must be avoided in vibration attenuation.
3.2. Stability analysis
To analyze the stability of the primary resonance of the system, the unstable boundaries are obtained by differentiating Eq. (22) and Eq. (26) with respect to :
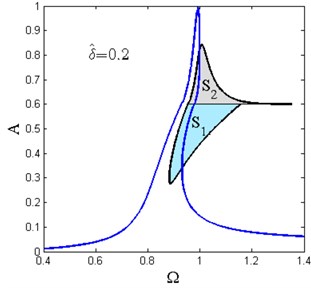
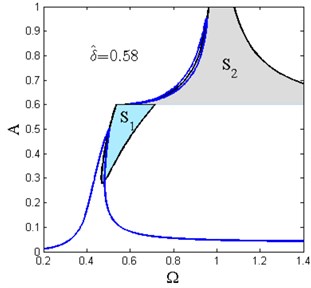
The stability diagrams of the primary resonance with various spring pre-compression length are shown in Fig. 10. The green shaded zone denoted by is determined by Eq. (32) and the gray shaded zone denoted by is determined by Eq. (33). The approximate analytical solution that lies in and is unstable which cannot be observed by the numerical method. Another feature should be addressed here is that the lower branch of the frequency island is unstable as shown in Fig. 10(b).
Fig. 10Stability diagrams of primary resonance for various δ^ (Y^= 0.04, ζ= 0.02, x^d= 0.6, β= 0.7)
a)
b)
4. Frequency island and parameter analysis
4.1. Frequency island
The frequency island is also an interesting nonlinear phenomenon for the piecewise nonlinear-linear HSLDS vibration isolator which occurs for a certain range of system parameters. The frequency island is an isolated and closed region which emerges above the main resonance branch. On the frequency island, the performance becomes worse and the vibration is amplified rather than suppressed. So it is dangerous in practice and should be prevented.
If there are more than one roots for of Eq. (26), the frequency island may occur. Solving the quadratic Eq. (26) for gives:
Let , the extreme value can be obtained:
Simplifying Eq. (35) gives:
Eq. (36) is a quartic equation for . If Eq. (36) has more than one roots for , the frequency island may occur. Rewriting Eq. (36) and defining a implicit function gives:
Let and be the control parameters, the relationship between and horizontal spring pre-compression length can be obtained as Fig. 11 shows. It can be seen that the curve is divided into three regions by two dashed lines named and , respectively. The left region which has only one stands for the common nonlinear frequency response. The middle region with two indicates the occurrence of the frequency island. In the right region, although it has two , the stiffness of the system near the static equilibrium position is negative, which means the system is unstable and cannot be used in practice. The value of for is . It can be observed that the frequency island region diminishes as increases. There exists a lower safe value for , for which the frequency island would not occur.
Fig. 11Extreme values Am of the response amplitude as the function of spring pre-compression length δ^ (Y^= 0.04, ζ= 0.02, β= 0.7, x^d=0.6)
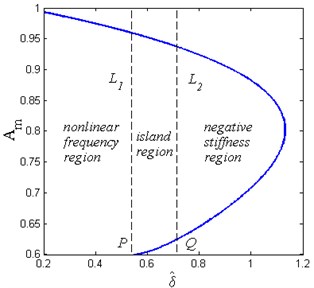
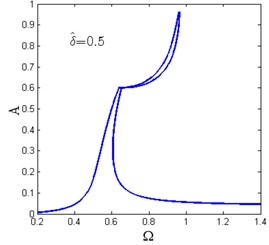
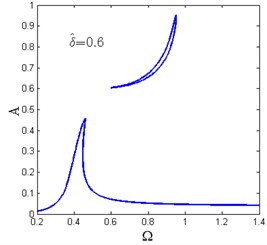
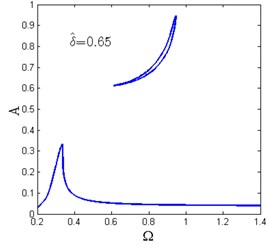
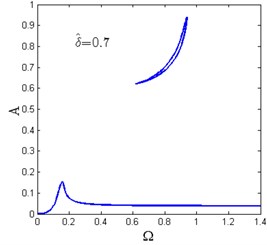
Fig. 12Amplitude-frequency curves for various horizontal spring pre-compression length δ^ (Y^= 0.04, ζ= 0.02, β= 0.7, x^d= 0.6)
a)
b)
c)
d)
e)
f)
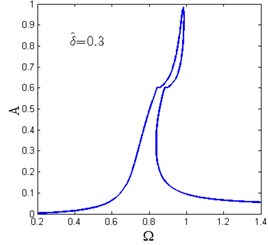
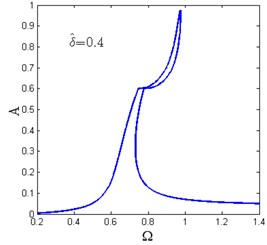
Fig. 12 shows the amplitude-frequency curves for various horizontal spring pre-compression length . For each value of , there exists only one as shown in Fig. 12(a)-(c). When increases, the amplitude-frequency curves tend to be separated into two zones and the frequency island comes to be formed. The maximum amplitude of the response also decreases.
When , there are two and the amplitude-frequency curves consist of two dependent regions. The lower region is the main resonance branch, while the upper one is the frequency island as shown in Fig. 12(d)-(f). It can be observed that with the increase of , the maximum amplitude of the main resonance branch and the peak value of the frequency island are getting lower while the valley value becomes larger. In the frequency island band, the system follows the main resonance branch or the frequency island region depending on the initial conditions.
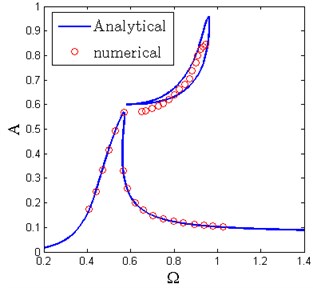
The numerical method is used to verify the existence of the frequency island. The comparison result is shown in Fig. 13. It can be seen that the analytical method gives well results compared with the numerical results, which means the frequency island can be well predicted by the analytical solution. Moreover, the numerical solution cannot track the whole island, because the lower branch of the island is unstable which has been verified in Fig. 10(b).
Fig. 13Prediction of frequency island between analytical solution and numerical solution (δ^= 0.55, Y^= 0.08, ζ= 0.04, β= 0.7, x^d= 0.6)
4.2. Parameter analysis
The frequency island is harmful to the protected structures or equipments because the vibration is amplified rather than suppressed. It is necessary to study the effect of parameters on the appearance of frequency island and the parameters conditions should be determined to eliminate it. Assuming the spring pre-compression length as the control parameter and investigating the effect of other parameters on the appearance of frequency island.
Fig. 14The effect of the damping ratio on the appearance of the frequency island (Y^= 0.04, β= 0.7, x^d= 0.6)
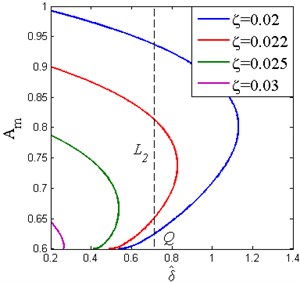
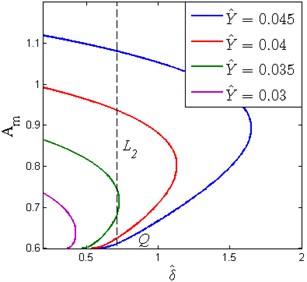
Fig. 15The effect of the base excitation level on the appearance of the frequency island (ζ= 0.02, β= 0.7, x^d= 0.6)
The effect of the damping ratio on the appearance of frequency island is shown in Fig. 14. The black dashed line denotes the boundary mentioned in Fig. 11, which divides the curves into two parts. It can be observed that increasing reduces the peak value of and the domain of the frequency island. Moreover, there is a lower safe value for mentioned in Fig. 11, for which the frequency island would not occur. Besides, the value also decreases with the increase of damping ratio.
The appearance of the frequency island under different base excitation amplitude is similar to that of the damping ratio as shown in Fig. 15. It can be seen that increasing results in the increase of the peak value of and the domain of frequency island. The safe value also decreases with the decrease of base excitation amplitude.
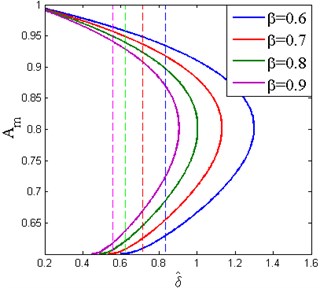
The effect of stiffness ratio on the appearance of the frequency island is shown in Fig. 16. It can be observed that increasing reduces the distance between the two extreme values of and the domain of frequency island. The band of frequency island for also becomes smaller. The dashed lines denote the boundary , which shift to the left with the increase of stiffness ratio. Besides, the safe value P shifts a little to the left.
Fig. 16The effect of the stiffness ratio on the appearance of the frequency island (Y^= 0.04, ζ= 0.02, x^d= 0.6)
5. Displacement transmissibility
The displacement transmissibility is used to evaluate the performance of the isolation system. It is defined as the ratio between the displacement transmitted to the mass and that of the base. The absolute displacement transmitted to the mass can be expressed as:
The absolute displacement amplitude is given by:
So the absolute displacement transmissibility is defined as:
where and is defined as the relative displacement transmissibility. The value of can be obtained by letting Eq. (19) be zero:
It is necessary to compare the transmissibility of the vibration isolator with the equivalent linear one with the same load bearing capacity. The absolute displacement transmissibility of the linear vibration isolator is defined as:
Another feature should be addressed here is that the absolute displacement transmissibility of the isolation system is also piecewise corresponding to the primary resonance. Fig. 17 shows the absolute displacement transmissibility curves of the piecewise nonlinear-linear HSLDS vibration isolator and equivalent linear one under different base excitation amplitude. It can be observed that the trend is similar to the primary resonance mentioned in Fig. 8(a). The performance of the piecewise nonlinear-linear HSLDS vibration isolator is better than the equivalent linear one when the base excitation amplitude takes small values, because it offers a wider frequency band for vibration isolation. The isolation performance becomes worse when the base excitation amplitude increases. However, it cannot be worse than the equivalent linear vibration isolator though the base excitation amplitude takes large values.
Fig. 17Absolute displacement transmissibility of piecewise nonlinear-linear HSLDS vibration isolator and equivalent linear one under different base excitation amplitude (ζ= 0.02, x^d= 0.6, δ^= 0.2, β= 0.7)
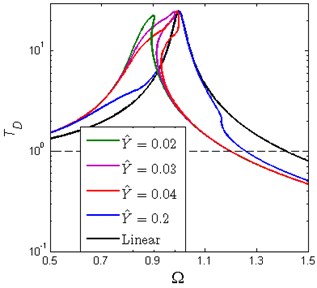
Fig. 18Absolute displacement transmissibility of piecewise nonlinear-linear HSLDS vibration isolator for various damping ratio (Y^= 0.05, x^d= 0.6, δ^= 0.2, β= 0.7)
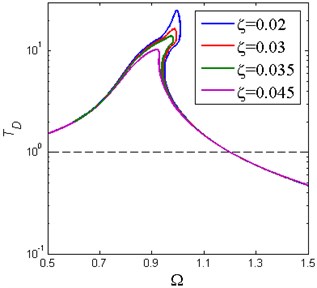
Fig. 18 shows the absolute displacement transmissibility curves of the vibration isolator for various damping ratio and the result is similar to Fig. 8(b). The amplitude of transmissibility near the resonance frequency decreases with the increase of damping ratio and the amplitude in the high frequency region varies little due to the small damping ratio.
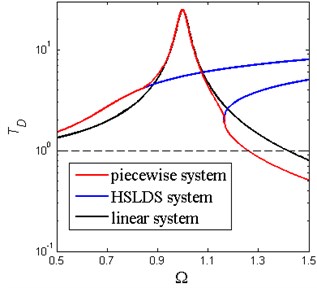
As is mentioned before, the isolation system is piecewise nonlinear-linear, in other words, the frequency response can be comprised of conventional HSLDS nonlinear system and linear system. As is well known that the HSLDS vibration isolator exhibits better vibration isolation performance than the equivalent linear one when the excitation amplitude takes small values, but becomes worse when the excitation amplitude increases. Fig. 19 shows the performance comparison among three kinds of vibration isolators under a large base excitation amplitude. It can be seen that the transmissibility curve of the conventional HSLDS vibration isolator distorts extremely to the right and the system has multiple solutions in high frequency region. Besides, the absolute displacement transmissibility of the vibration isolator is unbounded which is undesirable in practice. If the base excitation amplitude increases to a larger level, the performance of the conventional HSLDS vibration isolator can be inferior to the linear one. However, there is no such problem for the piecewise nonlinear-linear HSLDS vibration isolator. Although its isolation performance becomes worse when the excitation amplitude increases, it still possesses almost the same isolation performance as the linear vibration isolator. In general, the piecewise nonlinear-linear HSLDS vibration isolator can achieve a better isolation performance than the conventional HSLDS vibration isolator and the linear one.
Fig. 19Absolute displacement transmissibility of three vibration isolators under large base excitation amplitude (Y^= 0.2, ζ= 0.02, δ^= 0.2, β= 0.7)
6. Conclusions
A HSLDS vibration isolator comprised of vertical spring and cam-roller-spring mechanisms is presented in this paper. The static analysis result shows that the stiffness of the isolation system is piecewise nonlinear-linear and discontinuous. The primary resonance subjected to the base excitation is derived analytically by using the averaging method and further verified by the numerical method. The effect of base excitation amplitude and damping ratio on the resonance frequency indicates that the vibration isolator can effectively suppress the appearance of the unbounded response which may occur in the conventional HSLDS vibration isolator.
Then, the nonlinear phenomenon of frequency island is found and confirmed by numerical simulation. The appearance of frequency island is mainly influenced by system parameters and base excitation amplitude. The effect of horizontal spring pre-compression length on the frequency response shows there is a lower safe value for , for which the frequency island would not occur. Increasing the damping ratio and selecting a lower horizontal spring pre-compression length are effective ways to eliminate the frequency island.
The absolute displacement transmissibility of the piecewise nonlinear-linear HSLDS vibration isolator is compared with the conventional HSLDS vibration isolator and equivalent linear one. The result shows that it possesses better performance in vibration isolation than the equivalent linear vibration isolator under small base excitation amplitudes. It can also avoid the worse performance occurred in the conventional HSLDS vibration isolator when the base excitation amplitude takes large values.
References
-
Ibrahim R. A. Recent advances in nonlinear passive vibration isolators. Journal of Sound and Vibration, Vol. 314, Issue 3, 2008, p. 371-452.
-
Alabuzhev P., Gritchin A., Kim L., Migirenko G., Chon V., Stepanov P. Vibration Protecting and Measuring Systems with Quasi-Zero Stiffness. Hemisphere Publishing, New York, 1989.
-
Platus D. L. Negative-stiffness-mechanism vibration isolation systems. Proceedings of SPIE, Vol. 3786, 1999, p. 98-105.
-
Carrella A., Brennan M. J., Waters T. P. Static analysis of a passive vibration isolation with quasi zero-stiffness characteristic. Journal of Sound and Vibration, Vol. 301, Issue 3, 2007, p. 678-689.
-
Carrella A., Brennan M. J., Waters T. P., V. Lopes Jr. Force and displacement transmissibility of a nonlinear isolator with high-static-low-dynamic-stiffness. International Journal of Mechanical Sciences, Vol. 55, Issue 1, 2012, p. 22-29.
-
Le T. D., Ahn K. K. A vibration isolation system in low frequency excitation region using negative stiffness structure for vehicle seat. Journal of Sound and Vibration, Vol. 330, Issue 26, 2011, p. 6311-6335.
-
Carrella A., Brennan M. J., Waters T. P., Shin K. On the design of a high-static-low-dynamic stiffness isolator using linear mechanical springs and magnets. Journal of Sound and Vibration, Vol. 315, Issue 3, 2008, p. 712-720.
-
Robertson W. S., Kidner M. R. F., Cazzolato B. S., Zander A. C. Theoretical design parameters for a quasi-zero stiffness magnetic spring for vibration isolation. Journal of Sound and Vibration, Vol. 326, Issues 1-2, 2009, p. 88-103.
-
Zhou N., Liu K. A tunable high-static low-dynamic stiffness vibration isolator. Journal of Sound and Vibration, Vol. 329, Issue 9, 2010, p. 1254-1273.
-
Xu D. L., Yu Q. P., Zhou J. X., Bishop S. R. Theoretical and experimental analyses of a nonlinear magnetic vibration isolator with quasi-zero-stiffness characteristic. Journal of Sound and Vibration, Vol. 332, Issue 14, 2013, p. 3377-3389.
-
Liu X., Huang X., Hua H. On the characteristics of a quasi-zero stiffness isolator using Euler buckled beam as negative stiffness corrector. Journal of Sound and Vibration, Vol. 332, Issue 14, 2013, p. 3359-3376.
-
Huang X. C., Liu X. T., Sun J. Y., Zhang Z. Y., Hua H. X. Effect of the system imperfections on the dynamic response of a high-static-low-dynamic stiffness vibration isolator. Nonlinear Dynamics, Vol. 76, Issue 2, 2014, p. 1157-1167.
-
Wang Y., Li S. M., Li J. Y., Jiang X. X., Cheng C. Response and performance of a nonlinear vibration isolator with high-static-low-dynamic-stiffness under shock excitations. Journal of Vibroengineering, Vol. 16, Issue 7, 2014, p. 3382-3398.
-
Wang Y., Li S. M., Cheng C., Jiang X. X. Dynamic analysis of a high-static-low-dynamic-stiffness vibration isolator with time-delayed feedback control. Shock and Vibration, 2015.
-
Shaw A. D., Neild S. A., Wagg D. J. Dynamic analysis of high static low dynamic stiffness vibration isolation mounts. Journal of Sound and Vibration, Vol. 332, Issue 6, 2013, p. 1437-1455.
-
Zhou J. X., Wang X. L., Xu D. L., Bishop S. R. Nonlinear dynamic characteristics of a quasi-zero stiffness vibration isolator with cam-roller-spring mechanisms. Journal of Sound and Vibration, Vol. 346, 2015, p. 53-69.
-
Choi H. S., Lou J. Y. K. Nonlinear behavior and chaotic motions of an SDOF system with piecewise non-linear stiffness. International Journal of Non-Linear Mechanics, Vol. 26, Issue 5, 1991, p. 461-473.
-
Lau S. L., Zhang W.-S. Nonlinear vibrations of piecewise linear systems by incremental harmonic balance method. Journal of Applied Mechanics, Vol. 59, Issue 1, 1992, p. 153-163.
-
Xu L., Lu M. W., Cao Q. Nonlinear vibrations of dynamical systems with a general form of piecewise-linear viscous damping by incremental harmonic balance method. Physics Letters A, Vol. 301, Issues 1-2, 2002, p. 65-73.
-
Hu H. Y. Primary resonance of a harmonically forced oscillator with a pair of symmetric set-up elastic stops. Journal of Sound and Vibration, Vol. 207, Issue 3, 1997, p. 393-401.
-
Narimani A., Golnaraghi M. E., Jazar G. N. Frequency response of a piecewise linear vibration isolator. Journal of Vibration and Control, Vol. 10, Issue 12, 2004, p. 1775-1794.
-
Narimani A., Golnaraghi M. F., Jazar G. N. Sensitivity analysis of the frequency response of a piecewise linear system in a frequency island. Journal of Vibration and Control, Vol. 10, Issue 2, 2004, p. 175-198.
-
Jazar G. N., Mahinfalah M., Deshpande S. Design of a piecewise linear vibration isolator for jump avoidance. Journal of Multi-body Dynamics. Vol. 221, Issue 3, 2007, p. 441-449.
-
Cui D. F., Hu H. Y. Primary resonance of lateral vibration of a heated beam with an axial stick-slip-stop boundary. Journal of Sound and Vibration, Vol. 339, 2015, p. 230-246.
-
Natsiavas S. On the dynamics of oscillators with bi-linear damping and stiffness. International Journal of Non-Linear Mechanics, Vol. 25, Issue 5, 1990, p. 535-554.
-
Ji J. C., Hansen C. H. Analytical approximation of the primary resonance response of a periodically excited piecewise non-linear-linear oscillator. Journal of Sound and Vibration, Vol. 278, Issues 1-2, 2004, p. 327-342.
About this article
This work was supported by Funding of Jiangsu Innovation Program for Graduate Education (Grant number KYLX_0243) and the Fundamental Research Funds for the Central Universities.
