Abstract
In view of the damages to shield tunnels in recent strong earthquakes, this paper focuses on the effect of longitudinal joints on the seismic response of the shield tunnel in liquefiable soils. First, the normal and shear behaviors of high-strength concrete interface at the joint were studied through direct shear tests under monotonic and cyclic loadings. The results show that the flatness rather than the roughness is the dominant factor influencing the behavior of the interface. As the confining stress and cyclic number increase, the total contact area increases, thus resulting in the increases of the normal stiffness and the friction coefficient. Based on the testing results, the seismic response of a shield tunnel in liquefiable soils was studied using numerical analysis. According to the results, the longitudinal joints have a significant effect on the seismic response of the shield tunnel. When neglecting the joints, the tensile stresses in concrete, the tunnel uplift and the surface deformation remarkably decrease, and the shield tunnel becomes less vulnerable to earthquakes. Due to the soil liquefaction, the joints located near the waist are more likely to get opened and corresponding bolts bear large tensile forces, which are the main reasons for the common damages to shield tunnels. Based on this experimental and numerical study, the effect of the joints and the seismic damages of the large shield tunnel are better understood, consisting an important step in the development of appropriate specifications for the seismic design of the large shield tunnel.
1. Introduction
With the development and utilization of urban underground space, cross-river shield tunnels are critical elements in transportation and utility networks. However, saturated silty sand deposits usually wide distributed in the riverbed, and they tend to liquefy under dynamic excitation. The soil liquefaction caused severe damages to tunnels during past earthquakes such as the Niigata Earthquake (Japan, 1964) [1], the Tangshan Earthquake (China, 1976) [2], the Kushiro-Oki Earthquake (Japan, 1993) [3], the Kobe Earthquake (Japan, 1995) [4] and the 2011 off the Pacific Coast of Tohoku Earthquake (Japan, 2011) [5]. Therefore, many centrifuge tests and shaking table tests [6-9] have been conducted to study the seismic response of underground structures in liquefiable soils. The effects of the ground motion [10, 11], the structures [12], and the properties of liquefiable soils [13-15] on the seismic performance of underground structures were also evaluated. However, most of these studies mainly focus on the structures without joins (such as: the subway station, RC structures, and Bored tunnels). For the shield tunnel, the load carrying capacity is greatly dependent on the values of joint stiffness [16], and the stress distribution is also strongly influenced by the number of joints [17, 18]. Seismic damages to shield tunnels in past earthquakes reveal that segment staggering, bolts breaking and water leakage are the main damage forms. They are mainly due to the opening and sliding of the concrete-concrete interface at the joints. Due to the joints, the shield tunnel is more vulnerable to liquefaction induced damages than other underground structures. In spite of the importance of joints, little related studies have been conducted due to the complex modeling and time-consuming computation. Most related studies have not considered the joints but assumed the tunnel lining as continuous medium. Consequently, the seismic damages of the shield tunnel cannot be evaluated, and this assumption may lead to gross mistakes for large-scale shield tunnels with more joints in liquefiable soils.
The main objective of this study is to investigate the effect of longitudinal joints on the seismic response of the shield tunnel in liquefiable soils. To this end, a series of direct shear tests on the concrete interface were carried out, and the mechanical properties of the concrete interface under different confining stress and cyclic number were studied. Then the dynamic response of a large-scale shield tunnel in liquefiable soils were presented, and the effect of longitudinal joints were discussed. The conclusions may help to interpret the damages near the joints and provide valuable insights to the seismic design for large shield tunnels in liquefiable soils.
2. Direct shear tests on the concrete interface
In recent decades, the precast concrete segmental method of construction has become increasingly popular. More and more joints in precast concrete appear in structures. These joints represent locations of discontinuity in structures through which compressive and shear stresses must be transmitted. So the shear behavior of concrete interface has been a subject of interest to many researchers [19-23]. Generally, the shear behavior of the interface depends on roughness, strength of the asperities, confinement, and material type. For large-scale shield tunnels in liquefiable soils, the interface between segments is usually made of high-strength concrete. Meanwhile, the contact surfaces are casted against steel forms. As a result, the roughness has a relatively less effect on the interface than other undulated interfaces (gypsum plaster [24], cracked concrete interface [23, 25]). Therefore, in order to investigate the behavior of the concrete interface between segments of the large shield tunnel, the direct shear tests were conducted based on the Weisan Road Cross-river Tunnel in Nanjing, China.
2.1. Testing apparatus and tests description
The Weisan Road shield tunnel which crosses the Yangtze River is a highway tunnel in Nanjing city, China. The outside diameter of the tunnel is 14.5 m. Reinforced concrete segments are used as tunnel lining, and there are 10 joints for each segment ring. According to the requirement of the testing machine, the size of the concrete samples was 150×150×75 mm. The concrete samples were prepared at the segment factory. The constituent materials and the mix proportion of the samples are the same with that of the segments. After 3 days of moist curing and 7 days of water curing, the specimens together with other segments were left in the air for about 3 months. Several additive agents such as coal ash were added, and the average compressive strength of the concrete sample is more than 70 MPa.
Direct shear tests described in this paper were conducted using the RMT-150C Rock Mechanics Testing machine at Institute of Rock and Soil mechanics, Chinese Academy of Science. The photo of the setup can be found in the published paper [26]. This is a servo-controlled testing machine. This machine mainly consists of the vertical loading system with a capacity of 1000 kN, the horizontal loading system with a capacity of 500 kN, the upper steel box and the lower steel box. The maximum shear displacement of the setup is 50 mm. The upper steel box is fixed on the setup frame, and the lower box is connected to the horizontal hydraulic actuator. First, two concrete samples are put into the upper and lower steel box respectively. Next, the confining load is applied by the vertical loading system. When the desired confinement is achieved, the confinement is locked. At last, the shear load is applied by the horizontal loading system, and is transmitted to the interface through the lower steel box.
Several monotonic shear tests were conducted to study the effect of confining stress. The confining pressure for the concrete interface of the shield tunnel is influenced by many factors, such as the soil cover of the tunnel, underground water level, characteristics of the ground motion. Based on the field monitoring results, five levels of confining pressure (0.5 MPa, 1.0 MPa, 3.0 MPa, 5.0 MPa, 7.0 MPa) were chosen. During earthquakes, relative cyclic displacements may occur between the surfaces of concrete interface, so the direct shear tests under cyclic loading were also carried out to investigate the effect of the number of cyclic shearing.
2.2. Results and discussion
2.2.1. Compressive behavior
Fig. 1 illustrates the relationship between the normal stress and corresponding penetration of the interface. It is possible to see that the curve can be divided into two stages. In the first stage, as the normal stress increases, more contact units become engaged and the total contact area increases. Consequently, both the penetration and the compressive stiffness (the gradient) show a rapid increase. In the second stage, when the normal stress reaches a critical value, the contact units develop plastic zones and the total contact area becomes nearly constant. Thus the compressive stiffness becomes stable.
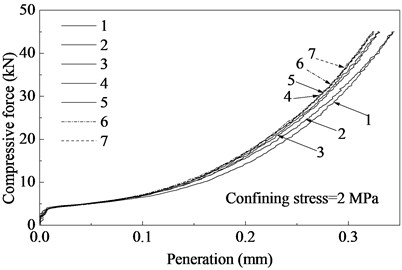
The relationship between compressive force and corresponding penetration for the interface after different sliding cycles is shown in Fig. 2. It can be found that the normal stiffness shows an increase in first few sliding cycles. After about 5 sliding cycles, the cyclic slipping has little effect on the normal behavior of concrete interface.
Fig. 1Normal stress-penetration curves
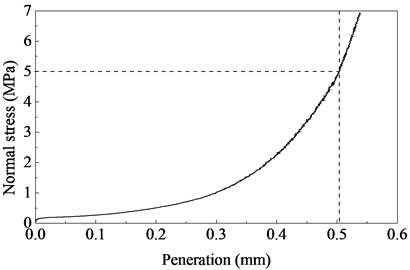
Fig. 2Compressive force-penetration curves of the concrete interface after different sliding cycles
2.2.2. Shear behavior
As shown in Fig. 3, the relationship between the shear force and shear displacement is nearly linear up to the shear strength at which the interface slips. Afterward, the slope of the curve shows a sharp decrease and the displacement increased gradually until the end of the test. The shear displacement-force curve highlights a perfect elastoplastic behavior of the joint. The peak shear strength almost equals to the residual shear strength. This behavior is different with that of the undulated joints. For the undulated joints, the shear displacement-force curve can be subdivided into several parts, and the peak shear strength is usually larger than the residual strength. Additionally, with the increase of the confining stress, both the shear strength and shear stiffness significantly increase.
Fig. 4 shows the friction coefficients of the interface at different confinement levels. Under the considering confining stress, the friction coefficient varies between 0.50 and 0.70, and it is more scattered under lower confining stress than that under high confining stress. These results are consistent with the results [20, 21] for the flat concrete surfaces. However, as the normal stress increases, the average friction coefficient shows an increase. This behavior is exactly the opposite of that observed by other researchers [20, 21].
The above results (Figs. 1-4) can be explained as follows: On the one hand, the contact surfaces were cast against steel forms, and the axial compressive strength of the concrete was more than 70 MPa. Compared with other interfaces, the average inclination of the contact units is smaller and the average strength of the asperities is higher. Less asperities are crushed under high confining stress. So the confining stress and the shear slipping have less effects on the asperities. The shear displacement-force curve highlights an elastic perfectly-plastic behavior. On the other hand, since the concrete samples together with segments were exposed in air for a long time (more than 3 months), and the stone non-uniformly distributed close to the surface. The concrete samples contracted non-uniformly due to the chemical and dry shrinkage. As a result, the contact surfaces were not flat. Therefore, the flatness rather than roughness is the dominant factor influencing the behavior of the high-strength concrete interface. At low confining stress, small part of two surfaces are not in contact. The friction coefficient is scattered due to the differences of the surface morphology between different samples. As the confining stress increases, the total contact area gradually increases. Thus the normal stiffness increases accordingly, and the friction coefficient becomes larger and less scattered. When the confining stress exceeds a critical value, the total contact area tends to be constant. Consequently, both the normal stiffness and the friction coefficient become stable. The observations during tests can verify above explanation. During the tests, it was found that no cracks happened to the specimen, only small-scale griding appeared on part of the surfaces. As the confining stress increases, the total area with griding increases, which indicates the increase of contact area.
Fig. 3Shear force-displacement curves for concrete interfaces at different confinement levels
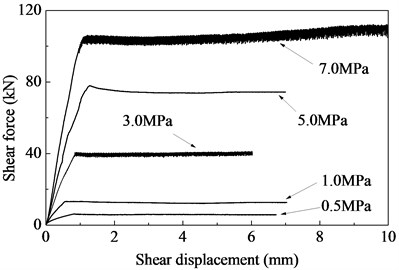
Fig. 4Friction coefficient versus normal stress
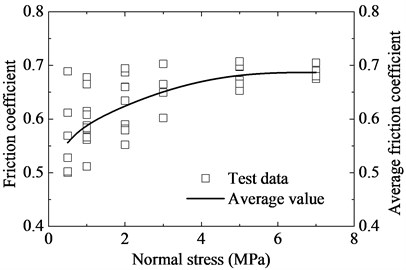
Fig. 5Variation of average friction coefficient with cycle number
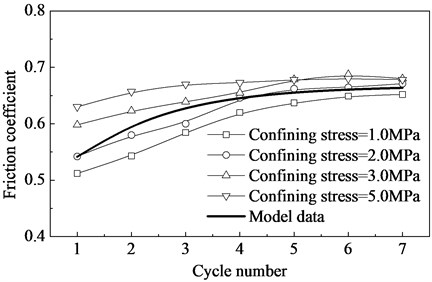
As shown in Fig. 5, before the fifth cycle, the friction coefficient is likely to be influenced by the cyclic slipping. As the number of cycles increases, the shear strength of the interface increases. Additionally, this effect is weakened by the increase of the confining stress. From the fifth cycle, the friction coefficient increases very slightly and steady-state shear strengths are obtained. Similar results have been obtained by Buyukozturk et al. [20] and Homand-Etienne et al. [27]. The effect of cyclic slipping on the friction coefficient of the interface can be also explained by the change of the contact area. In the first few cycles, the cyclic shear displacement makes the interface flatter, thus resulting in the increases of contact area. As the confining stress and the cyclic number increase, the total contact area tends to be stable. Then this effect can be neglected.
2.2.3. Model for the concrete interface
2.2.3.1. Normal behavior
According to the test results, the following model (Eq. (1)) for the normal behavior of the concrete interface was achieved through data fitting. If the interface is opened, the normal stress is zero. Otherwise, the normal stress is related to the normal penetration:
where is the normal pressure in MPa; is the corresponding penetration in mm; is the critical penetration in mm; is the critical contact pressure in MPa; , and are fitting constants; is the maximum compressive stiffness in MPa.
2.2.3.2. Shear behavior
It can be seen from Fig. 3 that the shear displacement-force curve highlights a perfect elastoplastic behavior. The shear behavior can be captured by a relatively simple Cloulomb-type friction law. Therefore, the Cloulomb-type friction law (Eq. (2)) was chosen to depict the shear behavior of the interface:
where is the shear stress between the contact surfaces; is the shear stiffness; is the shear displacement; is the peak shear strength; is the friction coefficient.
According to the test results, there is a negative exponential relationship (Eq. (3)) between the friction coefficient and the confining stress:
where , , and are the fitting constants.
2.2.3.3. Effect of the cyclic slipping
Since the cyclic slipping has a similar effect with increasing confining stress on the friction coefficient, the relationship between the friction coefficient and the cyclic number also can be captured by a negative exponent relationship (Eq. (4)):
where is the reduction of the friction coefficient due to the cyclic slipping; is the cyclic number; , are the fitting constants.
As previously mentioned, the cyclic slipping influences the shear behavior of the interface only in the first few cycles under low confining stress. When the cyclic number is more than 5 or the confining stress is larger than 5.0 MPa, this effect can be neglected.
Based on the testing results, the parameters for the proposed model of the high-strength concrete interface are shown in Table 1.
Table 1Parameters for concrete interface
(MPa) | 0.12 | (GPa/m) | 5.0 |
0.06 | –0.18 | ||
0.11 | –1.75 | ||
(mm) | 0.5 | 0.23 | |
(MPa) | 5.5 | –1.65 | |
(GPa/m) | 35.0 | 0.69 |
3. Effect of longitudinal joints on the seismic response of a shield tunnel
3.1. Description of the shield tunnel
The Weisan Road shield tunnel which crosses the Yangtze River is a highway tunnel in Nanjing city, China. The tunnel with an outside diameter of 14.5 m consists of two lines, and each line extends about 5 km. Reinforced concrete segments (Class: C60 according to Chinese standard [28]) are used as tunnel lining. Each segment ring is formed by 10 segments (1 trapezoid segment, 2 adjoining segments, 7 standard rectangular segments), and the average width and the thickness of the segment are 2.0 m and 0.6 m respectively. There are three inclined straight bolts with a diameter of 0.03 m at each longitudinal joint, and the bolts are installed immediately after the assembly of segments.
The soils along the tunnel are primarily saturated silty and fine sand in shallow buried zones, and they are judged to be liquefiable subjected to precautionary earthquake loading according to Chinese standards [29, 30]. The parameters for the soils and tunnel lining are shown in Table 2 and Table 3 respectively.
Given this large shield tunnel has as many as 10 longitudinal joints for each ring, and the liquefiable soils distribute in shallow buried zones. It is very suitable to study the effect of the longitudinal joints on the seismic response of the tunnel in liquefiable soils.
Table 2Parameters for soil deposits
Soil deposit | Thickness (m) | Density (kg/m3) | Elastic modulus (MPa) | Poisson’s ratio | Cohesion (kPa) | Friction angle (°) | Permeability (m/s) |
Silty clay | 5 | 1810 | 3.5 | 0.42 | 15.0 | 13.6 | 5.8e-07 |
Silty sand | 45 | 1900 | 13.8 | 0.29 | 1.0 | 34.4 | 6.7e-05 |
Sand | 25 | 2070 | 14.8 | 0.26 | 0.0 | 35.0 | 2.3e-04 |
Table 3Parameters for concrete and bolt
Material | Density (kg/m3) | Elastic modulus (GPa) | Poisson’s ratio | Compressive strength (MPa) | Tensile strength (MPa) |
Concrete | 2400 | 36.0 | 0.20 | 27.5 | 2.04 |
Bolt | 7800 | 210 | 0.20 | 480 | 480 |
3.2. Numerical model
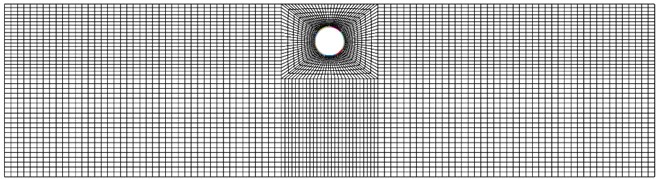
The soil liquefaction is more likely to occur as the soil cover decreases. Therefore, a transverse section with a soil cover of about 10 m was chosen for this analysis. The numerical model presented in Fig. 6 was developed in the finite difference code FLAC3D. In order to take the effect of staggered joints connecting into account, five rings were simulated. The length, width and height of the model were 200 m, 10 m, 100 m respectively. There were 62996 elements and 73306 nodes in the meshing diagram (Fig. 6). Two types of elements (8-node brick elements, 2-node beam elements) were used. The former were used for modeling the soil and concrete segments, while the latter were used for modeling the bolts. In the analyses, the behaviors of the soils and concrete were assumed to be elastic-perfectly plastic, and they obeyed the Mohr Coulomb failure criterion with tension cut-off.
When the saturated soils are subject to the dynamic loading, the volume of the void space may decrease in some sands. As a result, the pore pressures build up, and the effective stresses decrease gradually. Eventually, this process may lead to soil liquefaction when the effective stress approaches zero. Therefore, the key problem is to simulate the build-up progress of the pore pressure in the soils. In this computer simulation, a widely used model that accounts for the basic physical process was chosen for simulating the soil liquefaction. This model were described in details in Section 3.3.
Generally, the internal forces are transmitted by the concrete-concrete interface and the bolts at the joints. The former mainly transmits the compressive and shear stresses, while the latter mainly transmits the tensile and shear stresses. In order to simulate the behavior of the concrete interface, the proposed model for the concrete interface in Section 2.2 was implemented using Fish programs in the finite difference code. The bolts at the joints were modeled by beam elements which obeyed the Mises failure criterion. The beam element connected the nodes located at two adjacent segments, and they can transmit the tensile and shear stresses.
In order to assess the effect of longitudinal joints, another comparative case was also simulated. In the latter simulation case, the longitudinal joints were neglected, and each segment ring was assumed to be continuous. Besides the longitudinal joints, all other simulation strategies were the same with the former case.
Fig. 6Numerical model
a) Numerical mesh
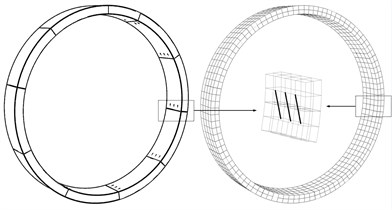
b) Concrete interfaces and bolts at joints
3.3. Pore pressure build up model
The irrecoverable volume contraction will happen to the saturated soils under the seismic loading, which leads to the increase of pore pressure and the decrease of effective stress in soils. This mechanism is well-described by Martin et al. [31], and the parameters for the model can be easily determined from simple tests. So this model has been widely used in geotechnical engineering applications for decades [13, 32, 33]. In this study, the Finn model was chosen to depict the behavior of the pore pressure in soils subjected to earthquake loading. The excessive pore pressure in soils can be determined by Eq. (5):
where is the incremental pore pressure in soil; is the rebound modulus for the soil, and it can be determined by Eq. (6); is the incremental plastic volumetric strain, and it can be determined by Eq. (7) [34]:
where is the initial effective stress; is the excessive pore pressure in soil; , , are the parameters for the soil, and they are about 0.62, 0.43, 0.0025 respectively for saturated sand soil:
where is the plastic volumetric strain; is the amplitude of the cyclic shear strain; and are test constants, and in many cases, × 0.4. They were taken as 0.82 and 0.49 respectively for this analysis based on the in-situ survey results and the research findings by Long et al. [35].
3.4. Boundary conditions and input seismic wave
The ground surface was assumed to be flat and free of loads, and the underground water level was assumed to be at the level of ground surface. According to the previous studies [36-38], the soil-structure interaction has an influence on the response of the tunnel. The interface may open and even slid under reserved cyclic shear under seismic loading. However, due to the dramatically reduced shear stiffness of liquefied soil, a quasi-hydrostatic pressure consequently develops inside the soils after liquefaction and it allows less separation to occur between soil and structure joint interfaces. Then the joint interface modeling occupies minor roles on the structural damages after liquefaction [12]. In this paper, the interface element, characterized by Coulomb sliding and shear bonding, were used to simulate the soil-structure interface, and the parameters for the interface shown in Table 4 were chosen according to the study by Okhovat et al. [12].
Table 4Parameters for soil-structure interface
Normal modulus (GPa/m) | Shear modulus (GPa/m) | Friction angle (o) | Cohesion (kPa) |
35.0 | 1.0 | 24.5 | 0 |
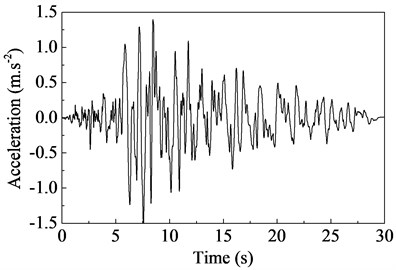
The input seismic excitation (Fig. 7) was recorded during the Loma Prieta Earthquake in 1989, and the peak ground acceleration (PGA) of the record is about 0.15 g. The main reasons for using this excitation are that it is a realistic motion and the (the average shear wave velocity over the top 30 m of soil) of the recorded site is close to that of the studied site.
The numerical analysis consisted of two steps: The first, a static step included the application of a gravitational force and the simulation of tunnel excavation. During the first step, the bottom boundary of the model was fixed in vertical direction, and the lateral boundaries were fixed in horizontal direction. During the subsequent dynamic step, the horizontal excitation was applied on the bottom boundary of the model in terms of a stress time history, and the bottom boundary and the lateral boundaries of the main grid were coupled to the quiet grid and the free-field grid respectively.
It can be seen from the test results (Section 2.2) that the cyclic slipping between the contact surfaces can affect the properties of the concrete interface. However, it was unknown whether the slipping happened or not under the input acceleration in Fig. 7. In addition, the confinement was variable. Consequently, the friction coefficients of the interfaces were unknown. In order to take the effect of cyclic slipping on the shear properties of the interface into account, an iterative method was employed in this paper. First, the friction coefficient under monotonic loading was chosen for the concrete interfaces, and then the relative displacement and the normal stress between two contact surfaces were monitored during the first simulation with the help of the FISH language. The cyclic slipping number (e.g. 1, 2, 3), their starting time (e.g. , , ) and the average normal stress during each cyclic slipping were obtained after the first simulation. Next, the second simulation was conducted, and the friction coefficients of the interfaces were modified according to the first simulation results and the experimental results (several cycles) at different time. The cyclic slipping number (e.g. 1, 2, 3), their starting time (e.g. , , ), and the average normal stress were also monitored in the second simulation. The third and fourth simulation were conducted in the same way. When the starting time of cyclic slipping was close to that in the previous simulation, the simulation results were chosen for the final results.
Fig. 7Input acceleration time history
3.5. Simulation results and discussion
3.5.1. Excessive pore pressure in soil
The excessive pore pressure is the incremental pore pressure. Therefore, the ratio of the excessive pore pressure to the initial vertical effective stress () can represent the liquefaction degree of the soil. As shown in Fig. 8, the ratio increases slowly in the beginning, and shows a sharp increase at around 5 s. Consequently, the soil from 20 m up is liquefied. Compared with the results in free field, the ratio is smaller in the vicinity of the tunnel, and it still shows a slowly decrease after about 10 s. As a result, the soils below the tunnel is less likely to be liquefied than that located at other positons, which is consistent with the findings from shaking table tests on the subway station in Nanjing [39]. This may be explained by the large deformation of surrounding soil due to the tunnel uplift.
Fig. 8Ratios of excess pore pressure to vertical effective stress in the soils
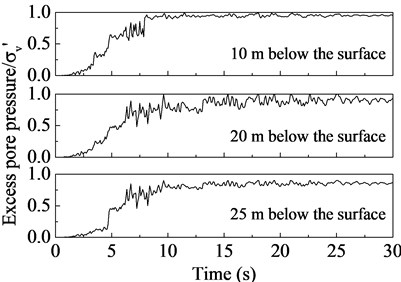
a) Free field (30 m away from tunnel)
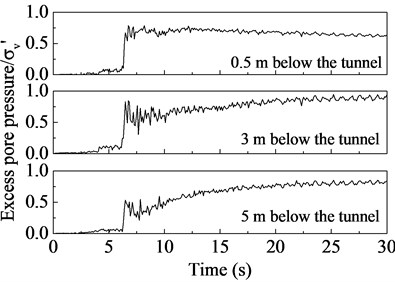
b) Below the tunnel
3.5.2. Tunnel uplift and surface deformation
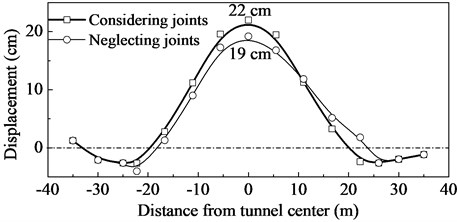
The most severe damage to the tunnel due to soil liquefaction is the uplift. Fig. 9 shows the variation of vertical displacement of the tunnel. It can be observed that the displacement increases slowly in first few seconds, and shows a sharp increase at around 6 s. Afterwards, it starts to oscillate around a mean value until the end. This behavior is similar to that of the excessive pore pressure. The maximum uplift at the invert of tunnel lining (point B) is about 22.5 cm, which sees too large and may lead to severe damages to the joints between segment rings. Due to the tunnel uplift, the ground surface undergoes large vertical displacements (Fig. 10). The maximum displacement is approximately 22.0 cm, and the influence region is about 20 m away from the center of the tunnel, which is about 1.4 times the length of the tunnel diameter. Similar results have been presented by many researchers [8, 10, 12, 14]. The longitudinal joints between segments strongly influences the tunnel uplift and surface deformation. When neglecting the longitudinal joints, the tunnel liner becomes more rigid, which effectively limits the deformaion of the tunnel and surrounding soils. Consequently, the maximum uplift decreases to 18.3 cm (23 %), and the maximum surface deformation decrease to 19 cm (16 %).
Fig. 9Tunnel uplift time histories
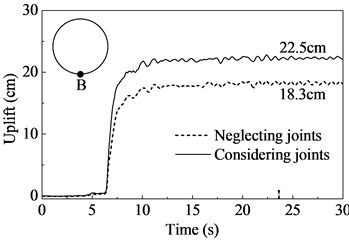
Fig. 10Variation of ground surface displacement with distance from tunnel center
3.5.3. Convergence of the tunnel
From Fig. 11, it is possible to see that the tunnel is compressed in horizontal direction (C-D), and the maximum convergence is nearly 6.0 cm. On the contrary, it is elongated in vertical direction (A-B), and the maximum convergence is about –6.0 cm. This can be explained that the lateral pressure on the segments increases with increasing pore pressure in soil, and then ground static loads and excessive pore pressures deform the tunnel lining into an oval shape. The joints also have a significant effect on the tunnel convergence. When the tunnel lining is assumed as continuous medium, the tunnel convergence (C-D) has decreases by about 20 %. Since the concrete interfaces close to point A and B are mainly in compressive state due to the excessive pore pressures, the effect of the longitudianal joints on the convergence (A-B) is less significant.
3.5.4. Stress in concrete
Since the tunnel is deformed into an oval shape due to the excessive pore pressures, there may be tensile stress in concrete which can lead to concrete spalling and cracking. Therefore, the stresses in the sections located at 90° and 0° were presented in Fig. 12. It can be found that the concrete mainly sustains compressive stress subjected to static loads. However, the stress shows a sharp increase due to the seismic excitation, and then the tensile stress appears in concrete. The maximum tensile stress in concrete is about 1.8 MPa. When neglecting the joints, the dynamic increment of the stress in concrete has sharply decreased by 40 %, and there is almost no tensile stress in concrete. Therefore, neglecting the joints means overestimating the bearing capacity of the lining concrete.
Fig. 11Tunnel convergence time histories
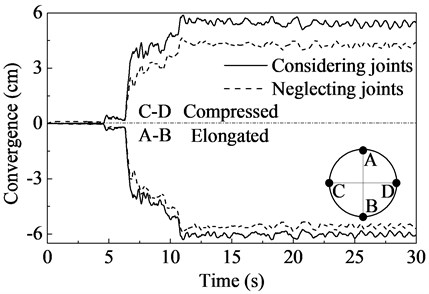
Fig. 12Stress in concrete time histories
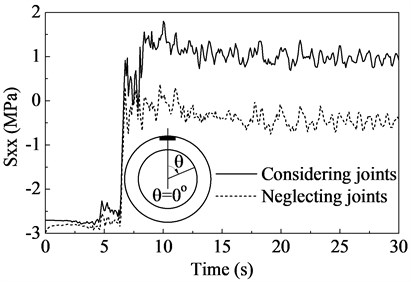
a) Horizontal stress in the section located at 0°
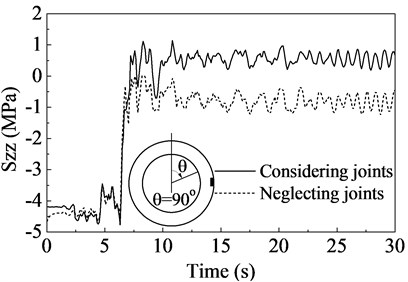
b) Vertical stress in the section located at 90°
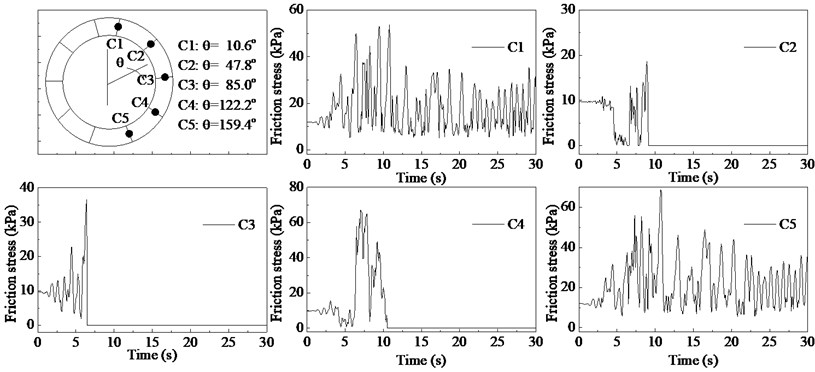
3.5.5. Contact pressures between the concrete surfaces at the joint
Since the bending and shear stiffness of the tunnel lining at the joint are much less than those at other locations, most of the seismic damages take place at the joints. Therefore, five points (C1, C2, C3, C4, C5) located at the middle of corresponding joints were chosen to monitor the normal and friction stresses between contact surfaces. The results are shown in Fig. 13 and Fig. 14. It can be seen that the variation trends of the normal stresses between the contact surfaces at liner crown (C1) and bottom (C5) are similar to that of the excessive pore pressures. The normal stresses at the point C1 and C5 have increased by approximately 220 % and 120 % respectively, and the maximum normal stresses at the point C1 and C5 are about 5.5 MPa and 6.5 MPa. For the other three points (C2, C3, C4), the normal stresses oscillate in the beginning and then decrease to zero, which indicates the occurrence of joint opening. Afterwards, the joints keep open until the end. In contrast, the joint at the point C3 is more likely to open than the other two joints.
The friction stresses between contact surfaces are presented in Fig. 14. It can be seen that the friction stresses at the point C1 and C5 oscillate throughout the excitation period, and the minimum value is greater than zero. This indicates the joints keep in contact during the excitation period. For the point C2, C3 and C4, since the friction stress dependents on the normal stress, the friction stresses show similar variation trends. When the joint opens, both the normal and friction stresses cannot be transmitted by the interfaces.
From the results (Fig. 13), the confinements between the contact surfaces at the crown and invert sharply increase due to the soil liquefaction, which leads to the increase of the shear strength of the interface. Meanwhile, the interfaces at the sidewalls tend to open, which results in the loss of the shear strength (Fig. 14). Therefore, the cyclic slipping is not easy to happen on the concrete interfaces when the soils liquefy.
From the above results, the joints between segments may get opened due to the soil liquefaction, which can significantly affect the operation of sealing gaskets and even leads to water leakage. Moreover, the joints located at the waist are more likely to open than those at the crown and bottom.
Fig. 13Normal stress-time histories for the concrete interfaces at joints
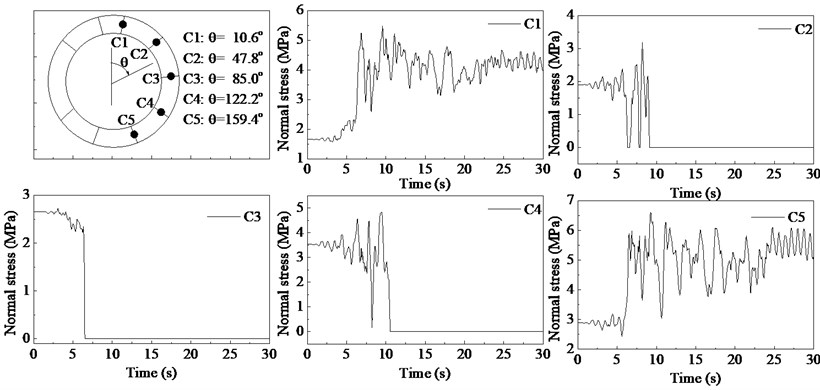
Fig. 14Frictional stress-time histories for the concrete interfaces at joints
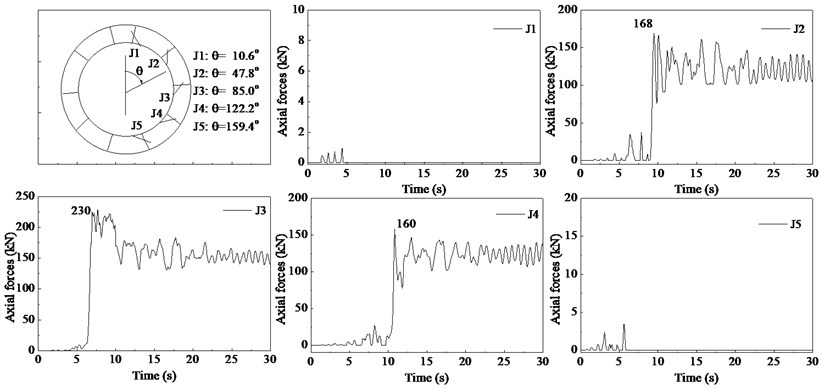
3.5.6. Axial forces in bolts
When the joint between segments is open, the connecting bolts will sustain tensile force. The dynamic increments of axial forces in five bolts (J1, J2, J3, J4, J5) at joints are shown in Fig. 15. As mentioned before, the joints at the crown and bottom of the liner are closed throughout the earthquake period, and the compressive force in tunnel lining is mainly sustained by the concrete interface. So the axial forces in the corresponding bolts (J1, J5) are nearly zero throughout the excitation period. Since the joints at the other three locations open due to the soil liquefaction, and the tensile forces are mainly transmitted by the bolts. The axial forces in the other three bolts (J2, J3, J4) show a sharp increase, and the maximum value is about 230 kN which is close to the critical value if the pretension force is added.
Fig. 15Axial force in bolts at joints
4. Conclusions
The mechanical properties of the high-strength concrete interface between precast segments were studied through a series of direct shear tests. Based on the testing results, the effect of longitudinal joints on the seismic response of the Weisan Road Shiled Tunnel in liquefiable soils was investigated. The main conclusions can be summarized as follows:
1) For the high-strength concrete interface between precast segments, the average inclination of the contact units is small and the average strength of the asperities is high. Consequently, the confining stress and shear slipping have less effects on the asperities. The shear displacement-force curve highlights an elastic perfectly-plastic behavior. However, the concrete samples contracted non-uniformly due to the chemical and dry shrinkage, which leads to the unflatness of the contact surfaces. The flatness rather than roughness is the dominant factor influencing the behavior of the high-strength concrete interface.
2) Under low confining stress, small part of two surfaces are not in contact. As the confining stress increases, the total contact area gradually increases, thus resulting in the increases of the normal stiffness and the friction coefficient. When the confining stress reaches a critical value, the contact area tends to be constant. Thus the normal stiffness and the friction coefficient become stable. There is a negative exponential relationship between the friction coefficient and the confining stress.
3) The cyclic slipping has a similar effect on the behavior of the concrete interface with increasing confining stress. As the cyclic number increases, the friction coefficient increases accordingly. However, this effect becomes unapparent and even can be neglected after the fifth cycle.
4) The longitudinal joints have a significant effect on the seismic response of shield tunnel in liquefiable soils. When considering the joints, the shield tunnel undergoes larger uplift and convergence, and the stresses in tunnel lining show a 40 % increase. The shield tunnels becomes more vulnerable to earthquakes due to the joints. So the joints should be taken into account during seismic design for large shield tunnels in liquefiable soils.
5) During the earthquake, the tunnel is deformed into an oval shape due to the soil liquefaction. Some concrete interfaces, especially those located at the waist, may get opened. Consequently, the normal and shear stresses of the interface reduce to zero, and the bolts sustain large tensile forces. The separation between the two surfaces can significantly influence the operation of the sealing gaskets, which is the main reason for water leakage.
The test results and discontinuous simulation method proposed in this study may help to interpret the seismic damages to shield tunnels, and the conclusions may provide valuable insights to the seismic design for larger shield tunnels in liquefiable soils. In addition to the concrete interface, the concrete-bolt interaction may lead to local concrete cracking under earthquake loading. So the response of the bolt-concrete system under cyclic loads is an issue that deserves further investigation.
References
-
Kawasami H. General Report on the Niigata Earthquake of 1964. Tokyo Electrical Engineering College Press, Tokyo, 1968.
-
Liu H. Seismic Damages in Tangshan Earthquake. Earthquake Press, Beijing, 1989, (in Chinese).
-
Koseki J., Matsuo O., Ninomiya Y., Yoshida T. Uplift of sewer manholes during the 1993 Kushiro-Oki earthquake. Soils and Foundations, Vol. 37, Issue 1, 1997, p. 109-121.
-
Hamada M., Isoyama R., Wakamatsu K. Liquefaction induced ground displacement and its related damage to lifeline facilities. Soils and Foundations, (Special Issue on the Geotechnical Aspect of the January 17, 1995 Hyogoken-Nambu Earthquake), 1996, p. 81-97.
-
Unjoh S., Kaneko M., Kataoka S., Nagaya K., Matsuoka K. Effect of earthquake ground motions on soil liquefaction. Soils and Foundations, Vol. 52, Issue 5, 2012, p. 830-841.
-
Mohri Y., Kawabata T., Ling H. I. Experiments on shallowly buried pipelines using shaking table. Proceedings of the 10th Earthquake Engineering Symposium, Tokyo, Japan, 1998, p. 1913-1916.
-
Mohri Y., Kawabata T., Ling H. I. Experimental study on the effects of vertical shaking on the behavior of underground pipelines. Proceedings the 2nd International Conference on Earthquake Geotechnical Engineering, Lisbon, Portugal, 1999, p. 489-494.
-
Ling H. I., Mohri Y., Kawabata T., Liu H., Burke C., Sun L. Centrifugal modeling of seismic behavior of large-diameter pipe in liquefiable soil. Journal of Geotechnical and Geoenvironmental Engineering, Vol. 129, Issue 12, 2003, p. 1092-1101.
-
Tamari Y., Towhata I. Seismic soil-structure interaction of cross sections of flexible underground structures subjected to soil liquefaction. Soils and Foundations, Vol. 43, Issue 2, 2003, p. 69-87.
-
Liu H., Song E. Seismic response of large underground structures in liquefiable soils subjected to horizontal and vertical earthquake excitations. Computers and Geotechnics, Vol. 32, Issue 4, 2005, p. 223-244.
-
Huang J., Peng L. M., Li X. L. Transverse seismic responses of Shiziyang shield tunnel in liquefiable soil and its shock absorption measures. Chinese Journal of Geotechnical Engineering, Vol. 31, Issue 10, 2009, p. 1539-1546, (in Chinese).
-
Okhovat M. R., Shang F., Maekawa K. Nonlinear seismic response and damage of reinforced concrete ducts in liquefiable soils. Journal of Advanced Concrete Technology, Vol. 7, 2009, p. 439-454.
-
Azadi M., Mir Mohammad Hosseini S. M. The uplifting behavior of shallow tunnels within the liquefiable soils under cyclic loadings. Tunnelling and Underground Space Technology, Vol. 25, 2010, p. 158-167.
-
Saeedzadeh R., Hataf N. Uplift response of buried pipelines in saturated sand deposit under earthquake loading. Soil Dynamics and Earthquake Engineering, Vol. 31, 2011, p. 1378-1384.
-
Hosseini S. M. M., Azadi M. Effect of the location of liquefiable sand lenses on shallow tunnels during earthquake loading. Arabian Journal for Science and Engineering, Vol. 37, 2012, p. 575-586.
-
Teachavorasinskun S., Chub-Uppakarn T. Experimental verification of joint effects on segmental tunnel lining. Electronic Journal of Geotechnical Engineering, Vol. 14, 2008, p. 1-8.
-
Lee K. M, Ge X. W. The equivalence of a jointed shield-driven tunnel lining to a continuous ring structure. Canadian Geotechnical Journal, Vol. 38, Issue 3, 2001, p. 461-483.
-
Hefny A. M, Tan F. C, Macalevey N. F. Numerical study on the behaviour of jointed tunnel lining. Journal of the Institution of Engineers, Vol. 44, Issue 1, 2004, p. 108-118.
-
Chern S. G., Cheng T. C., Chen W. Y. Behavior of regular triangular joints under cyclic shearing. Journal of Marine Science and Technology, Vol. 20, Issue 5, 2012, p. 508-513.
-
Buyukozturk O., Bakhoum M. M. Michael Beattie S. Shear behavior of joints in precast concrete segmental bridges. Journal of Structural Engineering, Vol. 116, 1990, p. 3380-3401.
-
Fronteddu L., Leger P., Tinawi R. Static and dynamic behavior of concrete lift joint interfaces. Journal of Structural Engineering, Vol. 124, 1998, p. 1418-1430.
-
Gebreyouhannes E., Kishi T., Maekawa K. Shear fatigue response of cracked concrete interface. Journal of Advanced Concrete Technology, Vol. 6, 2008, p. 365-376.
-
Puntel E., Saouma V. E. Experimental behavior of concrete joint interfaces under reversed cyclic loading. Journal of Structural Engineering, Vol. 134, 2008, p. 1558-1568.
-
Chern S. G., Cheng T. C., Chen W. Y. Behavior of regular triangular joints under cyclic shearing. Journal of Marine Science and Technology, Vol. 20, Issue 5, 2012, p. 508-513.
-
Gebreyouhannes E., Kishi T., Maekawa K. Shear fatigue response of cracked concrete interface. Journal of Advanced Concrete Technology, Vol. 6, Issue 2, 2008, p. 365-376.
-
Tian H. M., Chen W. Z., Yang D. S., Yuan J. Q. Experimental and numerical analysis of the shear behaviour of cemented concrete-rock joints. Rock Mechanics and Rock Engineering, Vol. 48, Issue 1, 2015, p. 213-222.
-
Homand-Etienne F., Lefevre F., Belem T., Souley M. Rock joints behavior under cyclic direct shear tests. Proceedings of 37th US Rock Mechanics Symposium, Vail, Colorado, 1999, p. 399-406.
-
The Professional Standards Compilation Group of People’s Republic of China. Code for design of concrete structures, GB/T 50010-2010. China Architecture and Building Press, Beijing, 2010, (in Chinese).
-
The Professional Standards Compilation Group of People’s Republic of China. Specifications of Earthquake Resistant Design for Highway Engineering, JTJ 004-89. China Communications Press, Beijing, 1990, (in Chinese).
-
The Professional Standards Compilation Group of People’s Republic of China. Code for seismic design of buildings, GB 50011-2010. China Architecture and Building Press, Beijing, 2010, (in Chinese).
-
Martin G. R., Finn W. D. L., Seed H. B. Fundamentals of liquefaction under cyclic loading. Journal of the Geotechnical Engineering Division, Vol. 101, 1975, p. 423-438.
-
Ni S. D., Siddharthan R. V., Anderson J. G. Characteristics of nonlinear response of deep saturated soil deposits. Bulletin of the Seismological Society of America, Vol. 87, 1997, p. 342-355.
-
Asgari A., Golshani A., Bagheri M. Numerical evaluation of seismic response of shallow foundation on loose silt and silty sand. Journal of Earth System Science, Vol. 123, 2014, p. 365-379.
-
Byrne P. A Cyclic shear-volume coupling and pore-pressure model for sand. Proceedings of Second International Conference on Recent Advances in Geotechnical Earthquake Engineering and Soil Dynamics, St. Louis, Missouri, Vol. 1, 1991, p. 47-55.
-
Long H., Chen G. X., Zhuang H. Y. Effective stress analysis of seismic response characteristics of metro station structure in liquefiable foundation. Rock and Soil Mechanics, Vol. 34, 2013, p. 1731-1737, (in Chinese).
-
Hashash Y., Park D., Yao J. I. Ovaling deformations of circular tunnels under seismic loading, an update on seismic design and analysis of underground structures. Tunnelling and Underground Space Technology, Vol. 20, 2005, p. 435-441.
-
Corigliano M., Scandella L., Lai C. G., Paolucci R. Seismic analysis of deep tunnels in near fault conditions: a case study in Southern Italy. Bulletin of Earthquake Engineering, Vol. 9, 2011, p. 975-995.
-
Kouretzis G. P., Sloan S. W., Carter J. P. Effect of interface friction on tunnel liner internal forces due to seismic S- and P-wave propagation. Soil Dynamics and Earthquake Engineering, Vol. 46, 2013, p. 41-51.
-
Chen G., Zhuang H., Du X., Li L., Zuo X., Zhu D. Large-scale shaking table test for subway station structure built in liquefiable saturated fine sand soil. Journal of Earthquake Engineering and Engineering Vibration, Vol. 27, 2007, p. 163-170, (in Chinese).
About this article
This work was financially supported by the 973 Program of China (Grant No. 2015CB057906) and the National Natural Science Foundation of China (Grant Nos. 51409245, 51225902, 51479190).
