Abstract
A reasonable assessment of the dry storage facilities for the seismic behavior after an earthquake hit is an important issue. This study was aimed to carry out to cast a 1/3 two different scale-down reinforced concrete specimens of the INER-HPS type cask: the vertical cylindrical concrete cask and the vertical concrete cask with an add-on shield, which will be used in Taiwan. A real assessment of the characteristics of the seismic response of the cask was conducted using shaking table tests. Further, the numerical simulations with finite element software LS-DYNA were performed to ensure the actual seismic behaviors of the cask under the design base earthquake. The results indicated that the designed scale-down cask specimen tested in shaking table is a successful case. Comparison of measured and calculated results demonstrated that the suggested numerical model is satisfactory and can thus be further used for numerical shaking table tests and the model can well simulate the experimental records in terms of displacements and accelerations spectral curves.
1. Introduction
The technological application and development of the nuclear power plant brought us huge conveniences and benefits, but the disposal of radioactive wastes, hazardous to human and environment, was became one of the environmental and safety problems [1, 2]. The safe disposal of nuclear wastes seemed to have become a pressing problem for society worldwide. In Taiwan, the space of spent fuel pools for temporary storage in Chinshan and Kuosheng nuclear power plant is running out, and the site of final disposal facility for the long-term storage of high radioactive waste is still difficult to be decided [3]. Therefore, the installation of dry-type interim storage facilities is urgent.
For most dry storage facilities for spent fuel, storage casks are freestanding on concrete pads, which are not anchored to the foundation pads. Thus, relative motion between the cask and the pad such as sliding, rocking, or even rolling may be induced during earthquakes, leading to stability concerns [4, 5]. Consequently, it is necessary to establish the test procedures and simulation techniques on the dry storage cask, one kind of non-anchored structures, for the reasonable assessment under the designed or historical earthquake hit.
Many previous researchers have studied the effect of nuclear related members and structures in static mechanical properties or seismic behaviors; however, few studies have evaluated the dynamic behaviors of dry storage casks considering the dynamic testing using a shaking table. In the past, some studies reported the casks behaviors under the seismic conditions using 3D finite element method. was apparently the first to perform a parametric investigation to evaluate the seismic soil-structure interaction on cask response of the concrete pad using finite element method and indicated concrete pad was the most significant contributor to the seismic response of free-standing storage casks [6]. Singh represented that the response of a storage cask subjected to 3D seismic excitation using DYNAMO program [7]. Luk investigated the seismic response of the cast system using ABAQUS 3D coupled models with explicit time integration and allows a realistic simulation of soil-structure interaction effects as well as the nonlinear cask behavior after the onset of cask rocking or rolling motion under the applied ground motions [8]. Ko investigated that LS-DYNA finite element analysis was adopted to establish a 3D model of vertical cylindrical cask considered the frictional contact at the interface between casts and pads [9]. However, few researchers reported the effect and verification of dry storage facilities using dynamic testing methods. Shirai performed the excitation test with a scale-down concrete cask using two-dimensional shaking table and the tipping-over of the scale model cask was not observed during the seismic testing [10]. In addition, Central Research Institute of Electric Power Industry in Japan also presented some full scale concrete cask to perform the seismic behavior using shaking table test from 2004 to 2006 [11]. Nuclear storage facilities are steadily performing key research studies for seismic behaviors, material degradation and leakage consistently.
This study was aimed to carry out to cast a 1/3 scale-down vertical cylindrical cask specimens with reinforced concrete of the INER-HPS cask, which will be used in . It also was performed to estimate the friction coefficient at the interface between the cask and the pad according to the sliding acceleration response of the pedestal sing the shaking table test at National Center for Research on Earthquake Engineering in . Further, the numerical simulations with finite element software LS-DYNA were performed to ensure the actual seismic behaviors of this INER-HPS cask under the design base earthquake. Those results obtained from the suggested numerical model were compared with the experimental measurements in terms of displacements, accelerations spectral curves and rocking angles.
2. Experiment
2.1. Specimens
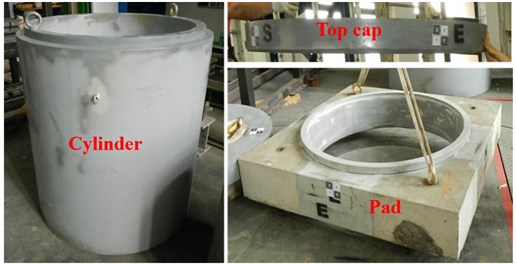
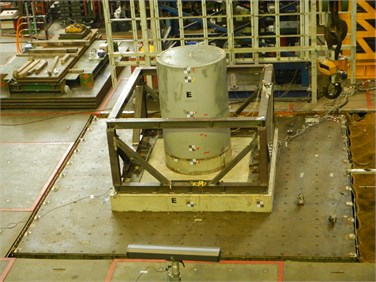
The 1/3 scaled-down dry storage cast specimen consisted of a canister, a vertical cylindrical concrete cask (VCC), an add-on shield (AOS) and a concrete pad. The seismic tests of the cask were conducted for two different setups, VCC specimen and the concrete cask with an add-on shield which had a square pedestal (as VCC+AOS specimen), respectively. The dimension and weight of the VCC and VCC+AOS specimens are summarized in Table 1. In addition, the normal concrete of 280 kg/cm2 was used in accordance with ASTM C211.1. The appearance and details design of VCC, VCC+AOS, and concrete pad scale-down specimen are shown in Figs. 1 to 2, respectively.
Fig. 1Appearance of the VCC specimens
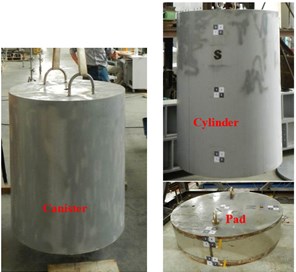
Fig. 2Appearance of the AOS specimens
2.2. Shaking table test
The shaking table has 3 degree of freedom system with a frequency range between 0.1 to 50 Hz and the maximum specimen weight is 50 tons. In addition, the maximum acceleration for lateral, longitudinal and vertical direction is 3 g, 1 g and 1 g, respectively. The testing cases of uni-axial white noise wave testing and a set of tri-axial artificial motion testing and impact pulse testing were implemented for each testing item. The testing programs and associated input motion were scheduled as shown in Tables 2 and 3, which was considered the seismic soil-structure interaction. The acceleration time histories of fictitious seismic input motion in N-S, E-W and vertical direction are shown in Figs. 3. The appearances of VCC and VCC+AOS specimens installed in the shaking table are illustrated in Figs. 4(a) and 4(b), respectively. Besides, the maximum artificial motion is 0.4 g, and the time history has a duration of 24 s. The accelerometers and laser Doppler displacement meters were applied in the top of the specimen for the measurement of the acceleration and displacement response of the scale-down specimen.
Table 1The dimension and weight of the scale-down specimens
Components | Dimension | Weight | |||
Canister | Diameter | 83 cm | 1340 kgf | ||
Height | 100 cm | ||||
VCC | Cylinder | Outer diameter | 115 cm | 2760 kgf | total 3980 kgf |
Thickness | 15 cm | ||||
Height | 160 cm | ||||
Pad | Outer diameter | 115 cm | 1220 kgf | ||
Height | 30 cm | ||||
AOS | Top cap | Diameter | 142 cm | 520 kgf | total 3620 kgf |
Height | 15 cm | ||||
Cylinder | Outer diameter | 142 cm | 2140 kgf | ||
Thickness | 12 cm | ||||
Height | 160 cm | ||||
Pad | Length, width | 150 cm | 960 kgf | ||
Height | 30 cm | ||||
Table 2Harmonic excitation tests for the cask/pad interface (1D)
Input motion | Specimen | Scheduled max acceleration | Actual max acceleration |
3 Hz sin wave (EW) | AOS pad | 1.4 g | 1.419 g |
VCC pad | 0.8 g | 0.883 g | |
5 Hz sin wave (EW) | AOS pad | 1.5 g | 1.837 g |
VCC pad | 0.9 g | 0.948 g |
Table 3Seismic tests for the cask (3D)
Input motion | Outcropping acceleration (ZPA) | Specimen | Scheduled max acceleration | Actual max acceleration |
design base earth-quake | 0.3 g | VCC+AOS | 0.588 g | 0.699 g |
VCC | 0.758 g | |||
0.4 g | VCC+AOS | 0.712 g | 0.892 g | |
VCC | 0.927 g |
2.3. Finite element model
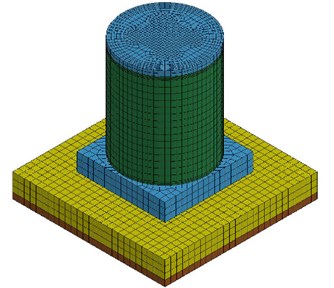
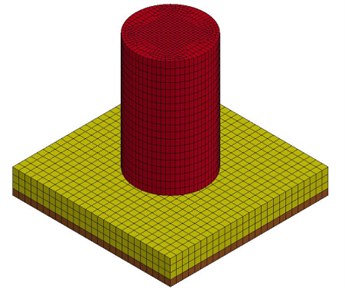
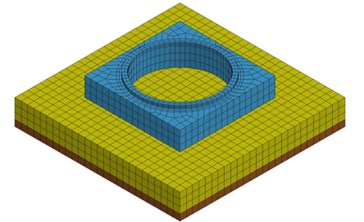
The 3D finite element model for the scale-down VCC and VCC+AOS specimens was modeled using LS-DYNA software. Based on the frictional and seismic properties at the cask and cask/pad interface obtained from the test results, numerical simulations were performed to ensure the actual seismic stability of this INER-HPS cask under the design base earthquake. The major frames of the VCC, AOS and pad specimen were represented by constant stress solid element in the 3D model. The simulation of the cask/pad interface was generated by the function of contact automatic single surface. Besides, the cast 3D model was generated as the actual cast specimen tested in shaking table as illustrated in Figs. 5(a) and 5(b), respectively. The numerical models of the pad specimens in harmonic excitation test for AOS and VCC actual pad are shown in Figs. 6(a) and 6(b), respectively.
Fig. 3Designed acceleration time histories and spectral curves (ZPA= 0.4 g)
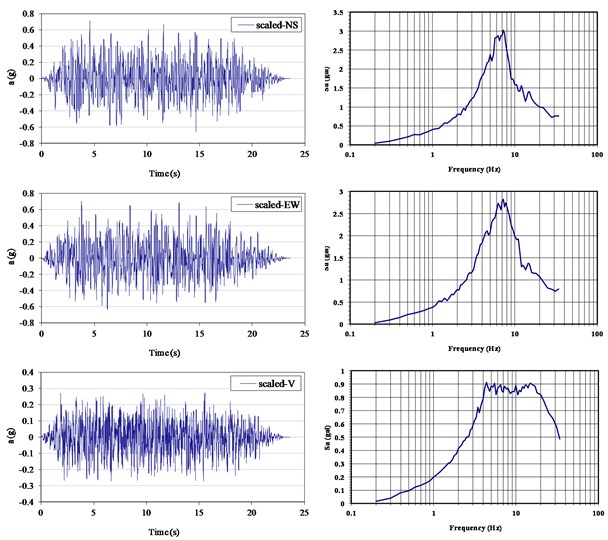
Fig. 4Specimen setup in shaking table
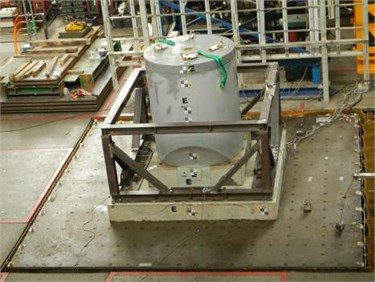
a) VCC+AOS specimen
b) VCC specimen
Fig. 5Numerical model for seismic test
a) VCC+AOS specimen
b) VCC specimen
Fig. 6Numerical model for harmonic excitation test
a) VCC+AOS specimen
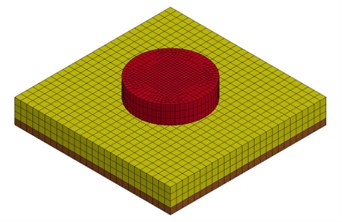
b) VCC specimen
3. Results and discussion
3.1. Harmonic excitation test
In order to calculate the friction coefficient and understand the kinematic behavior between concrete cask and pad interface, it was useful to perform the harmonic excitation test using shaking table. Based on the Newton’s second law of motion as follows:
where is the friction, is the mass of the cast and is the acceleration of the cast. However, Coulomb’s law of friction can be used with Eq. (1) as:
where is the friction coefficient and is the normal force. When the cast was slipped, the motion equation can be used as follows:
where is the gravity. In inclusion, the critical friction coefficient can be defined as the Eq. (4). Comparison of test and numerical simulation results of the acceleration and displacement time history curves for AOS and VCC pad specimens are illustrated in Figs. 7 and 8, respectively. It is seem that the suggested numerical model can well simulate the experimental records in time domain. From the suggested numerical model and test results, the friction coefficient could be assumed to be constant and set to about 0.70 and 0.25 for the AOS pad and VCC pad scale-down condition.
Fig. 7Acceleration time history curves
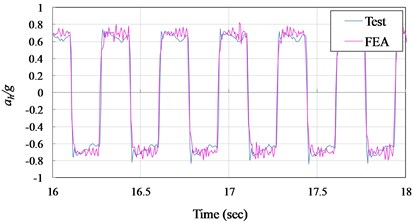
a) AOS pad specimen
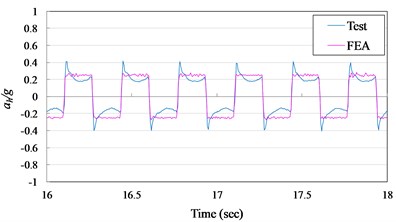
b) VCC pad specimen
Fig. 8Displacement time history curves
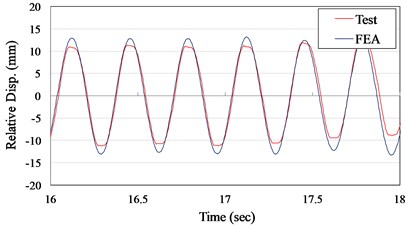
a) VCC+AOS specimen
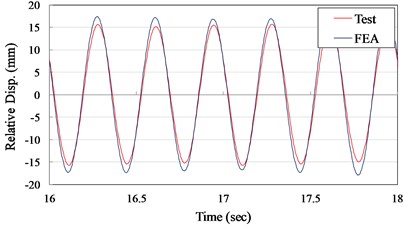
b) VCC specimen
3.2. Seismic response for VCC+AOS specimen
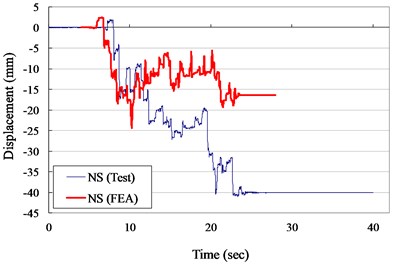
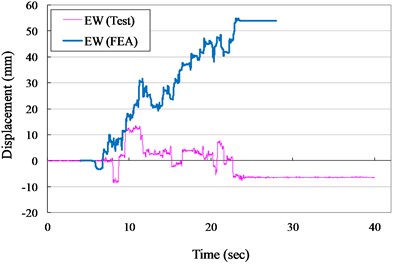
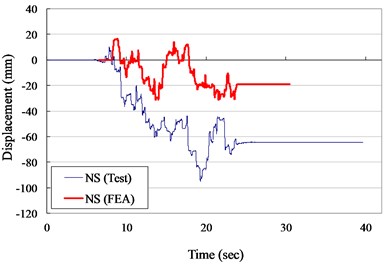
The measured and numerical displacement responses of the VCC+AOS specimen in N-S and E-W direction for ZPA of 0.30 and 0.40 g are shown in Figs. 9 to 10, respectively. It is seem that the suggested numerical model can well simulate the experimental records in testing duration. It indicated that the numerical results were slight higher than the measured results in NS direction. It was due to that the friction coefficient used in numerical model was performed in EW direction. Thought the specimen was symmetric, the non- homogenous of concrete led to the extremely heterogeneous.
Fig. 9Displacement versus times curves for VCC+AOS specimen (ZPA= 0.30 g)
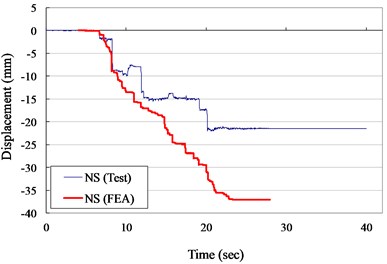
a) N-S direction
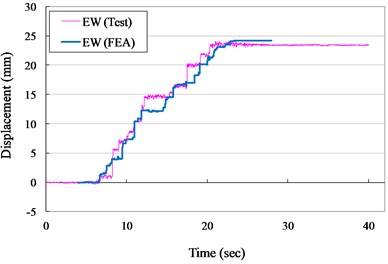
b) E-W direction
Fig. 10Displacement versus times curves for VCC+AOS specimen (ZPA= 0.40 g)
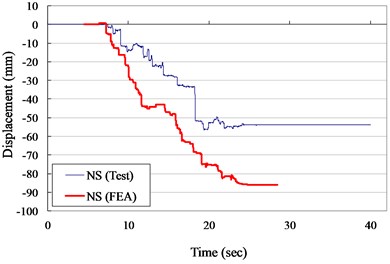
a) N-S direction
b) E-W direction
The measured and numerical rocking angles of the VCC+AOS specimen in NS and EW direction for ZPA of 0.30 and 0.40 g are shown in Figs. 11 to 12, respectively. It is seem that the suggested results were significant lower than the measured results. It was due to that the assumption of the base in the numerical model was smooth, but the actual state of the specimens has a coarse or irregular surface. However, the rocking angles during the testing were lower than 0.2 and 0.5 degrees for ZPA of 0.30 and 0.40 g, respectively. Rocking behavior and tipping-over of the scale-down cask specimens were not observed during the seismic testing. It was also ensured the actual seismic stability of the VCC+AOS cask under the design base earthquake.
Fig. 11Rocking angle versus times curves for VCC+AOS specimen (ZPA= 0.30 g)
a) N-S direction
b) E-W direction
Fig. 12Rocking angle versus times curves for VCC+AOS specimen (ZPA= 0.40 g)
a) N-S direction
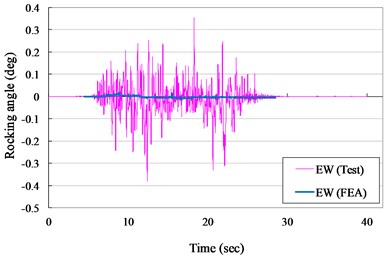
b) E-W direction
Fig. 13Displacement versus times curves for VCC specimen (ZPA= 0.30 g)
a) N-S direction
b) E-W direction
3.3. Seismic response for VCC specimen
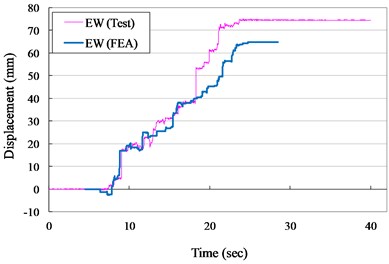
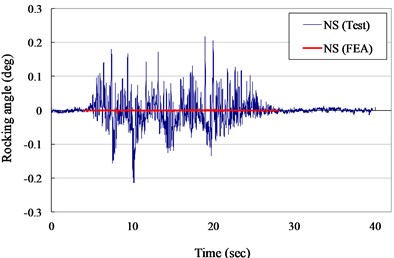
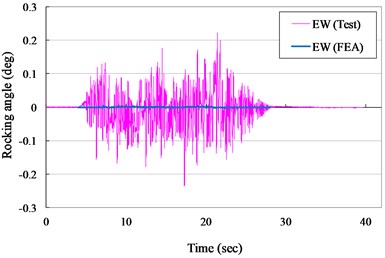
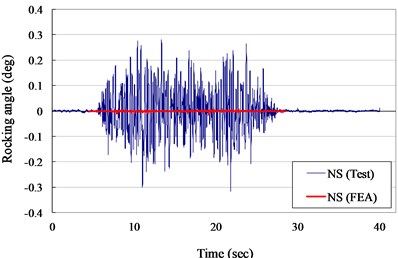
The measured displacement responses and rocking angles of the VCC specimen in NS and EW direction for ZPA of 0.30 and 0.40 g are shown in Figs. 13 to 16, respectively. The numerical results are also plotted in Figs. 13 to 16 for comparison. It indicated that the suggested numerical model was well simulated the experimental records in testing duration of 10 second. The maximum experimental displacement for ZPA of 0.30 and 0.40 g was 41.0 and 133.8 mm and the displacements of the numerical model were significant lower than the experimental records.
Fig. 14Displacement versus times curves for VCC specimen (ZPA= 0.40 g)
a) N-S direction
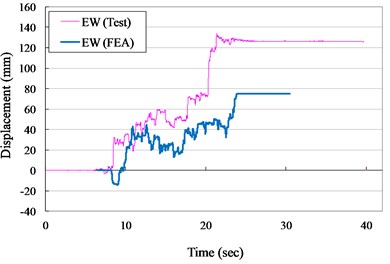
b) E-W direction
Fig. 15Rocking angle versus times curves for VCC specimen (ZPA= 0.30 g)
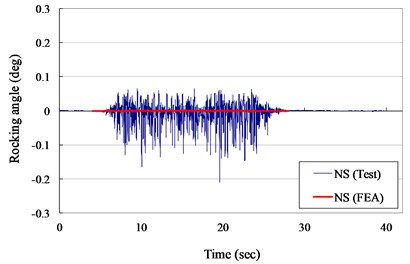
a) N-S direction
b) E-W direction
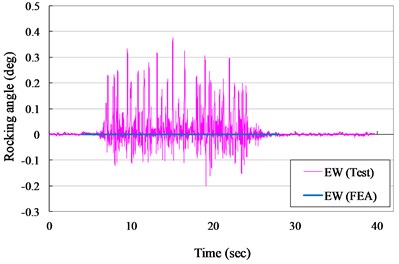
Fig. 16Rocking angle versus times curves for VCC specimen (ZPA= 0.40 g)
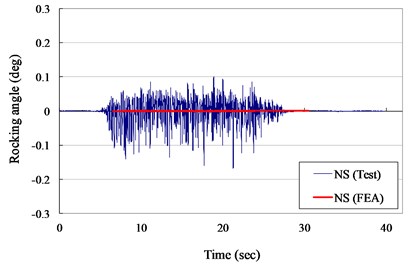
a) N-S direction
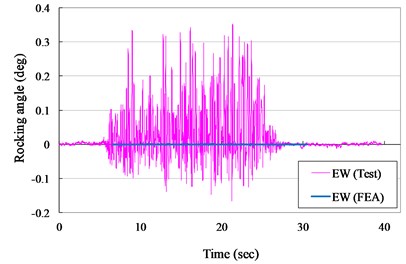
b) E-W direction
However, the maximum experimental rocking angle for ZPA of 0.30 and 0.40 g was 0.375 and 0.352 degrees and the rocking angle of the numerical model was also approach the zero level. It also indicated that the surface smoothness of the specimen between concrete cask and pad interface was an important and a key index for non-anchored structures in shaking table test.
4. Conclusions
The performance of the scale-down vertical cylindrical cask under specific earthquake excitation is investigated in this study through shaking table test and numerical simulations using LS-DYNA program. And the designed scale-down vertical cylindrical cask specimen tested in shaking table is a successful case of the civil engineering and nuclear energy industry field in . Comparison of measured and calculated results demonstrate that the suggested numerical model is satisfactory and can thus be further used for numerical shaking table tests and the model can well simulate the experimental records. In addition, the friction coefficient was used as a constant and set to about 0.70 and 0.25 for the AOS pad and VCC pad scale-down condition under harmonic excitation test. Further, the surface smoothness of the specimen between concrete cask and pad interface was an important and a key index for non-anchored structures under the design base earthquake.
References
-
Chapman N., Hooper A. The disposal of radioactive wastes underground. Proceedings of the Geologists Association, Vol. 123, Issue 1, 2012, p. 46-63.
-
Yoshida H., Aoki K., Semba T., Ota K., Amano K., Hama K., Kawamura M., Tsubot K. Overview of the stability and barrier functions of the granitic geosphere at the Kamaishi Mine: relevance to radioactive waste disposal in . Engineering Geology, Vol. 56, Issues 1-2, 2000, p. 151-162.
-
Liu S. J., Soong K. L., Yang J. T. Final disposal of spent nuclear fuel in Taiwan: a state-of-the-art technical overview. Waste Management, Vol. 9, Issue 3, 1989, p. 171-188.
-
Ko Y. Y., Hsu S. Y., Chen C. H. Analysis for seismic response of dry storage facility for spent fuel. Nuclear Engineering and Design, Vol. 239, Issue 1, 2009, p. 158-168.
-
Chen K. C., Ting K., Li Y. C., Chen Y. Y., Cheng W. K., Chen W. C., Liu C. T. A study of the probabilistic risk assessment to the dry storage system of spent nuclear fuel. International Journal of Pressure Vessels and Piping, Vol. 87, Issue 1, 2010, p. 17-25.
-
Moore D. P., Bjorkman G. S., Kennedy R. P. Seismic analysis of plant hatch ISFSI pad and stability assessment of dry casks. Proceedings of ICONE 8, , , , 2000.
-
Singh K. P., Soler A. I., Smith M. G. Predicting the Structural Response of Free-Standing Spent Fuel Storage Casks under Seismic Events. SMiRT 16, , , 2001.
-
Luk V. K., Spencer B. W., Lam I. P., Dameron R. A. Parametric Evaluation of Seismic Behavior of Freestanding Spent Fuel Dry Cask Storage Systems. NUREG/CR-6865 Report, Sandia National Laboratories, 2005.
-
Ko Y. Y., Yang H. C., Huang C. C. An investigation of the seismic response of a free-standing dry storage cask for spent fuel using the finite element method. Nuclear Engineering and Design, Vol. 261, 2013, p. 33-43.
-
Shirai K., Hirata K., Saegusa T. Experimental studies of free-standing spent fuel storage cask subjected to strong earthquakes. SMiRT 17, , , 2003.
-
Saegusa T., Shirai K., Arai T., Tani J., Takeda H., Wataru M., Sasahar A., Winston P. L. Review and future issues on spent nuclear fuel storage. Nuclear Engineering and Technology, Vol. 42, Issue 3, 2010, p. 237-248.
About this article
