Abstract
Two methods for a beam like structures damage identification using frequencies distribution and Modal Strain Energy Change Rate (MSECR) are presented in this paper. Firstly, the measured frequencies sensitivity is improved, and the frequency distribution is used to determine the suspected damage location. Secondly, the change of modal strain energy before and after the occurrence of damage is employed to locate the damage location. To conduct these studies, an experimental modal analysis program was carried out on a cantilever Bernoulli-Euler beams subjected to a controlled crack levels and the first seven modes (natural frequencies and mode shapes) were extracted and used to localize the damage. The effect of crack sizing in the local stiffness and in the frequency fluctuation was evaluated. The localization magnitude of the damage by the frequency distribution was predicted within an acceptable error range. The experimental MSECR was computed and the location of the damage was accurately identified especially for crack sizing as small as 10 % of the beam height. Finally, finite elements models were built and validated, MSECR method was applied and the results demonstrate that the method is capable of localizing damage for beam structure.
1. Introduction
Many structural systems may experience some local damage during their lifetime; if the local damage is not identified timely, it may lead to a terrible outcome. Therefore, damage identification is an essential issue for structural engineering in order to ensuring safety, implementing timely repair, and avoiding disastrous events. Structural damage detection consists of three different levels aiming to identify the existence, localization and quantification of damage, respectively. After discovering the damage occurrence, damage localization is more important than damage quantification [1].
The interest on development of advanced damage identification methods is continuing to grow. Besides the visual scanning method, the localized inspection techniques (e.g., acoustic, ultrasonic, magnetic field, radiograph, eddy-current, etc.) are still the most frequently used damage identification methods [2]. Identifying damages by these local nondestructive methods is time consuming and requires that the vicinity of the damage to be a priori known and readily accessible [3, 4].
To overcome these limitations in the localized inspection methods, the use of global methods such as Vibration Based Damage Identification Methods (VBDIM) has become a promising way. The idea of vibration based damage detection is to find the relationships between vibration properties and the damage characteristics by comparing these properties measured for the intact and the damaged structure. The primary vibration properties, which are modified due to the damage presence, are natural frequencies, mode shapes and damping values. This damage results also in variation in secondary vibration properties such as flexibility, mode shape curvatures, modal stiffness and strain energy values of structural elements. Conversely, any changes in either primary or secondary vibration properties can be used as an indication of presence and characteristics of damage.
In recent years, VBDIM have achieved significant research interest, and many techniques have been developed utilizing frequency and modal strain energy changes to locate and quantify damage.
On the topic of method determining the structural damage size and location using natural frequencies changes; many research have been carried out by J. K.Vandiver [5], Cawley and Adams [6], Stubbs and Osegueda [7], A. D. Dimarogonas [8], Doebling et al. [9, 2], Chinchalkar [10], X. Wang et al. [11], Owolabi, Swamidas and Seshadri [12], Patil and Maiti [13] and Tong Khoon Hong and Norhisham Bakhary [14]. These researches have been well documented in the extensive literature reviews published by Salawu [4] and Doebling et al. [2] and hence will not be repeated herein.
In the most of their research, the authors indicate that the method has a convenient and high accuracy measurement and it can give an inexpensive structural assessment technique, they noted also the low sensitivity of frequency to the damage severity and the limited ability of the method to simple structural form. They specify that the method requires very precise equipments for measurement and the use of advanced treatment of experimental data and they suggested the use of the frequency changes as indication of the damage presence (first level of the identification).
The Modal Strain Energy concept to detect the structural damage is firstly applied by Stubbs et al. [7, 15] in beam like structures, and developed a severity estimation algorithm later [16]. Authors Yan et al. [17], Shi et al [18-20] used the change of MSE to define a damage index which can successfully locate structural damage and quantify the damage level. Cornwell et al. [21], Yujin Hu et al. [22], Seyedpoor et al. [23] and Li et al. [24] extended this method to detect the damage in complex structural systems such as plate like structures and on frame or truss structures such as bridge and space structures. For example, the modal strain energy decomposition (MSED) method for damage localization and iterative modal strain energy method for damage extent estimation was developed for the three-dimensional frame structures. In summary, they concluded that the modal strain energy is much more sensitive to the response change than natural frequencies and mode shapes and MSE based methods seem to be promising for damage evaluation.
In this paper, the measured frequencies sensitivity is improved, a new damage localization technique based on the frequencies distribution along the beam using a single sensor is presented and the effect of several parameters on the fluctuation of the natural frequency is discussed. The flexural stiffness loss of cantilever beams in relation to the severity of damage is examined. The method change concept of Modal Strain Damage Change Rate is proposed in order to assess the feasibility of their application in experimental beams. Finite Element analysis is conducted and the results with those obtained from the experimental beam are compared.
2. Modal strain energy based damage detection and localization method
In this section, modal strain energy based damage localization method is briefly reviewed; it is a method developed and used by Stubbs et al. [7], this method is based in the fact that when structural damage occurs, modal data of the structure will be changed, as a result, modal strain energy alters and these changes can be utilized to localize damages.
For a linear and discredited structure in elements in axial direction, the MSE before and after the occurrence of damage for the th element in the th mode is given as:
where is the th mode shape vector of the undamaged state, and is the undamaged elemental stiffness of the th element. The superscript denotes the damaged state in .
is replaced by as an approximation since the damaged stiffness matrix is unknown in advance. To provide the Modal Strain Energy Change Ratio (MSECR) that can localize the damage, the local damage index developed for the th element is used. Thus, the Unit MSECR is defined as [25, 26]:
It is noted that, the no absolute has been proven more suitable for damage localization than absolute MSECR [27]. The Average Normalized Modal Strain Energy Change Ratio (ANMSECR) for the th element may also be utilized as the damage localization indicator; it is a summation of the fractions over the considered number of modes ( modes) and it is defined as:
where is the largest value of in each th mode.
3. Experimental and numerical studies
3.1. Experimental program and specimen parameters
An experimental program has been set up in two stages; first one was conducted on cantilever steel beams subjected to reductions in the depth dimension to determine the effect of the crack on static flexural stiffness and on the natural frequency change.
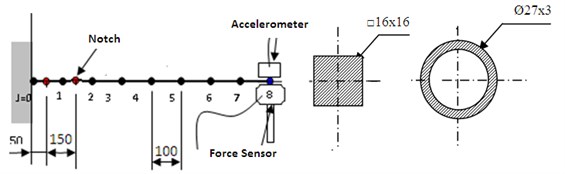
Modal test for intact and cracked beams is conducted on the beams after each flexural rigidity measure; the natural frequency is measured for different single crack scenario at position 50 mm from the clamped end of the beam. The beams used are a tube specimen and cantilever beam with square cross-section, both of them they have a length of 0.8 m (Fig. 1).
The second program test aims to establish the database of modified mode shapes that’s used in MSECR method. The tested prismatic beam of 0.7 m length with controlled notch at the position 150 mm is used. Saw cut was used to introduce the transversal crack at the corresponding position of the beam.
The beams parameters was smaller ratio that could to approximate the Bernoulli-Euler beam [28]. The beams were made of same steel material and the properties are: modulus of elasticity 2×10⁵ MPa, Poisson’s ratio 0.3; and mass density 7.7×10³ kg/m3.
Fig. 1Beam dimensions
3.2. Modal testing parameters
Modal testing was carried out for beams by transfer function technique. An accelerometer (Brüel & Kjær 4384) was used to pick up the response of the test beam under forced excitation. The beams were randomly excited using white noise signal input to a shaker (B&K 8200), which was permanently placed at the free end for all test beams. In first test, the accelerometer was mounted at point 8 as shown in Fig. 1. The transfer functions were acquired through the signal analyzer (B&K 2032). Fig. 2 illustrates the set-up of the modal testing.
To measure the mode shapes of intact and damaged beam in second test, the whole beam has been divided into 07 divisions and the accelerometer was moved from one point to another of the division to pick up a total of response signals along the length of the beam. In this study it was assumed that the effect of noise was insignificant by using white noise as the vibration source [29].
3.3. Numerical model
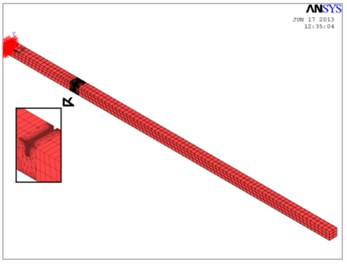
As first approach to the behavior of the damaged beam and to obtain theorical prediction to set up the test program and to define strategies for the experimental identification, a modal analysis on Finite Elements Model (FEM) was developed. ANSYS, a FEA commercial code was used in this study. A mode analysis is repeated for simulated damage scenarios (location 150 mm and various degrees of damage). A Solid186 element was used to simulate the beam as shown in Fig. 3. The stiffness change was modeled by the subtraction of a parallelepipedic with thickness equal to the crack depth. The natural frequencies and the associated mode shape are obtained from 3D model. To compute the mode shapes of intact and damaged beam, the beam model has been subdivided into 14 divisions in axial () direction and only the modal bending shapes are considered.
The correlation between numerical and experimental modal results (EMA) is carried out by comparing the FE calculated and frequencies extracted from modal measurements on the undamaged beam and damaged beam. The differences of first natural frequencies between the average of the fluctuated experimental values and FEA values are less than 5 % for both cases of intact and damaged beams. Apparently, the correlations between FEA and EMA results obtained for bending modes of the beam is relatively good.
Fig. 2Modal testing set-up
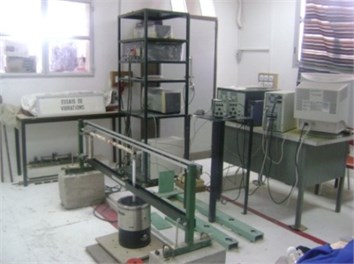
Fig. 3Model 3D of the prismatic beam (7989 elements and 16021 nodes with refined mesh near the crack)
4. Experimental results and discussion
4.1. Loss of stiffness
The local stiffness measurement is performed along the tube beam according to the scheme of the positions illustrated in Fig. 1. The corresponding masses are attached to one of the points ( 1, 2, 3,..., 8) and displacement is measured at the point 8 (Fig. 4).
The local stiffness of the uncracked and cracked beam is measured and the sensitivity of this stiffness to the presence of crack is investigated. The sensitivity term describes rate of change in flexural rigidity.
Fig. 5 shows the trend in the loss stiffness of beam for the case when the crack is close to the fixed end of beam ( 0.0625: ratio of crack location to length the beam).
It was observed that the loss of stiffness values increased with increasing crack severity. From the values of relative stiffness (Fig. 6) it was observed that the local stiffness parameter gives a good sensitivity especially for the that is close to the crack position, the sensitivity of the local stiffness is 10 % for the crack depth ratio equal 13.5 % and these values will be increased for extrapolating data measured rigidities as shown in the Fig. 6.
Fig. 4Local stiffness measurement
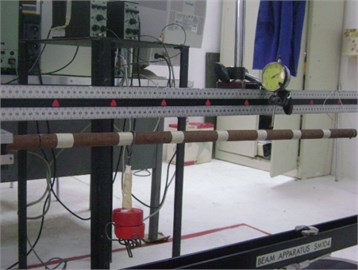
Fig. 5Local stiffness versus measuring position [30]
![Local stiffness versus measuring position [30]](https://static-01.extrica.com/articles/15757/15757-img5.jpg)
Fig. 6Local stiffness sensitivity variation [30]
![Local stiffness sensitivity variation [30]](https://static-01.extrica.com/articles/15757/15757-img6.jpg)
4.2. Change in natural frequencies
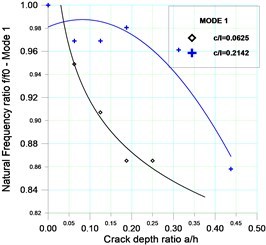
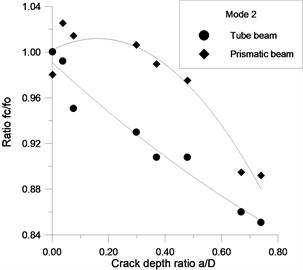
The prismatic beam (with 0.8 m length) was tested for the flexural mode. FRFs obtained for the specimen having respectively crack depth (0, 1, 2 and 3 mm) at the position 0.062 are plotted in Fig. 7(a). FRFs for tube specimen with 0, 1, 2, 3, 6, 8, 10, 13 and 18 mm crack depth at the position 0.062 are shown in Fig. 7(b). It could be observed that the fundamental frequency variation show a clear shifting as the crack depth ratio increases. The amplitude of the FRF also shows a decreasing trend, as the crack grows in size. Fig. 8 shows the plots of the variation of the first three frequency ratios () (ratio of the natural frequency of the cracked beam to that of the uncracked beam) as a function of crack depth ratio () (the ratio of the depth of a crack () to the thickness of the beam ()) for the crack position 0.062.
From these experimental figures, the following observations were made: For the all cases of the beam, the fundamental natural frequency was more affected. The sensitivity of this mode reaches 10 % for a crack depth ratio 0.40 (Fig. 8(a)).
From the Fig. 8(b), it is observed for the tube beam that the sensitivity of the mode1 is 10 % for 0.19. The high order modes are less affected; they are less sensitive to the low depth crack.
Fig. 9 shows the plots of the variation of the first three frequency ratios as a function of crack depth ratios for two crack positions 0.062 and 0.214. From this figure, it is seen that the fundamental frequency decreases significantly as the crack location moves towards the clamped end of the beam; this could be explained by the fact that the decrease in frequencies is greatest for a crack located where the bending moment is greatest. That’s confirms the use of the first natural frequency as the most convenient parameter to consider in most dynamic tests for the observation of structures [21, 22].
Fig. 7FRF of intact and damaged cases of prismatic beam a) and tube b) (log scale)
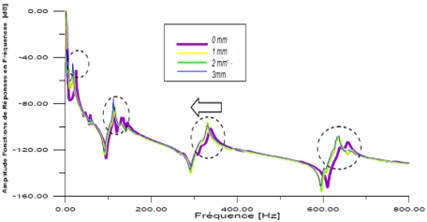
a)
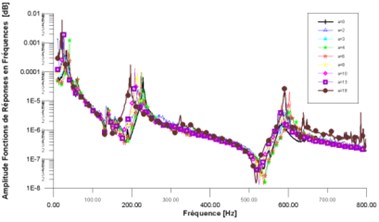
b)
Fig. 8Frequency sensitivity variation of the three first modes of a) beam with square cross-section and b) tube beam
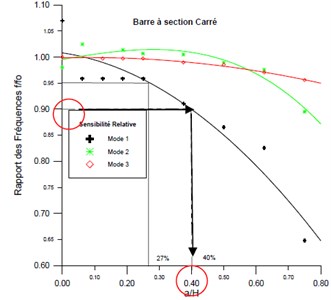
a)
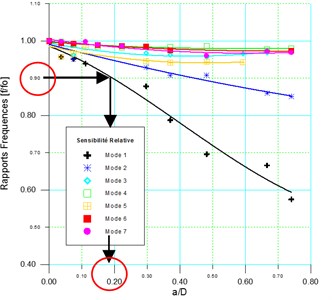
b)
Fig. 9Sensitivity variation of the 3 first natural frequencies with the ratio a/h for two positions of the crack (c/l= 0.0625 and c/l= 0.214)
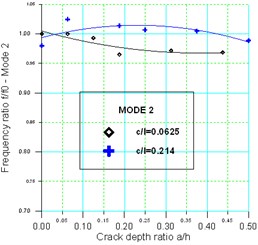
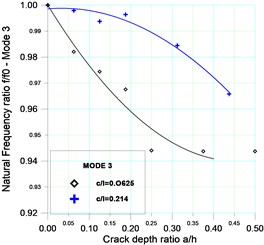
The second natural frequency was almost unaffected for a crack located at position 0.214, the reason for this zero influence was that the crack was located near the nodal point for the second mode. The third natural frequency of beam changed rapidly for a crack located at 0.062, that’s because the crack is located near the anti nodal point of this mode [29].
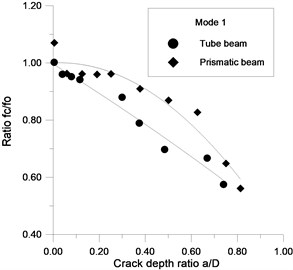
The sensitivities of the three first modes for the two beams having different stiffness are compared (Fig. 10), and the result shows that the sensitivity of naturals frequency of the tube ( 73) is most affected by the presence of the crack compared to the prismatic beam ( 21.33), ( is the area moment of inertia of the section and is the area of the section of the beam). Therefore, the detection technique based on the index of the frequency sensitivity is more promising for slender structures with a large ratio .
Fig. 10The two first modes for the two beams having different stiffness
4.3. Improvement of the natural frequencies sensitivity
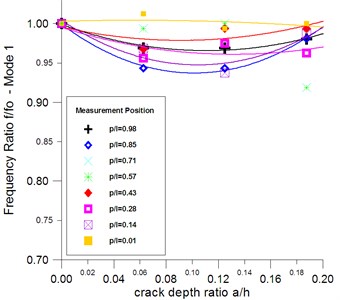
Based on the above analysis about the local stiffness and the effect of the crack position on modes, the natural frequency sensitivity is improved by measuring the response FRF at specific points by changing the position of the single sensor over the length of the beam; the goal is to find the optimal sensor position which gives better frequency sensitivity. The notch is introduced at the position 0.214 of the beam having length of 0.7 m (Fig. 1). The experimental FRFs were acquired through a signal Analyzer with resolution 0.25 Hz (laptop with PCMCIA card). The FRFs are smoothed with Lagrange polynomial algorithm (DAQ700 Software). The use of this new equipment helps to improve the measurements precision and contributes in noise reduction.
The results obtained showed a relative improvement in the sensitivity compared with the case of the accelerometer position at 0.98. The measurements using respectively the sensor positions 0.14, 0.28 and 0.85 showed that the sensitivity of mode 1 has a small improvement especially for crack depth ratio 0.20 (Fig. 11(a)); the sensitivity of the mode 1 has an improvement of 6 %.
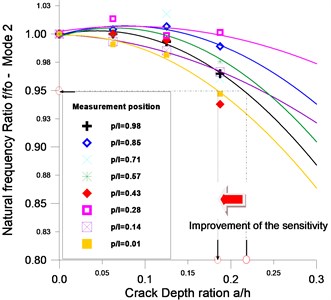
The mode 2 sensitivity has also recorded an improvement of 5 %, a variation of is closer to 17 % at the sensor position 0.43 ( is around 22 % for 0.98) (Fig. 11(b)). The sensitivity of the other modes is also improved; the improvement for example for the mode 5 is around 4 %.
Fig. 11Frequency sensitivity versus the sensor position for mode 1 and 2
4.4. Natural frequencies fluctuation
The FRF measurements on several positions results showed that there's a fluctuation of measured natural frequencies along the length of the beam.
The frequency fluctuation of the second and fourth mode for the uncracked and cracked prismatic beam is illustrated in the curves of the Fig. 12. For the undamaged beam, the frequency fluctuation of the mode1 is about 3.1 % (1.25 Hz). The fluctuation of the mode 2 is closer to 2.8 %, it is approximately equal 0.2 % for mode 3 and it is around 0.5 % for mode 4.
When a notch with depth of 2 mm is introduced in the beam, the frequency fluctuation increases and becomes equal to 8.4 % for mode 1, 0.75 % for mode 2, then it becomes unstable for these modes. It gets 0.52 % for mode 3 and 0.14 % for mode 4.
With increasing depth of the crack, the fluctuation for the modes 1 and 2 varies regardless the extension of crack. For the mode 3 and the mode 4, the fluctuation of the frequency increases and it becomes less stable.
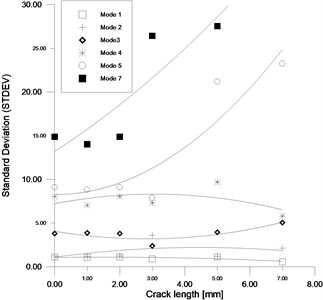
The frequency Standard DEViation (STDEV) indicates that the data points tend to be very close to the mean for low modes 1, 2, 3 and 4 for all crack depth; the frequency STDEV is not sensible to the crack extension (Fig. 13). Contrariwise, the STDEV of modes 5, 6 and 7 shows a dependency with the crack extension, that’s contribute to spread out over the frequency data some on each side of the average values.
Fig. 12Frequencies fluctuation as function of the measuring position for modes 2 and 4
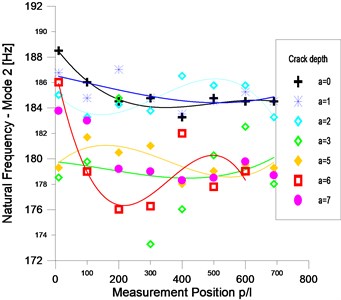
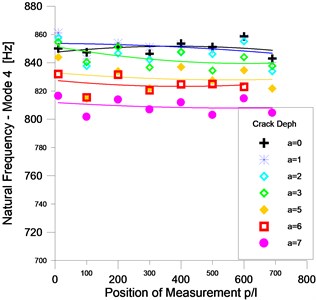
Fig. 13Frequencies STDEV as function of crack depth for modes 1, 2, 3, 4, 5 and 7
The frequency fluctuation can be explained by the interaction between three effects i.e. the effect of weight sensor, the effect of the crack severity and the effect of the position of crack compared to modal nodes of the corresponding mode. The effect of the weight sensor increases in the regions near the free end of the beam; and it appears especially for the fundamental frequency of the undamaged beam. For the cases of small crack depth, the fluctuation frequency may be due to the effect of modal nodes, but as soon as the crack depth increases, this effect decreases and gives way to the effect of the crack that becomes dominant.
4.5. Crack location using the frequency distribution method
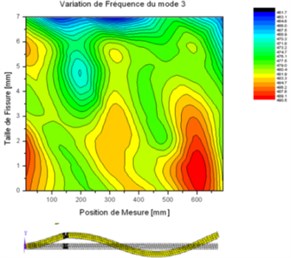
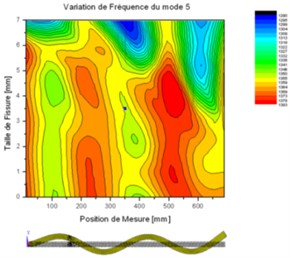
The frequency distribution along the length of the beam ( 0.7 m) is obtained from the measured FRF at different spaced points in the beam (Fig. 1). From the 2D experimental frequency distribution of the modes 3 and 5 (Fig. 14), it was observed that the frequency varies along the length of the beam and it gets maximum around the modal nodes and it becomes minimum around the anti nodes of the corresponding mode, the natural frequency variation in the vicinity of these two points depends on the crack sizing. And the frequency starts to decrease in the vicinity of the position of the crack ( 150 mm) and this crack effect extended and reaches the frequency value in the modal nodes that are close to the crack position.
The location of the crack is identified by the research of a largest local decrease of the natural frequency at all points included the modal nodes. The strategy is to find two points on the beam (two successive modal nodes) between them the crack is located by looking for those that have the largest decrease in frequency distribution for several modes.
Fig. 142D measured frequency distribution of modes 3 and 5
4.6. Mode shapes change
Figs. 15 and 15(b) give respectively the appearance of the second and third measured mode shapes of prismatic beam 0.7 m) with single crack located at point 150 mm ( 0.214). It is seen that mode shapes change is unusable and more difficult to use it even for severe levels of crack. And it is hard to extract from them more than the indication that the crack can be localized in one half left or right of the beam.
Fig. 15Measured mode shape 2 and 3: comparison for intact and damaged beam
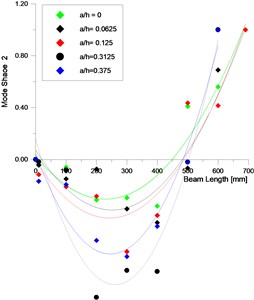
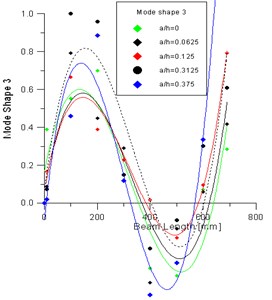
Therefore, the difference in modal experiments displacement clearly does not give a good indication of damage location in all damage cases. These observations were also noticed in other works in the literature [31-33].
5. Damage localization analysis using change of modal strain energy
The change in experimental displacement mode shapes is not indicated in the region of damage and hence, they do not give indication of the location of damage very precisely. Therefore, the use of methods based in other modal parameters is necessary to detect and pinpoint a damage location, that’s why in this study a method using change of Modal Strain Energy of damaged beam is proposed.
The first seven modes shapes obtained from the FEM analysis are used to calculate the MSECR applying Eq. (2), for example, the histogram plot of MSECR computed for mode 4 and damage depth 0.25 is shown in Fig. 16. The normalized MSECR values in actual crack position ( 0.214) for all cases of damage and for each mode is given in the Table 1, the value 1 means that the MSECR indicates clearly the damage location with error ±2.5 %.
Table 1Unitary normalized MSECR – FEM values
Mode 1 | Mode 2 | Mode 3 | Mode 4 | Mode 5 | Mode 6 | Mode 7 | |
0.0625 | –22.451 | –0.607 | 1 | 1 | 1 | 0.979 | 1 |
0.125 | –22.627 | –1.015 | 1 | 1 | 1 | 0.970 | 1 |
0.1875 | –22.278 | –1.214 | 1 | 1 | 1 | 0.964 | 1 |
0.25 | –21.882 | –1.509 | – | 1 | 1 | 0.961 | 1 |
0.375 | –21.049 | –2.311 | 1 | 1 | 0.819 | 0.977 | – |
0.625 | –18.709 | –3.298 | 1 | 0.649 | 0.0296 | 1 | 0.972 |
In Fig. 16, the peaking up of MSECR can be seen around the damage location (third division); the error localization is close to ±2.5 %. When the damage depth exceeds 37.5 %, the error localization becomes more than ±7.5 %. The MSECR plots for modes 3, 5 and 7 indicate also clearly the damage location with error ±2.5 % for damage depth 37.5 %.
From these results, it is found that the MSECR computed for the mode 3 and mode 4 gives a good damage indication. MSECR computed for mode 1 and mode 2 (Table 1 and Fig. 17) is not be able to detect and localize damage zone in beam very precisely in all cases of levels damage. The predicted damage is located between 0 and 0.214, the localization error is 12.5 %. The reason of the deviation of the MSECR peak from the crack location to the fixed end of the beam is due to the fact that the fundamental mode possesses high stiffness near the fixed end of the beam that swished the detection results; this is related to the boundary conditions of the beam.
Fig. 16FEM-MSECR for mode 4 and a/h= 0.25
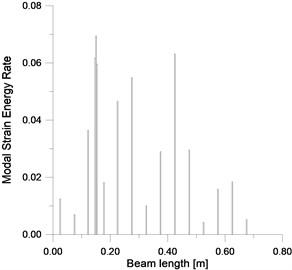
Fig. 17FEM–MSECR for mode 1 and a/h= 0.187
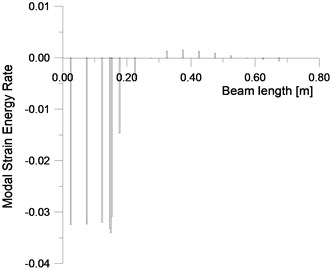
It is noted that the localization results are less accurate when the level damage becomes important, the raison is due to fact that the assumption concerning the equality of the modal stiffness of the intact element and cracked element in the Eq. (2) is not valid.
The effect of increase in the size of damage on MSECR can be seen in Fig. 18. It is clear that MSECR value computed for example for mode 7 is high (peak) around the damage location and the area under the peak MSECR is increased due to increase in the damage size.
From the results of the Average Normalized MSECR applying Eq. (3), it is found that this index is not able to localize damage zone on beam very precisely when all modes 1 to 7 is considered and in all cases of beam levels damage. The maximum peak deviates from the crack location to the fixed end of the beam; the error localization is around ±12.5 %.
In Fig. 19 it is found that the ANMSECR calculated with modes 2, 3, ..., to 7 can clearly determine where the crack damage occurs (element 3); it is very closer to the actual damage location. The error in the prediction of crack location is ±2.5 %, and it proved that the ANMSECR method computed without the disturbing mode has a higher accuracy. In this case, when the crack position is closer to fixed end, the disturbing mode is the mode 1.
Fig. 18FEM-MSECR for mode 7
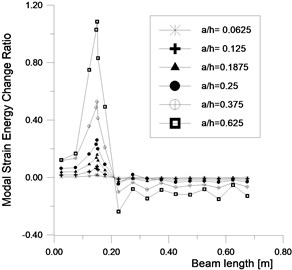
Fig. 19FEM-AMSECR for a/h= 0.187
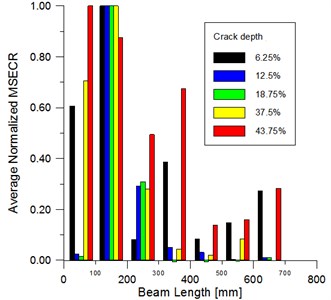
From the experimental modal analysis results, the prediction of crack location by the used the unit damage index MSECR for the first seven modes is shown in Fig. 20; it shows that when the mode 4 is used, one peak of the damage indices occurs around the crack position. The prediction with this mode gives a good indication of the position of the crack with error around ±7 % and this for crack level ≤37.5 %; the raison is due to the fact that this mode has less fluctuation and thus less noise as shown respectively in Fig. 12 and Fig. 13 and the local modal stiffness reduction is insignificant in manner that the Eq. (2) assumption is always valid.
For the other modes shapes used to compute the MSECR, i.e. the first 1, 2, 3, 5, 6, and 7 mode, a small peaks of damage indice appear around the surface crack location; but the maximum peak deviates from the crack location, the error localization is more than ±14 %. The raison of this deviation is due to the combined effect of the beam boundary conditions, the effect of depth crack and the effect of the measurements noise.
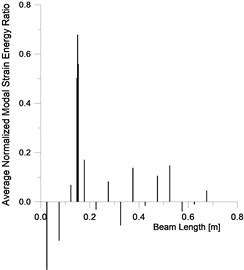
The localization damage index ANMSECR obtained from the summation of unit index is used to intensity the signal of damage by reducing the impact of random noise including in the experimental mode shapes. Figs. 21-22 show the average damage index for the first seven modes ( 1, 2,…, 7) for the crack depth extending from 6.25 % to 37.5 %. The ANMSECR exhibits a change in local region and maximum value (peak) is noticed around the crack location in second division of the beam. One notices that the ANMSECR method detects early and indicates the location of damage with error around ±7 %. The value of this uncertainty can be reduced by increasing the number of the measurement points of modes shapes (more sampling points). The localization becomes less accurate when the crack depth is more than 37.5 %, the localization uncertainty is ±14 % for the crack case 42.5 % (Fig. 23).
The comparison of the numerical simulation and experimental results prove that the proposed method based in modal strain changes rate is more reliable in identifying the damage location. However, both investigations have different degrees of uncertainties. The numerical results indicate that these uncertainties are due to the many aspects such as non linearity caused by the extent of damage, the crack position compared to that of modal nodes, the boundary conditions, the number of the modes used and the number of meshing division employed in the simulation. In the experimental investigation, the localization results are less accurate than numerical results; the raison is due to the reduced number of measurement points and the measurement noise which was inevitable during signal acquisition. The resolution of damage index can be magnified and the results uncertainty can be reduced by the use a more sampling measured points and by summing up all damage indices measured at different modes in order to reduce the effect of the measurements noise.
Fig. 20MSECR of all damage case and for each mode
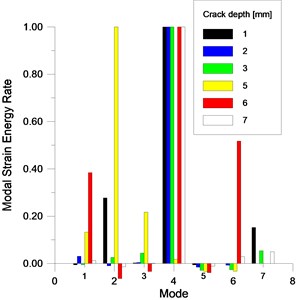
Fig. 21EMA – ANMSECR for damage cases 6.25 %, 12.5 %
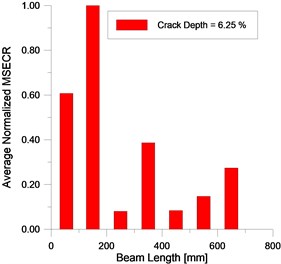
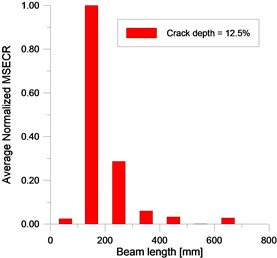
Fig. 22EMA – ANMSECR for damage cases 37.5 % and 43.75 %
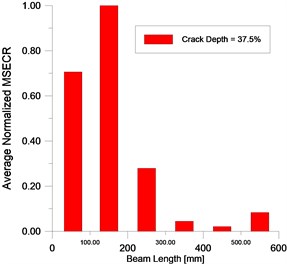
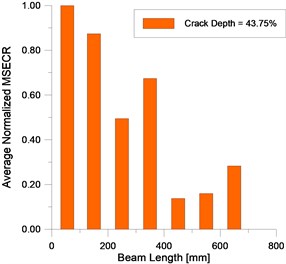
Fig. 23EMA – ANMSECR for all damage cases
6. Conclusions
This paper discusses the experimental applicability of the natural frequency distribution and modal strain energy ratio based methods in damage identification and localization in beam like structures. Results from experiment examples on a single-crack in cantilever beams are investigated and indicated that the natural frequency distribution method can approximate the damage area. The measurement frequencies fluctuation is studied and the improvement of frequency sensitivity is proposed by changing the accelerometer location and by using a signal analyzer with good performance. The results obtained showed an improvement of the sensitivity compared with the case of the sensor position 0.98; the sensitivity of the fundamental mode recorded an improvement of 6 %.
The MSECR based method was applied successfully on finite element generated data and on experimental data at the low damage severity and for the non fundamental modes. The method is distinguished by its ease of application; it requires only the information of a few mode shapes changes. Crack with depth as small as 7 % of the beam height has been detected and localized with the uncertainty equal to ±7 % by using the Average Normalized MSECR to reduce the impact of random noise including in the experimental mode shapes. It is concluded that the method that use modal strain energy ratio is more sensitive to local damage than others change frequency or mode shapes based methods.
References
-
Seyedpoor S. M., Yazdanpanah O. An efficient indicator for structural damage localization using the change of strain energy based on static noisy data. Applied Mathematical Modeling, Vol. 38, 2014, p. 2661-2672.
-
Doebling S. W., Farrar C. R., Prime M. B. A summary review of vibration-based damage identification methods. Shock and Vibration Digest, Vol. 30, Issue 2, 1998, p. 91-105.
-
Qiao P., Cao M. Waveform fractal dimension for mode shape-based damage identification of beam type structures. International Journal of Solids and Structures, Vol. 45, 2008, p. 5946-5961.
-
Salawu O. S. Detection of structural damage through changes in frequency: a review. Engineering Structures, Vol. 19, Issue 9, 1997, p. 718-723.
-
Vandiver J. K. Detection of structural failure on fixed platforms by measurement of dynamic response. Journal of Petroleum Technology, Vol. 29, 1977, p. 305-310.
-
Cawley F., Adams R. D. The locations of defects in structures from measurements of natural frequencies. Journal Strain Analysis, Vol. 14, Issue 2, 1979.
-
Stubbs N., Osegueda R. Global Non-Destructive Damage Evaluation in Solids, Modal Analysis. The International Journal of Analytical and Experimental Modal Analysis, Vol. 5, 1990, p. 67-79.
-
Dimarogonas A. D. Vibration of cracked structures: a state of the art review. Engineering Fracture Mechanics, Vol. 55, Issue 5, 1996, p. 831-857.
-
Doebling S. W., Farrar C. R., Prime M.B. Damage identification and health monitoring of structural and mechanical systems from changes in their vibration characteristics: a literature review. Los Alamos National Laboratory Report LA-13070-MS, Los Alamos, New Mexico, 1996.
-
Chinchalkar S. Detection of the crack location in beams using natural frequencies. Journal of Sound and Vibration, Vol. 247, 2001, p. 417-429.
-
Wang X., Hu N., Hisao F., Yao Z. H. Structural damage identification using static test data and changes in frequencies. Engineering Structures, Vol. 23, 2001, p. 610-621.
-
Owolabi G. M., Swamidas A. S. J., Seshadri R. Crack detection in beams using changes in frequencies and amplitudes of frequency response functions. Journal of Sound and Vibration, Vol. 265, 2002, p. 1-22.
-
Patil D. P., Maiti S. K. Experimental verification of a method of detection of multiple cracks in beams based on frequency measurements. Journal of Sound and Vibration, Vol. 281, 2005, p. 439-451.
-
Hong T. K., Norhisham B., Azrul M., Rosli A. Vibration based damage detection using modal data: an experimental verification. Jurnal Teknologi, Vol. 56, 2011, p. 31-44.
-
Stubbs N., Kim J. T., Tople K. An efficient and robust algorithm for damage localization in offshore platforms. Proceedings of the 10th ASCE Structures Congress, USA, 1992, p. 543-546.
-
Stubbs N., Kim T., Farrar C. R. Field verification of a non-destructive damage localization and severity estimation algorithm. Proceedings of the 13th International Modal Analysis Conference, USA, 1995, p. 210-218.
-
Yan W. J., Ren W. X., Huang T. L. Statistic structural damage detection based on the closed-form of element modal strain energy sensitivity. Mechanical Systems and Signal Processing, Vol. 28, 2012, p. 183-194.
-
Shi Z. Y., Law S. S., Zhang L. M. Structural damage detection from modal strain energy change. Journal of Engineering Mechanics, Vol. 126, 2000, p. 1216-1223.
-
Shi Z. Y., Law S. S., Zhang L. M. Improved damage quantification from elemental modal strain energy change. Journal of Engineering Mechanics, Vol. 128, Issue 5, 2002, p. 521-529.
-
Shi Z. Y., Law S. S. Zhang L. M. Structural damage localization from modal strain energy change. Journal of Sound and Vibration, Vol. 218, Issue 5, 1998, p. 825-844.
-
Cornwell P., Doebling S. W., Farrar C. R. Application of the strain energy damage detection method to plate-like structures. Journal of Sound and Vibration, Vol. 224, Issue 2, 1999.
-
YujinHun L. L., Wang X. Numerical methods for evaluating the sensitivity of element modal strain energy. Finite Elements in Analysis and Design, Vol. 64, 2013, p. 13-23.
-
Seyedpoor S. M., Yazdanpanah O. An efficient indicator for structural damage localization using the change of strain energy based on static noisy data. Applied Mathematical Modelling, Vol. 38, 2014, p. 2661-2672.
-
Li H. J., Yang H. Z., Hu S. L. J. Modal strain energy decomposition method for damage localization in 3D frame structures. Journal of Engenneering Mechanics, Vol. 132, Issue 9, 2006, p. 941-951.
-
Stubbs N., Sikorsky C., Park S. C., Bolton R. Verification of a methodology to nondestructively evaluate the structural properties of bridges. Structural Health Monitoring, Stanford University, Palo Alto, California, 2000, p. 440-449.
-
Ge X., Yunju Y., Huanguo C. Complex damage detection method based on CMSE and nichega. Journal of Vibration and Shock, Vol. 26, 2007, p. 84-86.
-
Hsu T. Y., Loh C. H. Discussion on damage detection of a 3-D frame using modal strain energy change. Proceedings of IMAC XXIV, St. Louis, Missouri, USA, 2006.
-
Harris C. M., Piersol A. G. Shock and Vibration Handbook. Fifth Edition. McGraw-Hill, USA, 2002.
-
Hassani H., Mahmoudv R., Yarmohammadi M. Filtering and denoising in linear regression analysis. Fluctuation and Noise Letters, Vol. 9, Issue 4, 2010, p. 343-358.
-
Dougdag M., Ouali M., Mellel N., Attari K. Detection of cracks in steel beams: a new approach by scanning vibration measurements. Comptes Rendus Mécanique, Vol. 8, 2014, p. 437-449, (in French).
-
Guan H., Karbhari V. M. Improved damage detection method based on element modal strain damage index using sparse measurement. Journal of Sound and Vibration, Vol. 309, 2008, p. 465-494.
-
Zou Y., Tong L., Steven G. P. Vibration-based model-dependent damage (delamination) identification and health monitoring for composite structures a review. Journal of Sound and Vibration, Vol. 2, 2000, p. 357-378.
-
Alvandi A. Contribution to the practical use of the dynamic assessment for the damage detection in bridges. Ph.D. Thesis, École National des Ponts et Chaussées, Marne la Valée, France, 2004, (in French).
About this article
