Abstract
With the functions of amplitude amplification, impedance matching and protecting the transducer in ultrasonic machining system, ultrasonic horn is an important component in design of power ultrasonic vibration system. A new horn with large amplitude is designed. The profile of the horn is a cubic Bezier Curve. Based on genetic algorithm, the horn with large vibration amplitude ratio was obtained by optimizing the control points at the starting point and the end point of Bezier Curve. Simulation comparison was also carried out on the vibration performances of other four kinds of horns. Bezier horn and conical horn were manufactured by numerical control (NC) technology, in addition, measurement and comparison were carried out on their performances by combining with a vibrator. Results show that the amplitude of the optimized Bezier horn is 73.5 % larger than that of conical horn. Under the excitation voltage of 200 , the amplitude of the Bezier horn can reach 108 µm.
1. Introduction
With the functions of amplitude amplification, impedance matching and protecting the transducer in ultrasonic machining system, ultrasonic horn is an important component in design of power ultrasonic vibration system [1]. Horn with large amplitude are increasingly widely applied in various ultrasonic applications, such as ultrasonic operation [2], ultrasonic motor [3], ultrasonic wave lubrication [4] and ultrasonic welding [5] etc. According to different shapes of horn, the ultrasonic horns can be divided into stepped [6], exponential [7], conical [8], catenary [9] and constant stress [10] etc. Salmon [11] et al. designed an exponential horn by exponential function. They pointed out that the horns whose profiles were not straight lines often had higher amplitude compared with traditional horns.
Commonly used horns mainly include stepped-shaped, conical, exponential and Gaussian-shaped [12] horns. Abromov [12] pointed out that under the same shape factors, the amplitude amplification coefficient of a conical horn is larger than that of an exponential horn and less than that of a stepped-shaped horn. Although stepped-shaped horn has large amplification coefficient of amplitude, it is prone to fracturing as it has larger stress due to its mutated cross-sectional area. Therefore, it’s not applicable to ultrasonic applications with large amplitude [10]. Horns with constant stress [10] have both comparatively large amplitude and small stress. Theoretically, the amplitude of horns with equal stress is larger than that of stepped-shaped horn. However, horns with constant stress are more complicated and are expensive in terms of both design and processing. Table 1 shows the comparison of advantages and disadvantages of commonly used horns. New design methods are required in order to design horns with both large amplitude and small stress.
Common design methods for horns include analytical method [1], equivalent circuit method [13] and equal mechanical impedance [14], transfer matrix method [15] and finite element method [16]. Various parameters of the horns can be obtained by traditional analytical methods subject to complicated calculation [17]. With the development of computer technology and the perfection of finite element theory, making use of finite element can not only accurately calculate the various parameters of complicated shaped horns, but also simplifies the calculation process significantly. Designing horns by means of parameterization curve and finite element technology is a new design method [18]. Large amplitude ratio can be acquired and it’s easy to process. Parameterization curve can flexibly adjust the cross-section shape of the horns by adjusting various parameters, thus obtaining the horns with required amplitude ratio and frequency.
In this paper, a new ultrasonic horn with large amplitude is designed based on Bezier parameterized curve. The profile of the horn is a cubic Bezier Curve. The horn with the maximum amplitude ratio under certain frequency was acquired by multi-objective optimization design genetic algorithm. The vibration state of the horn was analyzed by means of ANSYS finite element. The curve of detailed stress and displacement distribution were obtained. The horn was manufactured by means of numerical control technique (NC). Its amplitude was measured under the microscope. Meanwhile, the accuracy of the theoretical design was verified by comparing the vibration conditions of horns with different shapes.
Table 1Advantages and disadvantages of several commonly used horns
Shape | Advantage | Disadvantage |
Stepped-shaped | Large amplification coefficient of amplitude | Stress concentration, prone to fracturing |
Exponential | Uniform stress distribution | Comparatively small amplification coefficient of amplitude |
Conical | Simple design and processing, comparatively low cost | Comparatively small amplification coefficient of amplitude |
Catenary | Comparatively large amplification coefficient of amplitude, comparatively uniform stress distribution | Medium amplification coefficient of amplitude |
Gaussian-shaped | Maximum shape factor, the maximum amplitude can be acquired theoretically | Comparatively complicated design and processing, comparatively high cost |
Bezier Curve | Good matching of amplification coefficient of amplitude and stress distribution | Comparatively complicated design and processing, high cost |
2. Design of ultrasonic horns
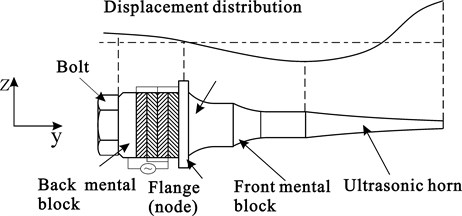
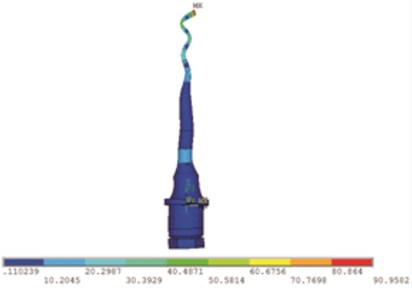
Fig. 1 shows the piezoelectric transducer system composed of Langevin vibrator and horn, where the Langevin vibrator is made of four pieces of piezoelectric ceramic rings, front mental block, back mental block, flange and bolt etc. The flange is located at the node of the system’s vibration, for the purpose of fixing the system. The working frequency of Langevin vibrator is 53.7 kHz, and it works under first-order longitudinal vibration mode. The horn is made to work under first-order longitudinal vibration mode by reasonably designing its shape. The curve of displacement distribution of the entire system is shown in Fig. 1.
Fig. 1Schematic of Langevin vibrator and horn
To acquire a new ultrasonic horn with large amplitude amplification ratio, the profile of the horn was designed to be a cubic Bezier Curve. The horn with the maximum amplitude ratio under the frequency 53.7 kHz was determined by means of genetic algorithm. The cubic Bezier Curve is determined by the following four points: starting point , control point of starting point , control point of end point and end point , as shown in Fig. 2. The starting point and end point are determined by the radiuses ( and ) of the top and end of the horn and its length , while the curve shape is determined by the control point of starting point and control point of end point . Bezier Curve is shown as follow:
where is the parameter, and are the lateral and longitudinal coordinates of point respectively.
Fig. 2Bezier profile curve and its four control points M0, M1, M2 and M3
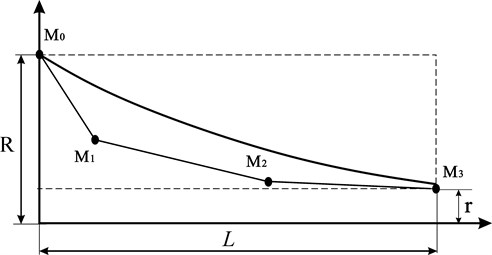
The horn is axisymmetric. The optimized horn can be acquired by optimizing the positions of control point and in Fig. 2. The optimization design is carried out by means of Non-dominated Sorting Genetic Algorithm which can be used for solving multi-objective constraint problems. Non-dominated sorting genetic algorithm is used to the optimization of the horn profile. The following are performed in each generation of the genetic algorithm evolution process.
1) Select the parents: parents, which are fit for reproduction, are selected for reproduction to generate offspring. The genetic algorithm uses a binary tournament selection and the crowded-comparison operator. In the binary tournament selection process, two individuals are selected at random and their fitness is compared. The individual with better fitness is selected as a parent. The crowded-comparison operator guides the selection process at the various stages of the algorithm toward a uniformly spread-out Pareto-optimal front.
2) Perform crossover and mutation operator on the selected parents: the algorithm uses simulated binary crossover and polynomial mutation.
3) Perform selection from the parents and the offspring: once the population is sorted based on the non-dominated sorting algorithm, only the best solutions are selected.
4) Replace the unfit individuals with the fit individuals to maintain a constant population size.
During the optimization, the working frequency , radiuses ( and ) at the top and end of the horn as well as the are defined first. The objective function of the optimization design is:
where is the first-order resonant frequency acquired from each generation of calculation, is the amplitude amplification ratio.
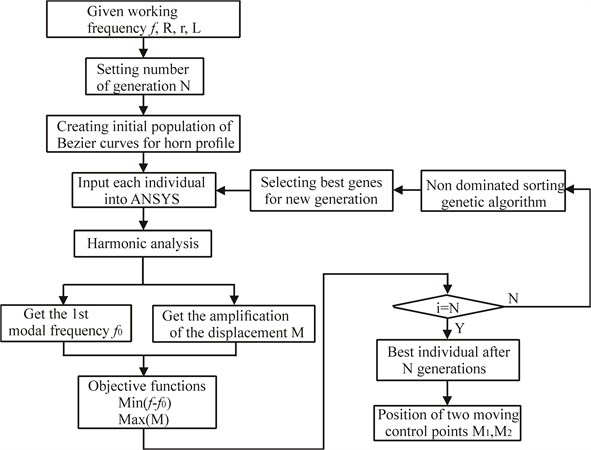
The genetic algorithm optimization procedure used in this investigation is programmed with the commercial software MATLAB 7.0. The shape of the horn was obtained by controlling the positions of design variables and . Finally, it was imported into finite element analysis software to calculate and acquire the resonant frequency and amplitude amplification ratio of each generation of horns. The optimized solution was acquired and saved by judging and comparison.
Fig. 3Flowchart of the optimization procedure
3. The optimized horn
3.1. Finite element analysis model
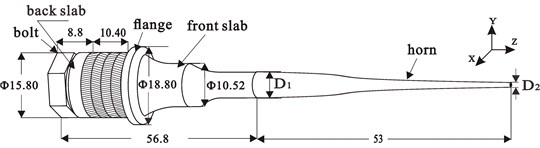
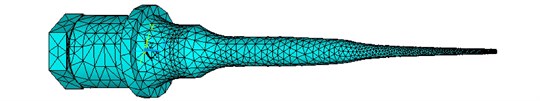
The vibration mode of the transducer was analyzed by ANSYS software to obtain the frequency and vibration conditions of the horn. Fig. 4(a) shows the Langevin vibrator and Bezier horn as well as their three-dimensional sizes. The diameters of the top and the end are and , its length is . Fig. 4(b) shows the mesh generation diagram in ANSYS modal analysis. In the mesh generation, the element type of piezoelectric ceramic ring is 20-node hexahedral solid226, while other parts are 20-node hexahedral solid95.
Fig. 4a) Schematic of assembly, b) mesh generation for three-dimension finite element model
a)
b)
Before modal analysis, point coupling was carried out on the surface of piezoelectric ceramics, with voltage applied. The front and back block as well as the bolt of Langevin vibrator are all made of ideal linear elastic materials. The front and back block are made of stainless steel and aviation aluminum respectively, and the bolt and horn are made of titanium alloy. The piezoelectric ceramics are made of four piezoelectric ceramic rings polarizing along direction. The polarization directions of any two adjacent ceramic rings are opposite. The parameters of the materials are as shown in Table 2.
Table 2Piezoelectric ceramics (PZT-4), 7075-T651 aluminum, 303 stainless steel, and TC4
Material | Properties | Tensor (, , , , , ) |
PZT-4 | Piezoelectric constant matrix (C·m-2) | |
Rigidity matrix (1010×N·m-2) | ||
Dielectric constant (F m-1) | ||
Density (kg m-3) | 7500 | |
Aluminum (7075-T651) | Young’s modulus (GPa) | 71.1 |
Poisson’s ratio | 0.33 | |
Density (kg m-3) | 2810 | |
303 stainless steel (Y1Cr18Ni19) | Young’s modulus (GPa) | 200 |
Poisson’s ratio | 0.28 | |
Density (kg m-3) | 7840 | |
TC4 Titanium alloy | Young’s modulus (GPa) | 110 |
Poisson’s ratio | 0.33 | |
Density (kg m-3) | 4430 |
3.2. Numerical analysis
In genetic algorithm process, the number of generations was set as 30, and the population of each generation was taken as 20. In the calculation, 40, 50, 60, 70 and 80 were also calculated. However, the calculation results were not improved. Therefore, 30 was set in the design. The length of the horn as well as the diameters of its top and end and were 53 mm, 6.36 mm and 1 mm respectively. The working frequency was determined by Langevin vibrator. It was a constant value of 53.7 kHz. In the design, each individual was subject to modal analysis and harmonic response analysis, and the first-order resonant frequency and amplitude amplification ratio were obtained. Fig. 4 shows the normalized frequency response curve between the vibrator and the horn under longitudinal excitation. In the frequency range of 0-100 kHz, there are three longitudinal resonant frequencies in the system, including 53.87 kHz, 63.80 kHz and 82.43 kHz. It’s obvious that the amplitude of longitudinal vibration with the frequency of 63.80 kHz is larger than the amplitude of the vibration with the frequencies of 53.87 kHz and 82.43 kHz. However, when the excitation frequency of the system approaches to 53.87 kHz, the second-order longitudinal frequency will not be excited. In the range of 0-100 kHz, the transducer system composed of vibrator and horn also presents other response modes. However, other modal responses are small, so only the 3 longitudinal resonant modes among them are given.
Fig. 5Normalized frequency response curve
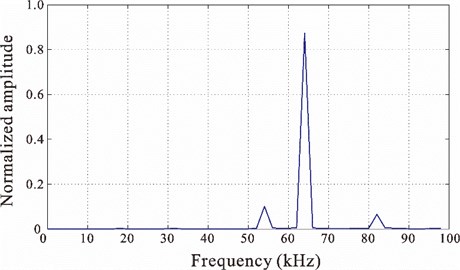
Fig. 6Three modes surrounding the working frequency
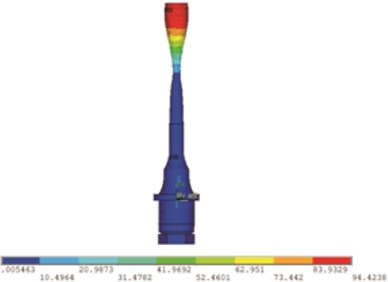
a) 49.41 kHz
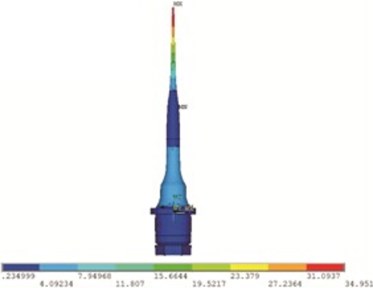
b) 53.87 kHz
c) 58.19 kHz
Fig. 6 shows the frequency of 56 kHz as well as the 3 inherent modes surrounding it, including bending vibration (Fig. 6(a)), longitudinal vibration (Fig. 6(b)) and torsional vibration (Fig. 6(c)). They are far different from surrounding modal frequencies (exceeding 8 %). Therefore, these interferential modes are assumed as not existing in actual work. This assumption was verified in subsequent experiment. Fig. 7 shows the population distributions of several generations in the optimization design (the 10th generation, the 20th generation and the 30th generation). The horizontal ordinate is , and the vertical coordinates is amplitude amplification ratio, i.e., the ratio between the amplitudes at the top and the end of the horn. According to the figure, when the algorithm enters the 30th generation, the amplitude amplification ratio will increase significantly.
Fig. 7Population distribution of several generations in the optimization design
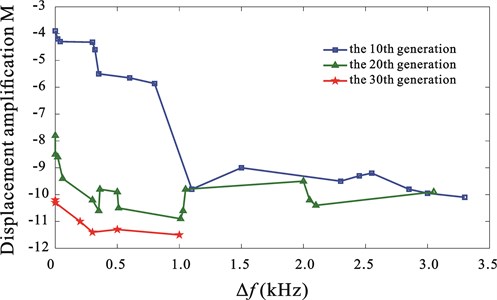
Fig. 8Curve of profiles of the four horns
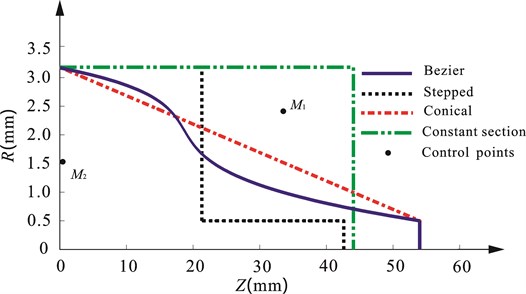
Fig. 8 shows an optimized Bezier horn acquired as well as the positions of its four control points. To compare the designed Bezier horn and horns with other shapes, the researchers designed stepped-shaped and conical horns with the same inherent frequency and area factors as the Bezier horn, and designed constant section horns with the same inherent frequency as the Bezier horn. Fig. 8 also lists the profile curves of these three horns. The length of stepped-shaped horn is 42 mm, the area change position is located in the middle of the horn (21 mm). Fig. 9 shows the curve of distribution of vibration displacements along the normalized length of the horns based on finite element calculation. It shows that the amplitude amplification of the designed Bezier horn is about 1.73 times as large as the amplitude amplification of the conical horn. Fig. 10 shows the curve of equivalent stress distribution along the normalized length of the four horns based on finite element calculation. For stepped-shaped horn, its stress mutation reaches the maximum value at the area mutation position. The stress of Bezier horn is comparatively small and uniform compared with that of others. This benefits from its shape which is close to “campaniform”, and its stress distribution matches well with its cross-sectional area. Table 3 lists the amplitude amplification times and the maximum equivalent stress of the four horns. Although the stepped-shaped horn has large amplitude, its maximum stress is also very large. With the increase of excitation voltage, it will fracture first; while Bezier horn has high amplitude amplification times and small stress simultaneously.
Fig. 9Distribution of vibration displacements along the normalized length of the horns
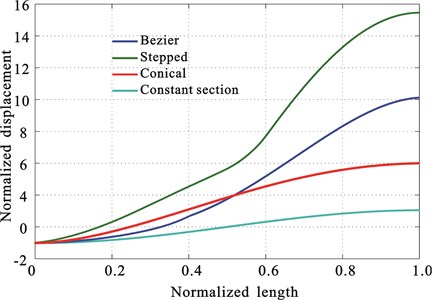
Fig. 10Equivalent stress distribution along the normalized length of the horns
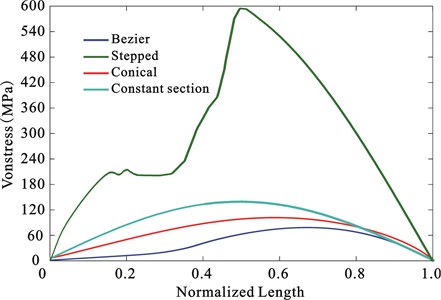
Table 3Comparison of the four types of the horns
Shape | Length | Amplification coefficient | (MPa) | |
Bezier | 6.36 | 53 | 10.2 | 595.5 |
Stepped-shaped | 6.36 | 42 | 15.4 | 68.3 |
Conical | 6.36 | 53 | 5.9 | 98.7 |
Constant section | 1 | 45 | 1 | 144.2 |
4. Experimental measurement
The model of the optimized horn was built by UG, which was assembled with vibrator, as shown in Fig. 11. It was manufactured by numerical control technology. Firstly, the admittance and phase curve (analysis frequency range of 48-58 kHz) of the transducer vibration system was measured by LCR-8101 precise impedance meter under small signal excitation (1). As shown in Fig. 12, its harmonic frequency is 53.167 kHz, which is 1.3 % less than the ANSYS numerical calculation result (53.87 kHz). There is only one resonance peak in the analysis frequency range, which is conducive to restraining other vibration modes in the system from disturbing the required vibration mode.
As the amplitude exceeds 10 µm, the amplitude can be directly observed at the vibration end face with long-focus microscope. The schematic diagram of the measurement device is as shown in Fig. 13. The sinusoidal signal output by the signal generator (RIGOL DG1022) was switched in the vibrator via power amplification (LM3886). The signal frequency was adjusted, and the voltage signal of the input vibrator was observed by digital oscilloscope (RIGOL DS 5022) to make the ultrasonic transducer work under resonant state. The vibration image of the output of the horn was transmitted to PC via microscope digital camera (DCM136). The vibration conditions of the ends of the horn were displayed by software on a real-time basis (ScopePhoto3.0).
Fig. 11Model of Bezier horn and Langevin vibrator system
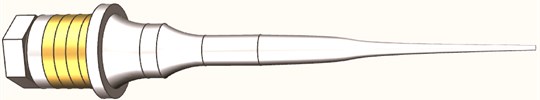
Fig. 12Admittance and phase curve
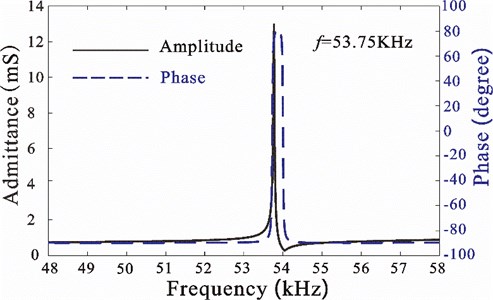
Fig. 14(a) and Fig. 14(b) show the vibration conditions of the ends of the Bezier horn under static state and resonant state as observed by microscope. Through comparison, it’s obvious to judge that the vibration of the horn is longitudinal vibration, while bending vibration and torsional vibration are very small. According to Fig. 14(b), the tracing and measurement for the marked point show the vibration displacement of the horn. To carry out comparison, conical horn was processed and measured simultaneously, with the resonant frequency of 53.65 kHz. Under the excitations of corresponding resonant frequencies, the relationship between the two horns and the voltage is as shown in Fig. 14. The figure shows that the amplitudes of the horns all increase with the increase of the voltage. Under the same excitation, the average amplitude of Bezier horn is 73.5 % larger than that of conical horn. This is very close to the results from simulation (Table 3). This further verifies the reliability of the simulation results.
Fig. 13Schematic diagram of the experiment for ultrasonic horn
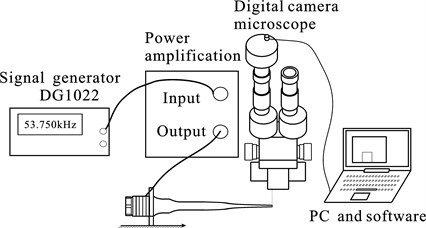
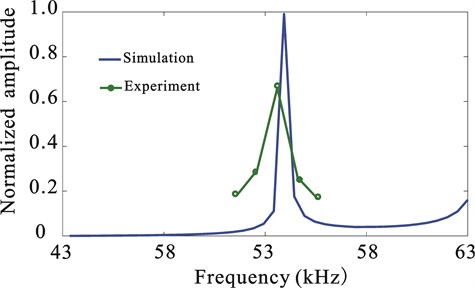
Fig. 16 shows the frequency response curves of the horn in simulation and experiment. The frequency of the designed horn is 53.87 kHz, while the experiment frequency is 53.167 kHz. The two are well consistent. The actual working frequency is slightly less than the frequency of finite element simulation due to many reasons: (1) the difference between actual and theoretical properties of the material, such as density and Young’s modulus, (2) errors due to processing, (3) failing to consider damping during simulation, but there is certain damping. If damping exists, the frequency of the system will be slightly less than that under non-damping condition. (4) With the work time progressing, the system will become heat, and the material properties will change, and the frequency will reduce.
Fig. 14Comparison between the static and dynamic vibration
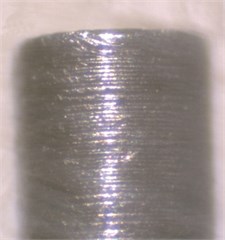
a) The static vibration image
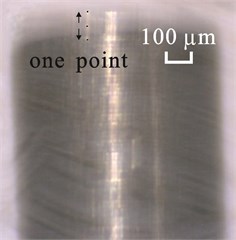
b) The dynamic vibration image
Fig. 15Relationship between the vibration amplitude and voltage
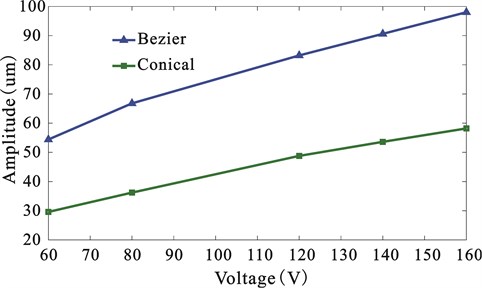
Fig. 16Frequency response curves of the horn
5. Conclusions
On the basis of analyzing and comparing the advantages and disadvantages of existing horns and from the perspective of improving the vibration amplitude of the ultrasonic horn, a horn with the profile of cubic Bezier Curve is designed by means of ANSYS software simulation and multi-objective genetic algorithm. The horn of this shape not only has large amplitude, but also has small stress distribution. Therefore, it is more practical. The transducer system composed of Langevin vibrator and Bezier horn is processed and measured. Meanwhile, a conical horn with the same frequency is also processed. The actually measured frequency is very close to the theoretical frequency. The vibration amplitude of the Bezier horn and conical horn are measured by optical microscope and relevant software. The experiment shows that when the excitation voltage is less than 160, the average amplitude of Bezier horn is 73.5 % larger than that of the conical horn. When the excitation voltage is 200, the amplitude of the system can reach 108um. The research integrates the methods such as finite element and optimization design etc., which is conducive to providing new thought for designing ultrasonic horn.
References
-
Lin Zhongmao Theory and Design of Ultrasonic Horns. Science Press, Beijing, 1987.
-
Charles S., Williams R., Poteat T. L. Micromachined structures in ophthalmic microsurgery. Sensors and Actuators A: Physical, Vol. 21, Issue 1, 1990, p. 263-266.
-
Liu Y., Liu J., Chen W., et al. A U-shaped linear ultrasonic motor using longitudinal vibration transducers with double feet. IEEE Transactions on Ultrasonics, Ferroelectrics and Frequency Control, Vol. 59, Issue 5, 2012, p. 981-989.
-
Iula A., Caliano G., Caronti A., et al. A power transducer system for the ultrasonic lubrication of the continuous steel casting. IEEE Transactions on Ultrasonics, Ferroelectrics and Frequency Control, Vol. 50, Issue 11, 2003, p. 1501-1508.
-
Parrini L. New techniques for the design of advanced ultrasonic transducers for wire bonding. IEEE Transactions on Electronics Packaging Manufacturing, Vol. 26, Issue 1, 2003, p. 37-45.
-
Jia Yang, Shen Jian-Zhong Frequency response of stepped ultrasonic horn. Technical Acoustics, Vol. 25, Issue 4, 2006, p. 154-159.
-
Feng Feilong, Zhu Xuning, Lin Shuyu Frequency modify of exponential horn. Journal of Shaanxi Normal University, Vol. 30, Issue 4, 2002, p. 47-49.
-
Tsujino J., Hongoh M., Tanaka R., et al. Ultrasonic plastic welding using fundamental and higher resonance frequencies. Ultrasonics, Vol. 40, Issue 1, 2002, p. 375-378.
-
Liu Yahui, Fu Zhiqiang Theoretical study and finite e1ement analysis of catenarv linear horn. Journal of Anhui University of Science and Technology, Vol. 31, Issue 4, 2011, p. 25-27.
-
Pan Qiaosheng, Liu Yongbin, He Lingguo, et al. Design of a horn for high amplitude of longitudinal vibration. Journal of Vibration, Vol. 33, Issue 9, 2014, p. 1-5.
-
Salmon V. A new family of horns. The Journal of the Acoustical Society of America, Vol. 17, 1946, p. 212-218.
-
Abramov O. V. High-Intensity Ultrasonics: Theory and Industrial Applications. CRC Press, 1999.
-
Wang F., Zhao X., Zhang D., et al. Development of novel ultrasonic transducers for microelectronics packaging. Journal of Materials Processing Technology, Vol. 209, Issue 3, 2009, p. 1291-1301.
-
He Xiping Simplified design methods for compound ultrasonic longitudinal vibrating horn. Journal of Lanzhou University (Natural Sciences), Vol. 38, Issue 5, 2002, p. 24-27.
-
Lesniewski P. Discrete component equivalent circuit for Webster’s horns. Applied Acoustics, Vol. 44, Issue 2, 1995, p. 117-124.
-
Yadava V., Deoghare A. Design of horn for rotary ultrasonic machining using the finite element method. The International Journal of Advanced Manufacturing Technology, Vol. 39, Issue 1-2, 2008, p. 9-20.
-
He Xiping, Gao Jie A review of ultrasonic solid horn design. Technical Acoustics, Vol. 25, Issue 1, 2006, p. 82-86.
-
Fu B., Hemsel T., Wallaschek J. Piezoelectric transducer design via multiobjective optimization. Ultrasonics, Vol. 44, 2006, p. 747-752.
About this article
