Abstract
This paper proposes a novel method of fuzzy analysis for bearing accelerated degradation testing, which extracts degradation index from bearing vibration signals under different accelerated levels and obtains fuzzy failure time based on fuzzy regression model in consideration of uncertainties. Identification of accelerated model is conducted through linear mixture model. The proposed method provides a methodology to do accelerated vibration analysis for rotating machinery products. An industrial application is used to verify its effectiveness.
1. Introduction
Rotating machinery parts, such as bearings and gears, are critical elements in airplane, automobile and other mechanical systems with the function of transferring mechanical energy to kinetic energy. The demand leads to new methods for monitoring their health status to avoid catastrophic events. During the past decades, methodologies like Condition-Based Maintenance (CBM) [1] and Prognostics and Health Management (PHM) [2] have been undertook and utilized both in academia and industry. The boost of those methods meets the needing of individual oriented product, not population that traditional reliability engineering concerns. The internal capability of products is qualified during the manufacturing phase. The use of field data to quantify its reliability status may lead to the growth of such capability.
Reliability prediction for mechanical products is not easier than electrical ones since their degradation index is hard to be traced through vibration signal. In general, feature extraction in time, frequency, time-frequency and information domains is conducted to find one specific index which can represent the health or degradation status, based on that remaining useful life prediction or reliability analysis will continue. Huang, et al. [3] used six vibration features to train the specific neural network and presented an error term from this network as a degradation index. Liao, et al. [4] proposed a machine degradation assessment based on fixed cycle features test using Gaussian Mixture Model (GMM) and presented an index named Confidence Value (CV) to reflect the degradation status by calculating the overlap rate between baseline (normal) state and current state. Once the task of degradation index is accomplished, various models, such as model-based, data-driven or hybrid models [5, 6], can be selected for specific purposes. However, for bearings experienced different operating conditions [7, 8], limited papers concentrate on the identification of accelerated model parameters which link the stress levels with the failure time. In addition, uncertainties of measurements [9] or degradation process modeling [10], etc., also need to be taken into consideration.
This paper proposes a novel method of fuzzy analysis for bearing accelerated degradation testing, which extracts degradation index from bearing vibration signals under different accelerated levels and obtains fuzzy failure time based on fuzzy regression method in consideration of uncertainties during the process. Identification of accelerated model is conducted through linear mixture model. The paper is organized as follows: Section 2 introduces the proposed method for bearing accelerated vibration signal analysis. Section 3 illustrates an application of bearing accelerated data from IEEE PHM 2012 challenge to validate the effectiveness of the proposed method. Conclusions are presented in Section 4.
2. Fuzzy analysis of vibration data for bearings
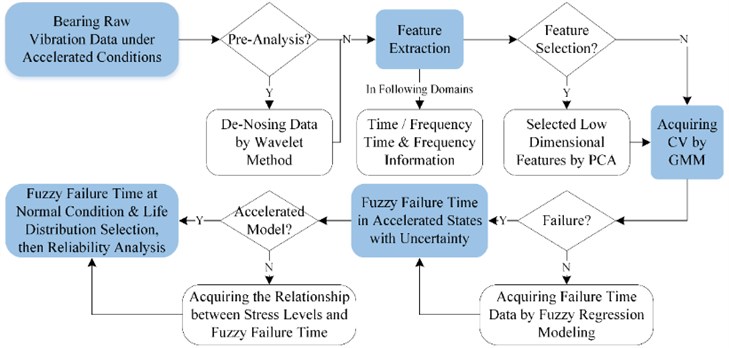
In this Section, the proposed fuzzy analysis of bearing accelerated vibration signal is shown in Fig. 1. The bearing raw vibration data is de-noised, if needed, by wavelet method to eliminate the influence of extra noise. After that, features in time, frequency, time-frequency and information domains, e.g. variance, mean square frequency, HHT energy, Hilbert marginal amplitude spectrum, will be extracted to reflect the overall information of vibration data. To facilitate the following calculation, high dimensional feature set will be transferred into lower one by Principal Component Analysis (PCA) method. Then, GMM is introduced to obtain the degradation index for bearing, i.e. CV, which will be compared with the failure threshold to judge whether the specific bearing is failure or not. Another approach is to model the path of CVs to extrapolate the failure times for all bearings. In this step, we assume that the uncertainties induced by measurements and signal processing are embodied in the failure times. Therefore, fuzzy regression method is selected to model the degradation path, and reliability analysis for accelerated failure data will be fuzzy intervals with alpha-cuts. The identification for acceleration factors will be highlighted in this paper.
Fig. 1The scheme of fuzzy analysis for bearing vibration signal under accelerated degradation testing
2.1. Degradation index
Motivated by [4], the combination of PCA and GMM is used for obtaining the CVs from bearing features in abovementioned domains. The main equations are:
where, is the -by- raw matrix for all extracted features, is the -by- eigenvector whose eigenvalues are in descending order with the cumulated percentage over 85 %, is the -by- lower dimensional feature set, is the number of Gaussian component which is set to 3 according to experience, is the weight of component , and is its Gaussian density function. Details about the estimation algorithms are referred to the references.
Once the GMM models for both baseline (normal) state and degraded state are obtained. The CV at state can be calculated by:
2.2. Degradation modeling and failure time
Fuzzy regression method is a powerful tool to model the degradation path containing the epistemic uncertainty by means of fuzzy theory. The model for the case study is selected as [10]:
where, and are constant, is the error term which follows normal distribution. Then, the (1-) 100 % confidence interval for parameters are regarded as the fuzzy estimators for parameters , which is:
and symmetric triangular membership function is used for fuzzy calculation for all -cuts, . Then, fuzzy parameters are given as . When the failure threshold is available, the corresponding fuzzy failure time is computed by the determined regression model.
2.3. Acceleration factors
Linear mixture model, i.e. acceleration model, is applicable to find the relationship between environmental variables, e.g. load, speed, and bearing fuzzy failure time [11]. The model is:
where, is the coefficient, 1, 2,…, 5, and donate speed and load for bearing operating conditions, is the fuzzy failure time under alpha-cuts.
When the optimal parameters for Eq. (5) are estimated, failure time at both normal and the ith stress level can be given as and . Then, the Acceleration Factor (AF) is:
which can convert fuzzy failure times under accelerated levels into normal ones, i.e. .
2.4. Fuzzy reliability analysis for bearings
Studies have suggested that the failure time of bearing follows Weibull distribution [12]:
where, is scale parameter, and is shape parameter. In general, reliability analysis, 1 is used for describing the wearout phase in the Bathtub-Shaped curve which should be satisfied since the bearings experienced a harsh operating environment. For fuzzy failure times, the fuzzy parameters, i.e. , , are obtained by life distribution fitting for .
Thus, the fuzzy reliability for time interval [, ] is:
If other life distribution is satisfied, e.g. Log-normal distribution, Eq. (8) can be rewritten to:
where, is the standard normal cumulative distribution function, while and are the mean and standard deviation for standard normal distribution.
3. Case study
In this section, an industrial application is given to illustrate the proposed method and verify its effectiveness to analyze the fuzzy reliability of bearing accelerated vibration data.
3.1. Experiment platform
Details about the experiment platform from IEEE PHM 2012 prognostic challenge are given in [8]. The aim of this competition is to estimate the remaining useful life time for 11 bearings by the learning set of 6 bearings under three operating conditions. However, this paper concentrates on the reliability analysis for bearings under accelerated operating levels with uncertainty from the perspective of population but not individual. Therefore, we ignore the bearings whose lifetimes are significant lower than others, i.e. 1_2, 1_4, 2_1, 2_7, for the following analysis. Meanwhile, only vertical vibration signals is used since it can better reflect the health state [13].
3.2. Fuzzy analysis results
Following the chart flow in Fig. 1, we extracted all the features in four domains and then reduced them by PCA with the cumulated percentage over 85 %. The CV results for the bearings are shown in Fig. 2.
Fig. 2The degradation processes for bearings under three accelerated levels with their fitted paths
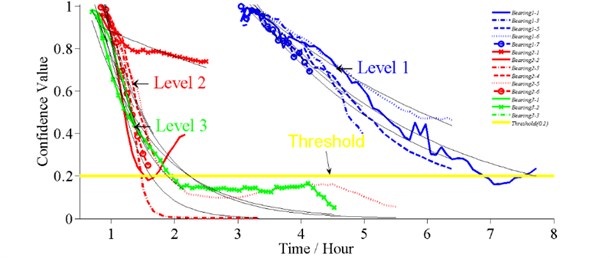
Table 1Fuzzy results for degradation model parameters
Bearing No. | (%) | (%) | AD (Error) | Fuzzy estimation | ||||||||
E | SE | E | SE | stat | ||||||||
1_1 | 3.389 | 0.189 | –0.367 | 0.013 | 95.4 | 95.3 | 0.067 | 0.68 | 3.087 | 3.719 | –0.389 | –0.346 |
1_5 | 3.646 | 0.244 | –0.402 | 0.016 | 95.2 | 95.1 | 0.051 | 0.74 | 3.258 | 4.081 | –0.430 | –0.375 |
1_6 | 2.376 | 0.057 | –0.264 | 0.006 | 98.5 | 98.4 | 0.189 | 0.51 | 2.282 | 2.474 | –0.274 | –0.255 |
1_7 | 2.648 | 0.225 | –0.312 | 0.024 | 93.5 | 93.0 | 0.423 | 0.35 | 2.276 | 3.081 | –0.358 | –0.272 |
2_2 | 3.314 | 0.922 | –1.483 | 0.243 | 73.3 | 71.5 | 0.598 | 0.29 | 2.035 | 5.398 | –1.976 | –1.112 |
[2_3] | 3.625 | 1.109 | –1.668 | 0.337 | 82.3 | 79.8 | 0.457 | 0.33 | 2.031 | 6.470 | –2.447 | –1.138 |
2_4 | 3.046 | 0.483 | –1.217 | 0.142 | 90.9 | 89.9 | 0.685 | 0.26 | 2.277 | 4.073 | –1.507 | –0.983 |
[2_5] | 2.753 | 0.307 | –1.319 | 0.109 | 94.0 | 93.5 | 0.062 | 0.68 | 2.260 | 3.355 | –1.527 | –1.140 |
2_6 | 4.309 | 0.742 | –1.629 | 0.162 | 94.1 | 93.4 | 0.874 | 0.20 | 3.129 | 5.936 | –1.960 | –1.353 |
3_1 | 2.200 | 0.251 | –1.054 | 0.120 | 92.6 | 91.5 | 0.256 | 0.43 | 1.772 | 2.731 | –1.306 | –0.850 |
[3_2] | 2.436 | 0.073 | –1.258 | 0.028 | 99.4 | 99.4 | 0.558 | 0.31 | 2.312 | 2.566 | –1.308 | –1.210 |
3_3 | 1.555 | 0.108 | –0.659 | 0.086 | 96.8 | 95.2 | 0.152 | 0.43 | 1.270 | 1.905 | –0.963 | –0.451 |
From Fig. 2, it is reasonable to set 0.2 as the failure threshold from the learning set (solid line), which then is used to compute the fuzzy failure times by Eqs. (3), (4) with 0.2. The results are given in Tables 1, 2. The statistical analysis for the error term to check the assumption of normal distribution and the fuzzy estimation for model parameters are also presented.
Note that: The degradation paths for 1_3, 2_3, 2_5 and 3_2 are not compromised with the normal assumption for error item of Eq. (3), although the and suggest good fitting. Hence, we eliminate bearing 1_3 and recalculate bearing 2_3, 2_5, 3_2 by cutting the tail of degradation path, which are given in brackets ([]).
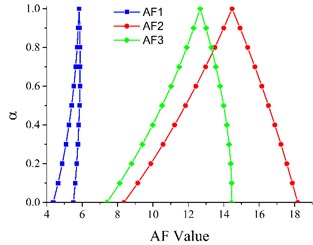
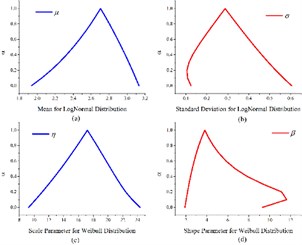
Eqs. (5), (6) are used to calculate the fuzzy acceleration factors (Fig. 3(a)) and convert the failure times into normal stress levels (Table 2). Anderson-Darling test is then used to select the applicable life distribution for failure times, and results suggest that both Weibull and Log-normal are suitable. The fuzzy parameters for the two distributions are shown in Fig. 3(b).
Table 2Fuzzy failure times under accelerated and normal conditions
Bearing No. | Fuzzy failure time | Operating conditions | Failure time in normal condition (1200 rpm, 3000 N) | |||
(h) | (h) | Speed (rpm) | Load (N) | (h) | (h) | |
1_1 | 3.0043 | 3.7377 | 1800 | 4000 | 13.1247 | 20.5803 |
1_5 | 2.7556 | 3.5638 | 12.0382 | 19.6230 | ||
1_6 | 3.8246 | 4.3285 | 16.7082 | 23.8334 | ||
1_7 | 2.8236 | 4.5584 | 12.3351 | 25.0990 | ||
2_2 | 0.4576 | 1.4125 | 1650 | 4200 | 3.8266 | 25.6726 |
2_3 | 0.3509 | 1.5199 | 2.9342 | 27.6247 | ||
2_4 | 0.6481 | 1.4308 | 5.4199 | 26.0051 | ||
2_5 | 0.6560 | 1.1269 | 5.4859 | 20.4816 | ||
2_6 | 0.5665 | 1.1636 | 4.7374 | 21.1490 | ||
3_1 | 0.6706 | 1.4383 | 1500 | 5000 | 4.9683 | 20.7613 |
3_2 | 0.8023 | 0.9278 | 5.9440 | 13.3932 | ||
3_3 | 0.6605 | 2.7064 | 4.8940 | 39.0662 | ||
Fig. 3a) Fuzzy acceleration factors under three different operating conditions, b) fuzzy parameters for two life distributions: Log-normal (.a, .b) and Weibull (.c, .d)
a)
b)
Fig. 4Fuzzy reliability under two life distributions at time interval [7, 8] (h)
![Fuzzy reliability under two life distributions at time interval [7, 8] (h)](https://static-01.extrica.com/articles/15422/15422-img5.jpg)
As described in the challenge details, most of the bearings exprience 1 (h) to 7 (h). Thus, we analyze the reliability under normal condition in interval [7, 8] (h) through Eqs. (8), (9) and the results are given in Fig. 4, which are [0.9177, 1] and [0.9405, 0.9989] for Log-normal and Weibull distributions when . For traditional analysis, the reliability is 0.9894 and 0.9792.
4. Conclusions
A novel method for the reliability analysis of bearing accelerated degradation testing is proposed in this paper. The proposed method can acquire degradation index from raw vibration data and conduct fuzzy reliability analysis for rotating machinery product with uncertainties.
References
-
Jardine A. K. S., Lin D. M., Banjevic D. A review on machinery diagnostics and prognostics implementing condition-based maintenance. Mechanical Systems and Signal Processing, Vol. 20, Issue 7, 2006, p. 1483-1510.
-
Lee J., Wu F., Zhao W., Ghaffari M., Liao L., Siegel D. Prognostics and health management design for rotary machinery systems – Reviews, methodology and applications. Mechanical Systems and Signal Processing, Vol. 42, Issue 1-2, 2014, p. 314-334.
-
Huang R., Xi L., Li X., Liu C. R., Qiu H., Lee J. Residual life predictions for ball bearings based on self-organizing map and back propagation neural network methods. Mechanical Systems and Signal Processing, Vol. 21, Issue 1, 2007, p. 193-207.
-
Liao L., Lee J. A novel method for machine performance degradation assessment based on fixed cycle features test. Journal of Sound and Vibration, Vol. 326, Issue 3-5, 2009, p. 894-908.
-
Sikorska J. Z., Hodkiewicz M., Ma L. Prognostic modelling options for remaining useful life estimation by industry. Mechanical Systems and Signal Processing, Vol. 25, Issue 5, 2011, p. 1803-1836.
-
Si X.-S., Wang W., Hu C.-H., Zhou D.-H. Remaining useful life estimation – A review on the statistical data driven approaches. European Journal of Operational Research, Vol. 213, Issue 1, 2011, p. 1-14.
-
Şeker S. A reliability model for induction motor ball bearing degradation. Electric Power Components and Systems, Vol. 31, Issue 7, 2003, p. 639-652.
-
Nectoux P., Gouriveau R., Medjaher K., Ramasso E., Morello B., Zerhouni N., Varnier C. Pronostia: An Experimental Platform for Bearings Accelerated Life Test. International Conference on Prognostics and Health Management, Denver, CO, USA, 2012.
-
Wang Z., Huang H.-Z., Du L. Reliability analysis on competitive failure processes under fuzzy degradation data. Applied Soft Computing, Vol. 11, Issue 3, 2011, p. 2964-2973.
-
Gonzalez-Gonzalez D. S., Praga Alejo R. J., Cantú-Sifuentes M., Torres-Treviño L. M., Méndez G. M. A non-linear fuzzy regression for estimating reliability in a degradation process. Applied Soft Computing, Vol. 16, 2014, p. 137-147.
-
Gao C., Meeker W. Q., Mayton D. Detecting cracks in aircraft engine fan blades using vibrothermography nondestructive evaluation. Reliability Engineering and System Safety, Vol. 131, 2014, p. 229-235.
-
Tallian T. Weibull distribution of rolling contact fatigue life and deviations therefrom. ASLE Transactions, Vol. 5, Issue 1, 1962, p. 183-196.
-
Wang T. Bearing life prediction based on vibration signals: A case study and lessons learned. IEEE Conference on Prognostics and Health Management, Denver, CO, USA, 2012, p. 1-7.
About this article
This research is partially supported by the NSFC under Grant No. 61104182.
