Abstract
The wear ring clearance of centrifugal pumps is of significant importance for numbers of effects. In the paper, these effects including the performance, pressure pulsations, hydraulically generated vibration and noise level are investigated. For the purpose, a numerical method combined the FEM and BEM analysis was developed to predict the vibration and sound radiation of the volute. The numerical simulations with and without leakage flow paths being considered were compared. Additionally, the simulation results were validated by the vibration acceleration of the monitoring points on the volute. On this basis, the effects of wear ring clearance were analyzed. The results show that the quality of vibration simulation for centrifugal pumps can be improved by involving the leakage flow paths in simulations. Based on an overall consideration of the performance, pressure pulsations, vibration and noise, the optimum wear ring clearance is supposed to be 0.6 mm for the centrifugal pump (26.7). The results can be used to guide the optimum design of the pump wear ring clearance.
1. Introduction
The pump with volute is perhaps the most common type of centrifugal pumps in the world. It is wildly applied in industrial and civilian use. In these applications, the vibrations and noise problems are getting more and more attention. Both vibrations and noise can affect the centrifugal pump performance and its life. In centrifugal pumps, the sources of vibrations and noise may lie in hydraulic or mechanical aspects [1]. But under normal operating condition, the blade passing frequency is the most usual excitation of vibrations and noise. The blade passing frequency (BPF) is represented as the product of the number of blade and rotation speed. Large BPF amplitude (and its harmonics) can lead to a lot of noise and vibrations, which may be the source of components wear and bearing failure [2]. This frequency is a consequence of the non-uniformity of the flow at the impeller outlet which is caused by the effect of the rotor-stator interaction.
Leakage flow paths between the rotating impeller and the stationary housing play an important role in centrifugal pumps. The main flow at the impeller outlet can get into the sidewall gaps through the leakage, arousing non-uniform pressure distributions in the gaps. Studies conducted by Uy and Adkin [3-5] indicated that the leakage flow from the impeller outlet to the front sidewall gap can produce great hydraulic forces. The swirling flow in the gaps also has a significant effect on the unsteady hydraulic force in centrifugal pumps, according to the literature [6]. Considering the importance of the leakage flow, several authors have included the leakage flow paths in their CFD calculations[7-9].
In respect of vibration and noise, although these characteristics are expected to vary with the wear ring clearance because of non-uniform pressure distributions in the gaps, the detailed studies have not been conducted. In order to have a better idea of the effects of the wear ring clearance on vibration and noise, the analysis model was developed at first. Most previous works for vibration and noise of centrifugal pumps have focused on theoretical and experimental studies [10-19]. Recently, the fluid-dynamic calculations combined with acoustic analogies have been developed. In this method, acoustic sources are predicted from CFD calculations [20-21] or a discrete vortex method [22-23]. Then the acoustic response is calculated by means of a boundary element method (BEM) [21, 24-26]. Kato [27] and Jiang [28] conducted a fluid-structure weakly coupled simulation method to investigate the flow induced noise in pumps. However, these studies seem to have simulated the volute and impeller interactions only, without the leakage flow paths being considered.
The current work aims to improve the quality of the analytical model of vibration and noise by performing simulations involving the complete hydraulic pump geometry. On this basis, the effects of the wear ring clearance on hydraulically generated vibration and noise of a centrifugal pump have been studied.
2. Experimental setup
In this study, a single entry, single volute centrifugal pump with 5 blades was used as the experimental machine. The impeller is designed to operate at 2900 rpm. The designed flow rate is 50 m3/h, and the designed head is 30 m. And its corresponding specific speed is 26.7. The front and rear wear ring clearance changes from 0.4 mm to 1 mm, with the other geometric parameters staying the same. Fig. 1 shows the location of the front and rear wear ring clearance. General pump geometric values are identified in Table 1.
Table 1Main pump parameters
Location | Parameter | Sign | Value | Unit |
Single entry impeller | Inlet diameter of impeller | 0.036 | m | |
Outlet diameter of impeller | 0.168 | m | ||
Number of blade | 5 | – | ||
Outlet blade angle | 33 | ° | ||
Total blade wrap angle | 115 | ° | ||
Impeller outlet width | 0.01 | m | ||
Single volute | Radius to cutwater | 0.184 | m | |
Volute inlet width | 0.02 | m | ||
Discharge nozzle diameter | 0.05 | m |
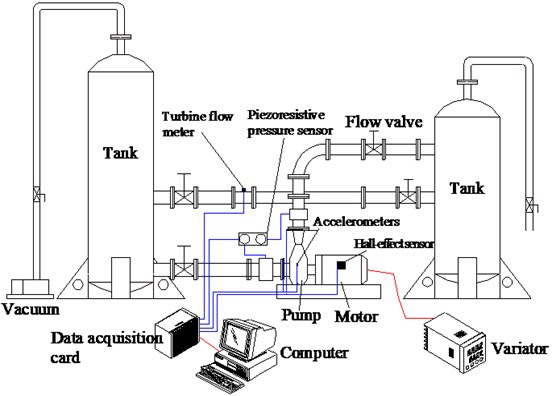
The experiments were carried out in a close hydraulic test rig, as shown in Fig. 2. The pump in the rig was driven at a constant speed of 2900 r/min by a variator, with a blade passing frequency of BPF 242 Hz. The torque was measured through a Hall-effect sensor. In the rig, the flow rate was controlled by a flow valve installed downstream on the outlet pipe, and the flow rate was measured by a turbine flow meter. The mean static pressure was tested through two piezoresistive pressure sensors installed at the inlet and outlet of the pump. The measuring range of the sensor was –100 kPa-100 kPa and 0-600 kPa, respectively. Four PCB 352A60 accelerometers with the sensitivity of 10 mv/() were used to measure the vibration of the pump. These accelerometers were fixed on four positions of the volute exterior surface, as shown in Fig. 3. Signals were translated to the electric signals. Then a PXI-6251 data acquisition module was applied to capture the electric signals and convert them into digital signals. The data were finally analyzed by using the code LabVIEW in a computer. In this setup, the measurement uncertainties were ±1.5 % for the Hall-effect sensor, ±0.5 % for the piezoresistive pressure sensor, ±0.5 % for the turbine flow meter, and ±2 % for the accelerometer.
Fig. 1Wear ring clearance
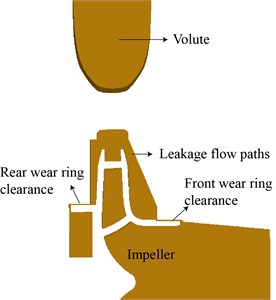
Fig. 3Location of the accelerometers
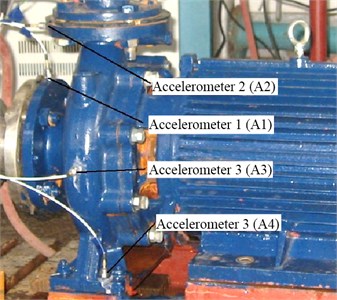
Fig. 2A close hydraulic test rig
3. Fluid simulation
3.1. Model generation
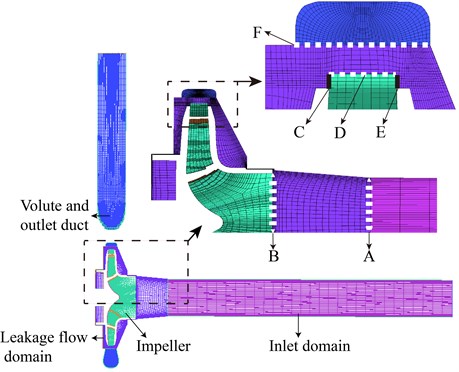
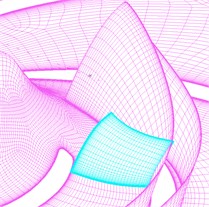
A CAD model was generated first, and then the model was discretized into mesh by using the code GridPro 5.1. The mesh is of high quality structured grids which was divided into four parts: (i) inlet domain, (ii) impeller, (iii) volute and outlet duct, (iv) leakage flow domain. Each of the parts was built and meshed independently. As the impeller (ii) has a relative rotation with respect to the three other parts, six surfaces were created as interfaces between (i)-(iv) and (iii)-(iv) as well as (ii)-(iv). Fig. 4 presents a detail of the mesh and the interfaces of the pump. In Fig. 4, the surface A and F were created as interfaces between inlet domain-leakage flow domain and leakage flow domain-volute and outlet duct. The surface B, C, D and E were used as interfaces between leakage flow domain and impeller.
Fig. 4Mesh and interfaces of the pump
3.2. Solution parameters and boundary conditions
The commercial software CFX was applied to solve the transient fully 3D Reynolds-averaged Navier-Stokes equations in the whole pump. In order to simulate the rotational effect, the multiple frames of reference were involved. The impeller part (ii) was set in the rotational frame of reference, and the inlet domain (i), volute, outlet duct (iii) as well as leakage flow domain (iv) were set in the stationary frame of reference. The grid interfaces between two stationary components were set as general grid interface (GGI). Between rotational and stationary components GGI was also used as internal component connection, and the rotor/stator interface was applied in transient simulation, while the frozen rotor interface was used in steady state calculation.
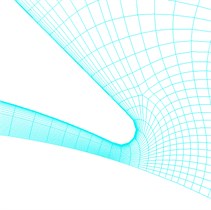
Fig. 5a) Details of mesh on impeller walls, b) volute walls near tongue, c) walls of leakage flow domain
a)
b)
c)
The boundary conditions imposed were a constant total pressure (1 atm) at the inlet of the inlet domain (i), and a mass flow rate at the outlet of the volute and outlet duct (iii). The reference pressure was set to be 0 All walls of the flow domain were modeled by using a no-slip boundary condition. A second order high resolution discretization was used for the advection terms and a second order backward Euler scheme for the transient terms.
Turbulence was simulated with a - SST model, which is considered as a good compromise between accuracy and computational effort, even for the flow in small gaps [29]. The standard wall function was used to calculate boundary layer variables. In order to simulate the turbulence effect in the boundary layer, the grid node of the first cell-layer away from all the walls was specified to be 2E-5 m. The detail mesh was shown in Fig. 5. The reported magnitude of of the surfaces is shown in Fig. 6. In Fig. 6, on the impeller and volute surfaces is well below 16.
The transient calculations were initialized from the steady solutions, the number of time steps for each blade passage was set to be 36. This resulted in a time step size of 1.15E-4 s, which corresponded to 180 time steps per revolution. The average residual convergence criterion was set to be 1E-5. The CFD results were recorded after five impeller revolutions to achieve a stabilized solution. The simulations in this study were carried out on a cluster of twelve Intel Xeon 5600 nodes.
Fig. 6y+distribution on the impeller and volute
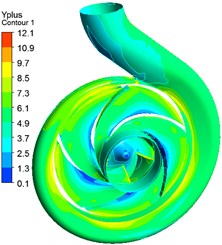
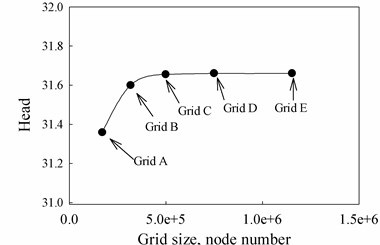
Fig. 7Influence of gird size on pump head
3.3. Grid independence
The grid dependence study was carried out through five grid topologies, named Grid A, Grid B, Grid C, Grid D and Grid E. The details of varying grid sizes are shown in Table 2. The pump head under design condition was taken as the parameter to determine the influence of the mesh size on the solution. In Fig. 7, it can be observed the pump head coefficient reaches an asymptotic value as the number of grids increase. According to this figure, the grid D is considered to be reliable to ensure the grid independence.
Table 2Details of varying pump grid size
Name | Impeller grid number | Leakage flow domain grid number | Volute and outlet duct grid number | Inlet domain grid number | Total grid number |
Grid A | 45,497 | 50,616 | 59,768 | 14,147 | 170,048 |
Grid B | 81,433 | 95,000 | 115,150 | 24,831 | 316,414 |
Grid C | 102,860 | 159,704 | 197,172 | 38,471 | 498,207 |
Grid D | 195,121 | 248,664 | 249,808 | 55,087 | 748,680 |
Grid E | 330,560 | 365,816 | 381,600 | 74,679 | 1,152,655 |
4. Volute structural and acoustical simulation method
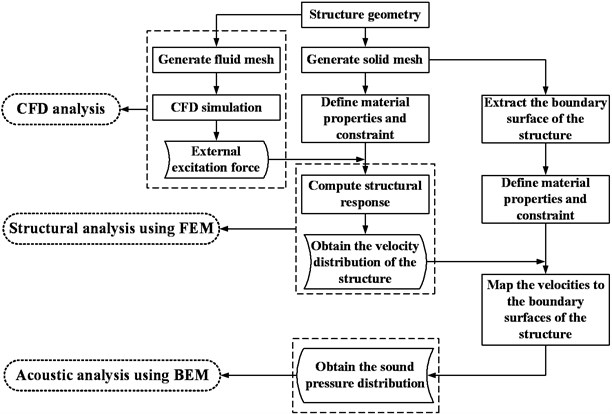
In this study, the structural vibration is predicted by using the FEM method, and then the BEM analysis is applied for sound radiation. The procedure for the method is illustrated in Fig. 8.
4.1. Volute vibration simulation method
The equation that governs the dynamic response of the structure can be written in the form:
where [] is the mass matrix, [] is the damping matrix, [] is the stiffness matrix, {} is the nodal structural displacement vector, and {} is the external excitation force vector applied on the nodal structure which is a function of time. The damping matrix [] can be a linear combination of the stiffness and mass matrices according to Rayleigh’s theory. The formula is:
where , represent the mass and stiffness proportional damping constants, respectively. The two constants can be given as a function of the natural frequency and the damping ratio, as the following equations:
where and are the th and th mode natural frequency, respectively; and are the th and th mode damping ratio, respectively. In present study, both modes are assumed to have the same damping ratio, (=) and the damping ratio was estimated to be 0.04 [30-31], then the Eq. (3) can be written as:
Fig. 8Volute structural and acoustical simulation method
The excitation force {} is calculated by transferring the hydrodynamic load on the CFD mesh to the structure mesh. To realize this process, a discrete data transfer including three steps was developed in this study, as shown in Fig. 9. The step 1 is mesh searching used to find matching CFD surface elements for each structure node, which can be very time-consuming. To get over this problem, a bucket algorithm developed by Bonet and Peraire [32] was used to reduce the search complexity. The step 2 is mesh matching, which is to find a nearest CFD mesh element to a structure mesh node. The CFD mesh shape can be defined as:
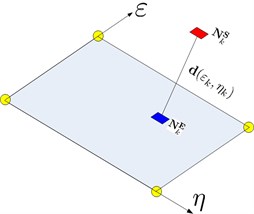
where represents CFD mesh element nodes, is the element basis functions, and () is the CFD mesh element coordinates. The surface elements for CFD calculations are quadrilateral, as shown in Fig. 10. The distance from a structure node () to any node on the CFD mesh element can be written in the formula as following:
Fig. 9Data transfer between fluid and structure mesh
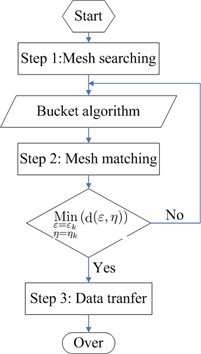
Fig. 10Relation between the source and target meshes
The nearest CFD mesh element node () should meet the following equation:
The step 3 is the data transfer from fluid surface elements to structure nodes. The data transfer function was defined as [33]:
where is the pressure on the CFD mesh element nodes, and is the pressure transferred from fluid to the structure nodes. In the study, pressure on the surface with and without the sidewall surface nodes was exacted and compared. Fig. 11 shows the CFD mesh used in the data transfer process, (a) for mesh with the sidewall surface, and (b) without the sidewall surface, respectively. Fig. 12 presents the structure mesh of the pump volute, which consists of 59201 elements and 15785 nodes.
The material used in the simulation is iron, whose elastic module 211 GPa, the density 7870 kg/m3, the poisson ration 0.29. The excitation force {} was set as the boundary condition. The constraints were imposed as follows: the nodes of the foundation bolt hole were completed fixed, with 0; the displacement of nodes on the bearing holes was 0; 0 on the inlet flanges and 0 on the outlet flanges. The boundary set was shown in Fig. 12.
Fig. 11Source mesh: a) with the sidewall surface, b) without the sidewall surface
a)
b)
Fig. 12Structure mesh of the volute
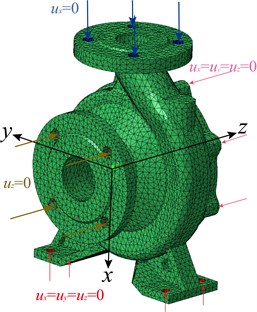
Fig. 13Acoustic mesh of the volute
4.2. Volute acoustic simulation
The boundary element method (BEM) in the Sysnoise software was applied to perform the volute acoustic simulation. The governing equation for radiated sound pressure in the surrounding air induced by vibration of the volute structure can be written in the form:
where is a position vector of receiver, is a position vector on the boundary surface, is acoustic pressure on the boundary surface, is the surface normal velocity, and is a geometry related coefficient, 0.5 if , 1 if and 0 if . is the Green’s function, which can be written in the form:
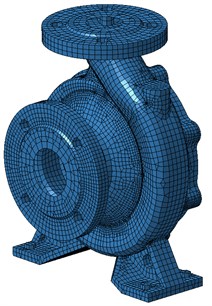
The outer surface of the structure was extracted and meshed as the acoustic model used in the BEM calculation, as shown in Fig. 13. The acoustical mesh consists of 14706 elements and 13573 nodes. As the maximum valid frequency of the model investigated in this study was 4366 Hz, the mesh was sufficiently fine for the blade passing frequency (242 Hz), according to the literature [34]. The normal velocity distribution on the outer surface nodes of the structure was transferred to the surface nodes of the acoustic model, which was set as the boundary condition of the volute acoustic simulation. Then, the sound pressure distribution was solved by using the BEM method.
5. Results and discussions
The vibration and noise induced by inner flow in the pump with different wear ring clearance are analyzed and compared under design flow condition. Before the numerical method is used, the simulation results are validated by the vibration acceleration of the monitoring points. The detailed analyses and discussions are as follows.
5.1. Experimental validation
In this experiment, the noise measurements were not carried out because of a shortage of the anechoic chamber. However, the vibration measurements were used to validate the method mentioned above. Fig. 14 presents the comparisons between the measured and predicted spectra of vibration accelerations of the measuring points under design flow condition. And the simulation results with and without considering the sidewalls are also compared in Fig. 14.
Fig. 14Comparisons between measured and calculated spectra of vibration acceleration of the monitoring points
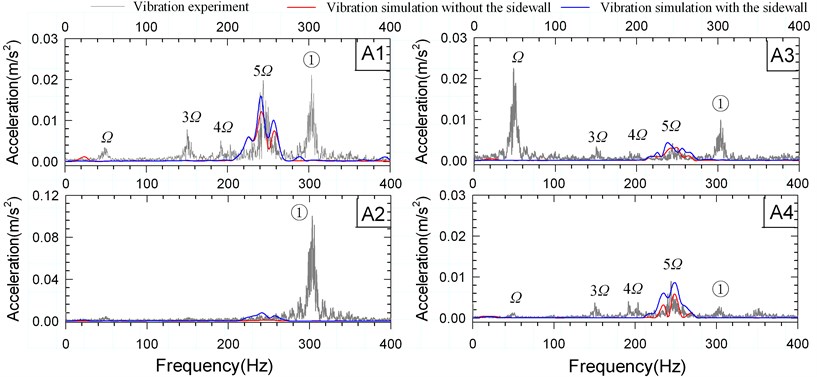
Through the measurements, it is found that the synchronous vibration at the shaft frequency of 48 Hz dominates the low frequencies. This can be caused by the excitations from the mechanical unbalance, hydraulic unbalance, bent rotor, and excessive run-out of components. There are noticeable peaks at 3 and 4 due to loose parts, loose bearing or rubbing. The peaks at the blade passing frequency (BPF) 5 are clearly visible in the figure. The BPF vibrations are excited by the rotor-stator interaction. The peak at labeled ① represents the discharge pipe resonance excited by high pressure pulsation at the pump outlet. It is observed that the vibration measurements of the sampling point A2 are greatly affected by the discharge pipe resonance. That is why at this point the relative error between the measured and numerical results is large. Also at the low frequency components, the relative errors are fairly large. That is because the behaviors of the rotor have been neglected. In the simulation only the dynamic surface pressure on the walls is used. As such, the BPF component is used to validate the calculating methods. It is found that the BPF amplitudes of simulation with considering the sidewalls are more coincident with the experimental results than the results without including the sidewalls. Fig. 15 shows the comparison between the simulated vibration acceleration at BPF with and without considering the sidewalls. Big differences are clearly visible. The BPF magnitude with considering the sidewalls is much larger than the results without the sidewalls being considered. This indicates the influences of the leakage flow paths of centrifugal pumps on the hydraulically vibration appear significant. The quality of vibration simulation for centrifugal pumps can be improved by involving the leakage flow paths in simulations.
Fig. 15Vibration acceleration at BPF under design condition: a) for with sidewalls b) for without sidewalls
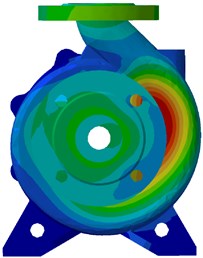
a)
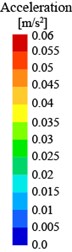
b)
5.2. Pressure pulsation on the casing wall
The pressure on the casing wall obtained by the CFD calculations was processed by using the Fast Fourier Transform with a Hanning Window. Fig. 16 and Fig. 17 present the pressure amplitude at BPF on the front and rear casing wall, respectively.
Fig. 16Pressure amplitudes at BPF on the front casing wall under design flow condition

a) 0.4 mm
b) 0.6 mm
c) 0.8 mm
d) 1.0 mm
Fig. 17Pressure amplitudes at BPF on the rear casing wall under design flow condition
a) 0.4 mm
b) 0.6 mm
c) 0.8 mm
d) 1.0 mm
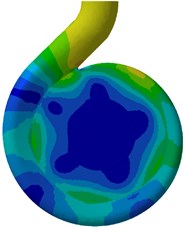
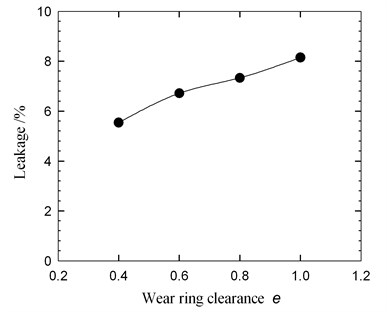
According to the two figures, there seems no big difference of pressure amplitude on the casing walls except the sidewalls area. It is found that the pressure amplitude at the sidewalls gets lower when the wear ring clearance increases. Fig. 18 shows the leakage as a function of wear ring clearance under design condition. The leakage is nondimensionalized with respect to the design flow rate. An appreciable rise is visible when the wear ring clearance increases. It is believed that the unsteady flow in sidewall gaps is caused by the leakage flow from the impeller outlet to the front sidewall gaps. As the front sidewall gaps are connected to the suction chamber, the excessive pressure fluctuations can be damped because of the leakage from the gaps into the suction chamber. Therefore, more leakage flow through the wear ring clearance into the suction chamber, much weaker pressure pulsation in gaps could be produced. It can be also observed in Fig. 16 and Fig. 17 that significant high levels of pressure amplitudes are mainly detected in three regions, namely, the tongue, between the first and second hydraulic profile of the volute, and the diffuser wall. This is due to the effect of the blade-tongue interaction at BPF. At BPF the blade trailing edge just passes the tongue leading edge, which causes strong pressure pulsations around the tongue region.
Fig. 18Leakage as a function of the wear ring clearance
5.3. Volute structural vibration simulation
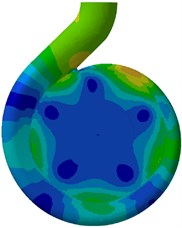
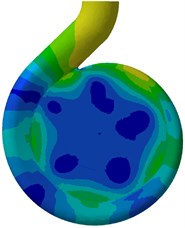
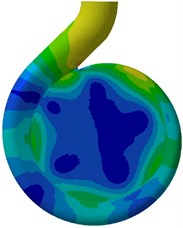
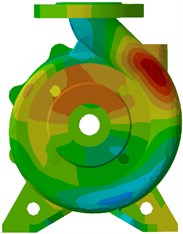
Fig. 19 presents the normal vibration velocity on the structure nodes at BPF for the four pump sets under design condition. It can be found that the normal vibration velocity decreases with growing wear ring clearance. This phenomenon is consistent with the variation of pressure pulsation. As the wear ring clearance increases, the pressure pulsation damps in the sidewall gaps. This caused smaller excitation force on the structure. The consequence would be lower vibration and noise. It is found that high levels of vibration velocity mainly take place in three regions, namely, around the tongue, between the fourth and the sixth hydraulic profile of the volute, and the eighth hydraulic profile close to the diffuser.
Fig. 19Normal vibration velocity on structure nodes at BPF under design flow condition
a) 0.4 mm
b) 0.6 mm
c) 0.8 mm
d) 1.0 mm
5.4. Volute acoustic simulation
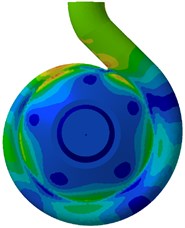
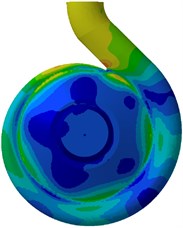
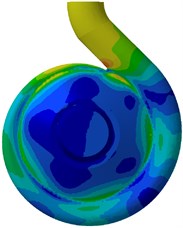
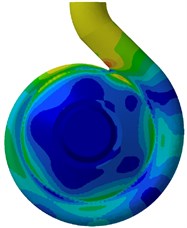
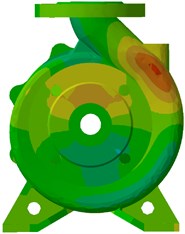
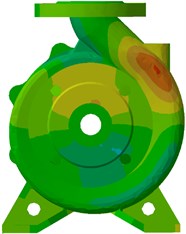
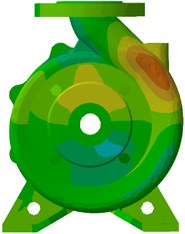
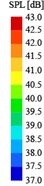
A spherical acoustic mesh of radius 0.5 m with the volute at its center was used to calculate the directivity distribution of the sound pressure level radiated from the pump. Fig. 20 shows the sound pressure level at BPF for the four pump sets under design condition. It can be found that the sound pressure level decreases with growing wear ring clearance. This is consistent with the variation of vibration velocity. Also the region with high SPL (Sound Pressure Level, SPL) mainly appears in the vertical direction caused by high vibration velocity around the pump outlet area.
Fig. 20Sound pressure level at BPF under design flow condition
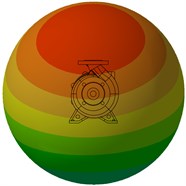
a) 0.4 mm
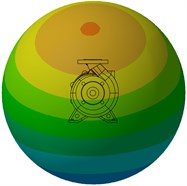
b) 0.6 mm

c) 0.8 mm
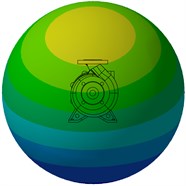
d) 1.0 mm
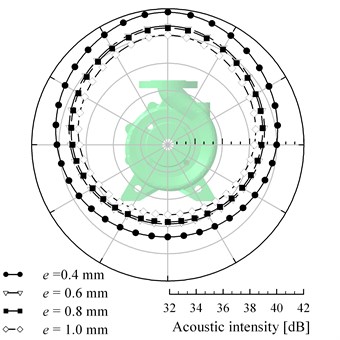
Fig. 21 shows the directivity distributions of the acoustic intensity at BPF. It can be seen from this figure, although the acoustic intensity varies with the wear ring clearance, the value of the pump with clearance of 0.4 mm is much larger than the others. This indicates that the wear ring clearance should be selected with the vibration and noise being considered. In the past, the wear ring clearance is commonly selected from empirical values. But the empirical data sometimes lay particular stress on the improvements of the performance. According to the literature [35], the wear ring clearance is selected in a range of 0.2 mm to 0.65 mm. The efficiency is supposed to decrease with growing wear ring clearance, according to the studies [36-38]. However, in respect of vibration and noise, the wear ring clearance is better to be larger than a certain value. In practical, it is a trade-off between the efficiency and life safety. In present study, the vibration and noise level of the pump with wear ring clearance of 0.6 mm is much less than the pump with clearance of 0.4 mm, but is very close to the other pump sets. Therefore, the optimum wear ring clearance is supposed to be 0.6 mm for the centrifugal pump studied in the paper (26.7) based on an overall consideration of the performance, pressure pulsations, vibration and noise.
Fig. 21Directivity distributions of the acoustic intensity at BPF under design condition
6. Conclusions
The effects of the wear ring clearance on the hydraulically generated vibration and noise of a centrifugal pump volute were studied. For this purpose, a numerical method combined the FEM and BEM analysis was developed to predict the vibration and sound radiation of the volute. Before the numerical method was used, the simulation results were validated by the vibration acceleration of the monitoring points on the volute. The vibration and noise were analyzed and compared under design condition. The analysis of the results gives the following conclusions.
1) The quality of vibration simulation for centrifugal pumps can be improved by involving the leakage flow paths in simulations.
2) The BPF magnitudes of the pressure pulsation at the front and rear sidewalls decreases with growing wear ring clearance. The excessive pressure fluctuations are damped due to the leakage from the sidewall gaps into the suction chamber through the wear ring clearance. As a consequence of the rotor-stator interaction, significant high levels of pressure amplitudes are mainly detected in three regions, including the tongue, between the first and second hydraulic profile of the volute, and the diffuser wall.
3) The normal vibration velocity on the volute outer surface and the noise level radiated from the volute decreases with growing wear ring clearance. The high levels of vibration velocity are mainly detected in three regions, around the tongue, between the fourth and the sixth hydraulic profile of the volute, and the eighth hydraulic profile close to the diffuser. The region of high noise level mainly appears in the vertical direction.
4) Based on an overall consideration of the performance, pressure pulsations, vibration and noise, the optimum wear ring clearance is supposed to be 0.6 mm for the centrifugal pump (26.7).
References
-
Dürrer B., Wurm F. H., AG W. Noise sources in centrifugal pumps. Proceedings of the 2nd WSEAS International Conference on Applied and Theoretical Mechanics, Venice, Italy. 2006, p. 203-207.
-
Birajdar R., Patil R., Khanzode K. Vibration and noise in centrifugal pumps – sources and diagnosis methods. Proceedings of the 3rd International Conferences on Integrity, Reliability and Failure, Porto, Portugal, 2009.
-
Uy R. V., Brennen C. E. Experimental measurements of rotordynamic forces caused by front shroud pump leakage. Journal of Fluids Engineering, Vol. 121, Issue 3, 1999, p. 633-637.
-
Adkins D. R., Brennen C. E. Analysis of hydrodynamic radial forces on centrifugal pump impellers. Journal of Fluids Engineering, Vol. 110, Issue 1, 1988, p. 20-28.
-
Guinzburg A., Brennen C. E., Acosta A. J., et al. Experimental results for the rotordynamic characteristics of leakage flows in centrifugal pumps. Journal of Fluid Engineering, Vol. 116, Issue 1, 1994, p. 110-115.
-
Yun Hsu, Brennen C. E. Effect of swirl on rotordynamic forces caused by front shroud pump leakage. Journal of Fluids Engineering, Vol. 124, Issue 4, 2002, p. 1005-1010.
-
Spence R., Amaral-Teixeira J. Investigation into pressure pulsations in a centrifugal pump using numerical methods supported by industrial tests. Computers and fluids, Vol. 37, Issue 6, 2008, p. 690-704.
-
Björn C. W., Friedrich K. B., Hans J. D. Investigation of the flow in the impeller side clearances of a centrifugal pump with volute casing. Journal of Thermal Science, Vol. 21, Issue 3, 2012, p. 197-208.
-
Blanco E., Barrio R., Parrondo J., et al. Fluid-dynamic pulsations and radial forces in a centrifugal pump with different impeller diameter. Proceedings of ASME Fluids Engineering Division Summer Meeting and Exhibition, Houston, USA, 2005.
-
Simpson H. C., Macaskill R., Clark T. A. Generation of hydraulic noise in centrifugal pumps. Proceedings of the Institution of Mechanical Engineers, SAGE Publications, Vol. 181, Issue 1, 1966, p. 84-108.
-
Simpson H. C., Clark T. A., Weir G. A. A theoretical investigation of hydraulic noise in pumps. Journal of Sound and Vibration, Vol. 5, Issue 3, 1967, p. 456-488.
-
Bent P. H. Experiments on the aerodynamic generation of noise in centrifugal turbomachinery. Thesis, The Pennsylvania State University, 1993.
-
Chu S., Dong R., Katz J. Relationship between unsteady flow, pressure fluctuations, and noise in a centrifugal pump – part A: use of PDV data to compute the pressure field. Journal of Fluids Engineering, Vol. 117, Issue 1, 1995, p. 24-29.
-
Chu S., Dong R., Katz J. Relationship between unsteady flow, pressure fluctuations, and noise in a centrifugal pump – part B: effects of blade-tongue interactions. Journal of Fluids Engineering, Vol. 117, Issue 1, 1995, p. 30-35.
-
Rzentkowski G. Generation and control of pressure pulsations emitted from centrifugal pumps: A review. Pressure Vessels and Piping Conference, Montreal, Canada, 1996, Vol. 328, p. 439-454.
-
Morgenroth M., Weaver D. S. Sound generation by a centrifugal pump at blade passage frequency. Journal of Turbomachinery, Vol. 120, Issue 4, 1998, p. 736-743.
-
Dong R., Chu S., Katz J. Effect of modification to tongue and impeller geometry on unsteady flow, pressure fluctuations, and noise in a centrifugal pump. Journal of Turbomachinery, Vol. 119, Issue 3, 1997, p. 506-515.
-
Rzentkowski G., Zbroja S. Experimental characterization of centrifugal pumps as an acoustic source at the blade-passing frequency. Journal of Fluids and Structures, Vol. 14, Issue 4, 2000, p. 529-558.
-
Choi J. S., McLaughlin D. K., Thompson D. E. Experiments on the unsteady flow field and noise generation in a centrifugal pump impeller. Journal of Sound and Vibration, Vol. 263, Issue 3, 2003, p. 493-514.
-
Berten S., Dupont P., Farhat M., et al. Rotor-stator interaction induced pressure fluctuations: CFD and hydroacoustic simulations in the stationary components of a multistage centrifugal pump. Proceedings of the 5th Joint ASME/JSME Fluids Engineering Conference, San Diego, CA, USA, 2007, p. 963-970.
-
Kato C., Kaiho M., Manabe A. An overset finite-element large-eddy simulation method with applications to turbomachinery and aeroacoustics. Journal of Applied Mechanics, Vol. 70, Issue 1, 2003, p. 32-43.
-
Jeon W. H., Lee D. J. A numerical study on the flow and sound fields of centrifugal impeller located near a wedge. Journal of Sound and Vibration, Vol. 266, Issue 4, 2003, p. 785-804.
-
Langthjem M. A., Olhoff N. A numerical study of flow-induced noise in a two dimensional centrifugal pump. Part I. Hydrodynamics. Journal of Fluids and Structures, Vol. 19, 2004, p. 349-368.
-
Langthjem M. A., Olhoff N. A numerical study of flow-induced noise in a two-dimensional centrifugal pump. Part II. Hydroacoustics. Journal of Fluids and Structures, Vol. 19, 2004, p. 369-386.
-
Kato C., Yamade Y., Wang H., et al. Numerical prediction of sound generated from flows with a low Mach number. Computers and Fluids, Vol. 36, Issue 1, 2007, p. 53-68.
-
Yuan Shou-Qi, Si Qiao-Rui, Xue Fei, et al. Numerical calculation of internal flow-induced noise in centrifugal pump volute. Journal of Drainage and Irrigation Machinery Engineering, Vol. 29, Issue 2, 2011, p. 93-98.
-
Kato C., Yoshimura S., Yamade Y., et al. Prediction of the noise from a multi-stage centrifugal pump. Proceedings of ASME Fluids Engineering Division Summer Meeting, Houston, USA, 2005.
-
Jiang Y. Y., Yoshimura S., Imai R., et al. Quantitative evaluation of flow-induced structural vibration and noise in turbomachinery by full-scale weakly coupled simulation. Journal of Fluids and Structures, Vol. 23, Issue 4, 2007, p. 531-544.
-
Poncet S., Da Soghe R., Facchini B. RANS modeling of flows in rotating disk systems. 5th European Conference on Computational Fluid Dynamics, Lisbon, Portugal, 2010.
-
Marscher W. D. An end-user’s guide to centrifugal pump rotordynamics. Proceedings of the 23rd Pump Users Symposium, 2007, p. 69-93.
-
Kaiser T. F., Osman R. H., Dickau R. O. Analysis guide for variable frequency drive operated centrifugal pumps. Proceedings of the 24th International Pump User’s Symposium, Texas, USA, 2008, p. 81-106.
-
Bonet J., Peraire J. An alternating digital tree (ADT) algorithm for 3D geometric searching and intersection problems. International Journal for Numerical Methods in Engineering, Vol. 31, Issue 1, 1991, p. 1-17.
-
Samareh J. A. Discrete data transfer technique for fluid-structure interaction. AIAA paper, 2007.
-
Marburg S. Six boundary elements per wave length: is that enough? Journal of Computational Acoustics, Vol. 10, Issue 1, 2002, p. 25-51.
-
Gulich J. F. Centrifugal Pumps. Springer, 2010.
-
Chen S. X., Pan Z. Y., Wu Y. L., et al. Simulation and experiment of the effect of clearance of impeller wear-rings on the performance of centrifugal pump. IOP Conference Series: Earth and Environmental Science, Vol. 15, Issue 7, 2012, p. 072017.
-
Zhao W. G., Li Y. B., Wang X. Y., et al. Research on the effect of wear-ring clearances to the performance of centrifugal pump. IOP Conference Series: Earth and Environmental Science, Vol. 15, Issue 7, 2012, p. 072018.
-
Li Wenguang Model of flow in the side chambers of an industrial centrifugal pump for delivering viscous oil. Journal of Fluids Engineering, Vol. 135, Issue 5, p. 2013051201-051201-22.
About this article
The authors gratefully acknowledge the support from the National Natural Science Foundation of China (No. 51109095, 51179075) and the project (No. CXZZ13_0675).
All authors declare no conflict of interests.
