Abstract
This paper presents the measurement system that is designed for measurement and analysis of mechanical and aerodynamic unbalance. These types of unbalance occurs in mechanical systems composed of high radius blades, including rotorcrafts – autogyro. This work presents structure of the measurement system, processing and visualization process of measurement data.
1. Introduction
Vibrations in mechanical systems composed of high radius blades damage components. The main reason for low frequency vibrations is unbalance of a rotor. Its causes are mechanical and aerodynamic unbalance [1].
During rotorcrafts maintenance tasks vibrations from unbalance are minimized using method called “track and balance” [2-4]. This method mainly relies on measuring rotor’s vibrations level and phase. Our continuously developed measurement system measures and analyses autogyro rotor vibrations, blades dynamic pressure and profile.
Measurements of rotating blades profile and created pressure, further data processing and visualizations are helpful to detect not geometrically identical blades – cause of aerodynamic unbalance at various rotating frequencies. This detection takes place ahead of rotor balancing procedures that continue through several flights.
2. Structure of the measurement system
The measurement system consist of several measurement sensors, data acquisition unit and PC with data processing and presentation software. Fig. 1 shows structure of the system.
Fig. 1Structure of measurement system
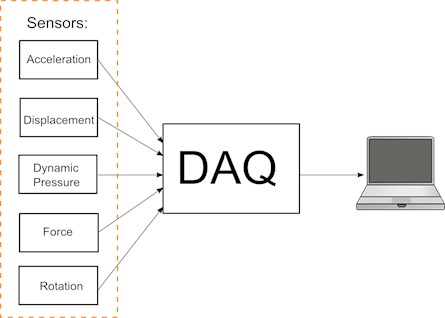
The 2-axis acceleration sensor is mounted (Fig. 2) as close as possible to the center of autogyro rotor and measures rotor’s vibrations. Mechanical and aerodynamic imbalance and other components causes these vibrations. High frequency vibrations (>30 Hz) does not inform about rotor imbalance, therefore optionally acceleration sensors could be mounted with material that filters out high frequency vibrations.
Fig. 2Vibrations and rotation sensors location on autogyro Calidus [5]
![Vibrations and rotation sensors location on autogyro Calidus [5]](https://static-01.extrica.com/articles/15262/15262-img2.jpg)
Aircraft cabin is placement of additional acceleration sensor. It acquires information about vibrations that affect pilot and passengers in cabin during flight.
The dynamic pressure sensor is to evaluate pressure created by rotating blades. Data processing allows separation and comparison of individual blades created pressure. Generated pressure are directly proportional to the lift force, thought pressure data reveals aerodynamic imbalance.
A triangular laser displacement sensor is part of imbalance measurement system. Main purpose of this type sensor in this measurement system is to acquire profile data of the blades surface. This measurement provides rotating blades geometry data. This sensor connects to the system by analog output, although digital output is available. Digital output advantages with wider bandwidth and it allows smoother integration with remaining system components.
The rotor’s rotation sensing mechanism consists of magnetic field sensors and magnet used as marker. Magnetic field sensors is located close to the center of the rotor and is attached to the fixed part of autogyro mechanism. Magnet is located on the rotor’s disk. During rotations periodically influences measurements of magnetic field.
In cases where measurements are performed on a measurement rig, and a construction is suitable, a load cell could be used for a measurement of lift force generated by blades. Rotor with blades can be mounted in particular way hereby a load cell will support rotor’s weight. The difference between idle and running rotor’s weight shows rotating blades generated lift force.
During rotor rotation, while autogyro is on the ground vibrations measurements in vertical direction are not accurate as ground preventing autogyro from movement in particular direction. Information about autogyro movement in vertical plane provides force sensor. It is located between front wheel and ground.
3. Data processing
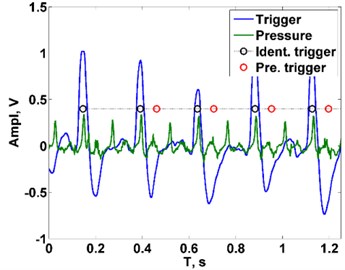
Data capture from measurement sensors lasts 5 seconds. Depending on rotation speed, measurement system records data of 15-35 rotations. Signal from magnetic field sensor (Fig. 3(a)) rises periodically and forms peaks as magnet on the rotor passes near magnetic field sensor. Data processing algorithm extracts peak locations and uses it as reference points (markers) for separating individual rotation data.
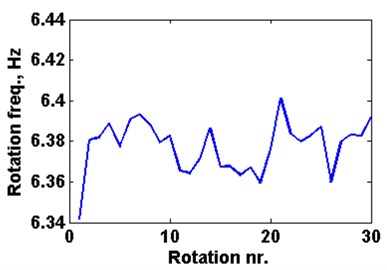
Data from magnetic field sensors Fig. 3(b) plots rotation frequency variation during duration of measurement against rotation number. It allows user of data processing software to select range of rotations numbers for further processing. For best results user should select range of rotations numbers with stable frequency.
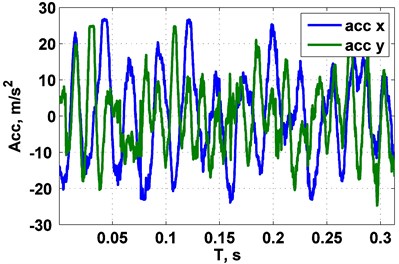
Markers split signals from acceleration sensors (Fig. 3(c)) to segments. Signals pass through low pass filter with cut-off frequency equal to rotor rotation speed.
Autocorrelation function calculates phase delay between segments (Fig. 3(d)). According to results segments are aligned in time domain are averaged between rotations to minimize random measurement errors. Averaged signal represents magnitude of vibrations during period of rotation.
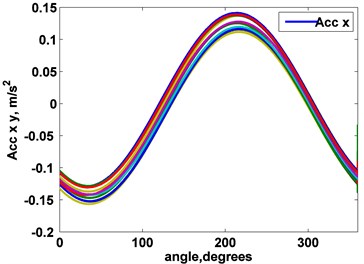
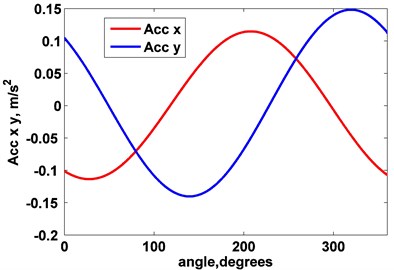
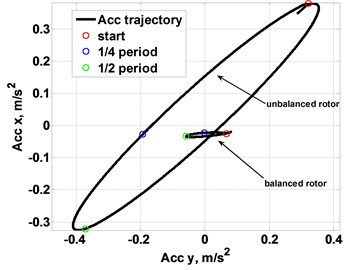
Fig. 3(e) plots vibration magnitudes versus time/angle to visualize magnitude variation during period of rotation for acquiring phase of maximum/minimum amplitude from the plot. Fig. 3(f) plots vibration magnitude in x direction versus y direction during one rotation period. Fig. 3(f) presents example results of vibrations measurements of autogyro during flight before rotor balancing procedure and after.
Fig. 3a) Magnetic field signal with detected peaks and unprocessed pressure signal, b) Rotor rotation frequency during measurement duration, c) Unprocessed data from acceleration sensor, d) Vibrations signals from several rotations, e) Final vibrations measurement result; vibrations plotted versus rotation angle, f) Final vibrations measurement result; vibrations in direction x plotted versus vibrations in direction y
a)
b)
c)
d)
e)
f)
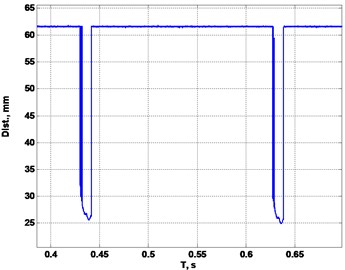
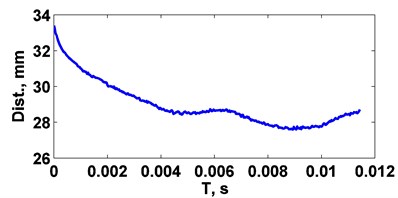
Synchronization markers split recorded signal from laser displacement sensors (Fig. 4(a)) by individual blades and rotations. Further step is to locate both edges of the blade in the processed signal and extract profile. Extraction process involves calculation of segment data differential function and location of its local maximums.
Surface with steep geometry changes or dirt could change laser light reflection angle and reflection will not be targeting sensor area. This behavior disrupts outputted data with rectangular spikes. Detection algorithm finds these spikes location and removes them. Gaps of lost data are recovered by using signal approximation.
Fig. 4a) Unprocessed signal from displacement sensor, b) Final blade profile
a)
b)
4. Conclusions
This paper presented measurement system for autogyro rotor mechanical and aerodynamic unbalance evaluation. Measurement system structure, components and data processing algorithms were presented. The paper showed example signals acquired from sensors located on autogyro Calidus, before and after data processing.
References
-
Rosen A., Ben-Ari R. Mathematical modelling of a helicopter rotor track and balance: theory. Journal of Sound and Vibration, Vol. 200, Issue 5, 1997, p 589-591.
-
Robinson M. Helicopter track and balance theory, http://www.aviationpros.com/article/10389059/ helicopter-track-and-balance-theory.
-
Kunz D. L., Newkirk M. C. A generalized dynamic balancing procedure for the AH-64 tail rotor. Journal of Sound and Vibration, Vol. 326, Issues 1-2, 2009, p. 353-366.
-
Ghosh A. K. Introduction to measurements and instrumentation. PHI Learning Pvt. Ltd., New Delhi, 2009, p. 145-147.
-
Silva C. W. Vibration and Shock Handbook. CRC Press, 2005, p. 24.1-24.17.
-
Technical specifications of the autogyro Calidus, http://www.auto-gyro.com/chameleon/public/ 06dad9ac-955b-5814-1065-22015c073776/Brochure_Calidus_ENG.pdf.
About this article
