Abstract
Railway-induced vibrations mitigation has become a priority issue in recent years. Among all the existing alternatives, wave barriers stand out because they can be implemented in any moment of the railway life span without interfering in the correct operation. However, limitations imposed by the track environment usually exist and may affect to the wave barriers design. In this paper the mitigation power of different types of trenches is studied using a 3D FEM model validated with real data. For this purpose, different scenarios are defined in order to assess the influence on the final vibration results of the location and the filling material, if exists. In any case, geometric limitations imposed by the track surrounding elements are taken into account. These limitations significantly hinder the search of the optimal solution.
1. Introduction
Vibration induced by a passing train is an issue of utmost importance in which many resources have been invested in recent years. New materials development and new track configurations have reduced the negative effects derived from the railway lines operation. However, most part of these solutions are addressed to the construction stage, being nearly impossible to adopt them in operating lines as a consequence of the high costs related and the temporary service disruption. This is the case of railpads replacement or the collocation of an elastomeric mat under the ballast or under the concrete slab in the case of slab-tracks.
By contrast, mitigation trenches are a feasible alternative that can be adopted during the operation stage to reduce vibrations. In this manner, the damage that vibrations may cause to the people in the immediate vicinity or to the nearby buildings is minimized. This paper delves into wave barriers knowledge, studying the behavior of different trench types in a given real case. For this, a 3D FEM model able to accurately reproduce the vibration phenomenon is implemented and then validated.
Numerical models have been widely used to analyze train-induced vibrations and, in this case, are considered more suitable to describe the phenomenon because of the high versatility provided to modify the model geometries. This fact allows the easy implementation of different types of trenches in different positions, while in the case of an analytical model the manipulation of the complex vibration equations to adapt them in each scenario would have been needed.
With regard to the railway induced vibrations study using numerical models, the work made by Auersch [1] and Galvín and Domínguez [2] in high speed lines must be mentioned. In both cases real registers were measured and then reproduced with the numerical model. In slab tracks, Kourioussis et al. [3] used a multi-body model to study the vehicle-track interaction, a FEM model to represent the track and a finite/infinite element model for the soil. Results were also compared to real measurements from the Brussels tram network.
The study of wave barriers as a mitigation measure has been approached from two different views: experimental and numerical. Among the experimental essays Leilei [4] studied the mitigation power of different width cell-foam filled trenches; Murillo et al. [5] performed centrifuge test to evaluate the effectiveness of the expanded polystyrene (EPS) as filling material in trenches and, finally, Çelebi et al. [6], who tested in real field experiments open trenches and in-filled trenches of different materials: bentonite, concrete and water. Numerical models have been used to assess the wave barriers mitigation power by Ju [7] in high speed lines, based on the FEM model with absorbing boundary conditions; Yang and Hung [8] and Hung et al. [9] used a bidimensional FEM model developed by themselves to analyze the effect of the trenches and elastic foundations to reduce the vibrations. Finally, the FEM model used by El Naggar and Chebab [10] to assess the behavior of different trench types in a homogeneous soil lying on bedrock should be cited as well.
Based on the previous researches, the objective in this article is to reduce the amplitude of the vibrations induced by a passing train by using trenches. Thus, the negative effects of the vibrations in the environment can be diminished. The study is performed in a real track with given restrictions in which different trench locations and types are studied. Consequently, the work can be divided into two clear tasks:
• The development of a 3D FEM model, using real acceleration measurements, able to accurately reproduce the vibration phenomenon in the track and the adjacent ground.
• The evaluation of the mitigation power of the trenches, according to the type and the location, with the previous model.
Results obtained from this research can be useful in different tracks from the studied one in which vibrations are wanted to be attenuated.
2. Real field data and model construction
The first step to evaluate the mitigation effectiveness of the trenches is to obtain a validated 3D FEM model in which run the different scenarios. The chosen stretch is located in the Line 1 of the Alicante Tram network. This stretch is located between the stations of Campello and Poble Espanyol. In Fig. 1 the real track configuration can be seen close to Poble Espanyol station.
Fig. 1Real track in Poble Espanyol station
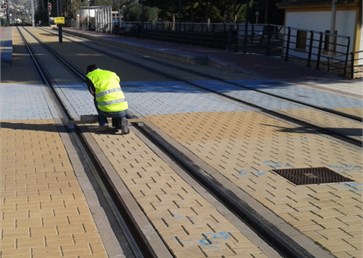
Fig. 2Model scheme
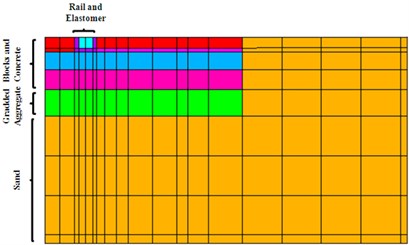
Cross section in this track is composed of a rail Phoenix totally embedded in elastomeric material and a 13 cm thick surface layer made of concrete blocks. Under the surface layer, it is located a thin sand layer which lies on a 22 cm thick reinforced concrete as well as the elastomeric frame in which the rail is embedded. This concrete slab is on a 25 cm lean concrete bed supported by a 20 cm stratum of graded aggregate. Underneath the track structure, there is a sand stratum of high thickness. In the next figure, a symmetric cross-section of the track is presented where the different layers described above are displayed.
Mechanical properties of the different elements included in the model are presented in Table 1. The Young modulus of the graded aggregate is unknown and will be determined in the calibration process.
The vehicle passing by the studied stretch is a Vossloh 4100. The speed is 35 km/h and the load transmitted per axle is 100 kN. The vehicle is composed of two extreme carriages and another placed in between. Given the symmetry of the problem around the track longitudinal axis, the effect of a single wheel transmitting 50 kN is considered in the model to reduce the calculations.
Table 1Mechanical properties of track elements
(Pa) | (kg/m3) | ||
Rail | 2.1×10¹¹ | 0.3 | 7850 |
Elastomer | 2.67×10⁷ | 0.48 | 900 |
Sand layer | 3.00×10⁷ | 0.3 | 1800 |
Paving blocks | 2.25×10⁹ | 0.25 | 2400 |
Reinforced concrete | 2.73×10¹⁰ | 0.25 | 2400 |
Lean concrete | 2.25×10¹⁰ | 0.2 | 2300 |
Graded aggregate | – | 0.3 | 1700 |
Sand | 1.20×10⁸ | 0.3 | 2000 |
3. Numerical model development
The objective of this section is to create a model able to reproduce the vibration phenomenon in order to study the effectiveness of the wave barriers as a mitigation measure. To achieve this goal, both real acceleration registers and an accurate model representing the real track characteristics are required.
3.1. Real data acquisition
To calibrate and validate the numerical model it was necessary to measure accelerations in two different points in the track. For this reason two different data sets were obtained: one was used to calibrate the model estimating the unknown parameters and the other was employed to validate the results previously obtained. Finally, a model representing the vibrations behavior is obtained. Measured points are 0.2 and 0.7 m distant from the outer side of the rail and over them accelerometers were placed as shown in Fig. 3. Devices employed in the data acquisition were triaxial accelerometers Sequoia Fast Tracer™ with the characteristics indicated in Table 2.
Fig. 3Accelerometers position at 0.2 and 0.7 m from the outer side of the rail
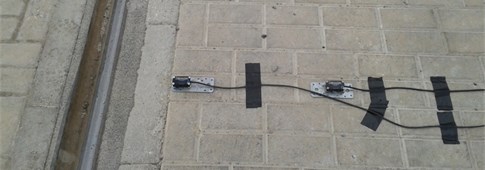
Table 2Technical properties of the accelerometers Sequoia Fast Tracer™
Sensors on rail and sleeper | |
Scope | ±5 g |
Band width (Hz) | 0-2500 |
Resolution (m/s2) | 0.041 |
Noise (m/s2) | 0.075 |
Sampling rate (Hz) | 8192 |
3.2. FEM model implementation
ANSYS Multiphysics/LS-DYNA V.14 software has been used to perform the numerical model. The equation of the system dynamics according to the Rayleigh damping theory is:
In which is the global mass matrix, the damping matrix, the stiffness matrix, the displacements vector, the velocities vector and the accelerations vector. The term represents the external forces exciting the system and inducing the accelerations.
In order to simplify Eq. (1) it is considered that the damping matrix only contains the stiffness term as in Real et al. [11]. In this manner, it can be considered that:
The global damping coefficient is unknown so it will be also included in the model calibration process to determine its value.
To calculate the vibration response induced by the whole train, the superposition principle is applied. Hence, the response produced by a single axle is calculated and then extended in time taking into consideration the axle distribution in the train and the driving speed. This method has already been used by, among others, El Kacimi [12] to extend the response of a single bogie to the whole train and Real et al. [13] in an analogous case to the studied here.
Finally, it must be stated that the frequency range studied with the model varies between 2 and 50 Hz. This interval was pointed by Griffin (1996) [14] as the most potentially dangerous to people in the track surroundings. In addition, the frequency range limits determine the model dimensions and also the model elements size as explained in [11].
3.3. Model calibration and validation
There exist two unknown parameters in the model: Young modulus of the graded aggregate and the global damping coefficient. To calibrate the model, different combinations of these values are proposed based on previous experiences and taking into account the materials present in the substructure in this case. Different accelerograms obtained from the different combinations are compared with real registers obtained at the point located 0.2 m away from the outer side of the rail. Then, the combination that best fits the real registers is chosen. In Table 3, the final values of the unknown parameters calibrated are shown.
Table 3Calibration values
Parameters | Calibrated values |
Rayleigh coefficient | 0.0005 |
Gradded aggregate Young modulus | 30 MPa |
Fig. 4Numerical model validation. Comparison between real registers (black) and model results (gray)
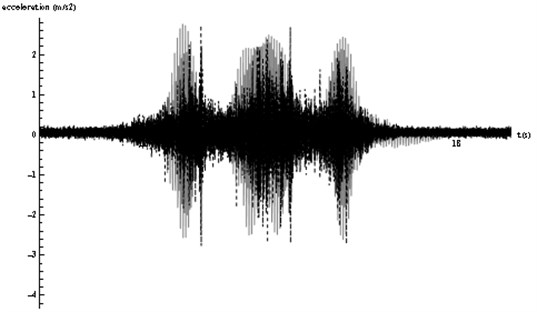
To validate the model, the other set of registers is taken and compared with the data obtained from the numerical model. In Fig. 4, it can be seen how the real and calculated peak values (positive and negative) are very similar and these maximums and minimums in the graph corresponding to the axle passing occur at the same time. Moreover, in both cases three bodies in the graph corresponding to the three bogies of the vehicle are distinguished, being the shape very similar in every case. From this verification it is concluded that a numerical model able to represent the vibrations in this track is available. Subsequently, the suitability of the wave barriers to mitigate the vibrations can be studied.
4. Wave barriers analysis
In Fig. 5, a dimensioned sketch of the cross section of the studied track is presented including the significant elements. Only the symmetric right part of the track has been represented since this area is where it is intended to reduce the vibrations. Beggining from the left of the sketch, it is represented the track followed by a 12 m wide service road which finishes at the limit with the urban area. As it is impossible to dig the trenches in the road, both active and passive barriers are located in the sides of the road. Consequently, the active trench is placed just at the end of the track while the passive trench is in the limit of the urban area where the vibration-sensitive buildings are found.
Fig. 5Dimensioned sketch of the studied cross section
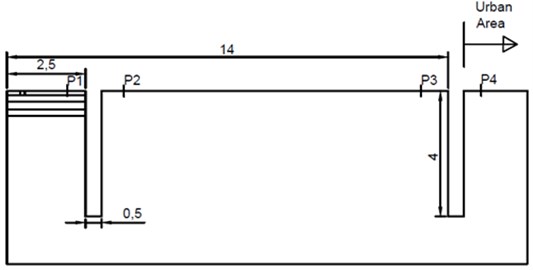
Four checkpoints in which calculate the accelerations have been selected along the propagation path of the Rayleigh waves. P1 is located between the track and the active trench and the registers at this point are important to assess if the incident waves are reflected and rebound towards the track. P2 is an indicator of the attenuation effectiveness of the active trench, while in the case of the passive trench the mitigation power is given by the comparison between registers at P3 and P4. Accelerations in P4 are the most important to evaluate the mitigation power of the trenches in the urban area isolation.
4.1. Trench parameters selection
Geometrical characteristics of the trenches (width (), depth () and position relative to the track axis ()) have been traditionally defined depending on the dominant Rayleigh wave length . In order to calculate this wavelength it is necessary to know the Rayleigh waves speed in the ground (that depends on the mechanical properties of the sands displayed in Table 1) and on the dominant frequency :
Dominant frequency is linked to the load transmitted by the passing wheel. It can be calculated as the quotient of the vehicle speed and the dimension of the elements containing the nodes in which loads are applied [11]:
Given the values of 9.72 m/s; 0.5 m and 137 m/s, it is obtained a dominant wavelength 7.05 m.
4.1.1. Width ()
Width effect was studied by Ahmad and Al-Hussaini [15] in open and in-filled trenches for passive isolation. In open trenches, the width resulted influential only for swallow trenches (0.8) while for in-filled trenches width was determinant in all cases. Yang and Hung [8] agree with the high influence of the width in swallow open trenches, while in the case of in-filled trenches a minimum of 0.3 is required. In previous publications, the influence of the width was even neglected as in Woods [16], who asserted that a simple crack would be sufficient to impede the elastic wave propagation.
In the case of the study and due to the limitations imposed by the road service, a trench width of 0.5 m has been chosen. A trench like this could be rapidly dug by a backhoe machine or by a trencher of the same dimensions of the desired width. On the other hand, if the minimum width recommended by Yang and Hung [8] is taken, a trench of 2.1 m would have been obtained for a dominant wavelength 7.05 m.
4.1.2. Depth ()
Depth has been pointed by several authors as the most influential parameter in the mitigation power of the trenches. Murillo et al. [5] stated that the isolation is proportional to the trench depth, being the effect more pronounced when 1. Yang and Hung [8] set the same minimum ratio between depth and wavelength in in-filled trenches to achieve the desired effectiveness while in open trenches the depth was found the most influential geometrical parameter. Ju [7] studied the vibration attenuation in high speed lines in which, for a train driving at a 300 km/h speed, trench depths between 25 and 90 m were tested. Furthermore, Adam and von Erstroff [17] established that the depth is much more important than the width in all the cases but the optimal dimensions of both of them must be calculated in each particular case.
The trench depth in the model is 4 m. This value is lower than the recommended in the bibliography, which suggests a minimum value of 7.05 m. However, the chosen value reduces the excavation volume, the cost of the filling materials in the in-filled trenches and the cost of the sheet piles in open trenches. Moreover, the presence of the water table at certain depths may hamper the excavation process and deteriorate the filling materials.
4.1.3. Position relative to the track axis ()
According to Woods [16], there are two different trench types depending on the position: active trenches when those are located close to the vibration source and passive trenches if trenches are constructed in the vicinity of the element which is desired to isolate. The performance of each type was studied by Çelebi et al. [6] with field experiments and it was concluded that passive isolation operates better than the active one. Position relative to the track was found insignificant by Yang and Hung [8] for both open and in-filled trenches. This last assertion contradicts Murillo et al. [5] who concluded that for expanded polystyrene in-filled trenches the distance to the source must be within the range (0.5-1.2) in order to be effective.
Two possible locations are studied in the present case: the active trench located just at the end of the track and the passive trench, which is located just before the urban area. Exact locations are depicted in Fig. 5.
4.2. Filling materials selection
Open trenches have been traditionally considered more effective than the in-filled ones in both homogeneous soil (Ahmad and Al-Hussaini [15] and Beskos [18]) and layered soil (Çelebi et al. [6] and Real et al. [11]). However, the authors always consider that open trenches are limited because of the required support of the vertical walls of the trench in non cohesive materials or deep trenches. This drawback led to the development of in-filled trenches in which the wall support is ensured. A momentous study was performed by Hung et al. [9] in which vibration due to the quasi-static load was separated from that caused by the dynamic loads. From this consideration, it was deduced that the open trenches were suitable to mitigate the vibrations induced by dynamic loads while in-filled trenches perform better attenuating vibrations caused by the moving static load. To simulate the conditions of the open trenches overcoming the support problem, Massarsch [19] used gas cushions as filling material achieving excellent attenuation results.
For in-filled trenches, the election of the most suitable material has also been discussed by numerous authors. Yang and Hung [8] and Real et al. [11] declared that stiff materials have more mitigation power than soft materials. On the other hand, Çelebi et al. [6] and El Naggar and Chebab [10] pointed that soft materials such as bentonite produce greater isolation. The use of soft filling materials was also studied by Adam and Von Erstorff [17] concluding also that these type works better than stiff materials. In addition, from this research it was evidenced the small influence of the Poisson ratio and the density of the filling material on the mitigation power; for this reason all the filling materials are chosen taking into account their stiffness. Finally, it should be commented the research of Alzawi and El Naggar [20] in which geofoam barriers were discontinuously placed. In this manner, good attenuation results were obtained reducing the amount of filling material and the excavation volume as well.
4.3. Definition of the different scenarios
Due to the large variety of available results in previous publications regarding the different mitigation barrier type (open/in-filled or active/passive) and, in the case of the in-filled trenches, considering different materials, diverse scenarios are analyzed in this study. The support of the walls of the open trenches is provided by sheet piles while in the case of in-filled trenches, two different materials are considered: reinforced concrete and expanded polystyrene (EPS).
As previously said, the material stiffness plays an important role in the isolation power of the trench. For this reason, the materials chosen as filling materials have very different Young modulus: reinforced concrete (2485 MPa) and expanded polystyrene ( 2 MPa).
According to Ahmad and Al-Hussaini [15], when the Rayleigh wave reaches the trench (either open or in-filled) three different phenomena occur: part of the incident wave is reflected moving back towards the source; another part of the Rayleigh wave is transmitted beyond the trench and finally, due to the scattering power of the trench, part of the incident Rayleigh waves are converted into body waves. These body waves (P and S waves) can either be reflected or transmitted by the trench as in the case of Rayleigh waves. Generally, in-filled trenches allow wave transmission while reflection prevails in open trenches.
In-filled trenches can be classified according to the impedance ratio (IR). This dimensionless parameter gives the relationship between the mechanical properties of the filling material and the soil into which is embedded and has been found a key parameter on mitigation by several authors as explained below:
where and are respectively the filling and soil densities and , the velocity of the Rayleigh waves in each medium. Values to calculate the IR of the different filling alternatives are shown in Table 4.
Table 4Filling materials and soil impedance parameters
(m/s) | (kg/m3) | |
Concrete | 1796 | 2400 |
EPS | 236.3 | 10 |
Soil | 136.7 | 2000 |
As Yang and Hung [8] and Hung and Ni [21] demonstrated, the attenuation power of in-filled trenches strongly depends on the filling material. Since results worsen as the IR is closer to 1 the filler must provide impedance ratios far from this value. In the studied cases, an IR of 15.8 is obtained for the concrete filling and an IR equal to 0.009 for the EPS. This fact also explains the different results obtained for the filling material by different authors in section 4.2.
Another consideration deals with the wave transmission through different interfaces in trenches. A broad approximation of the real behavior of the impinging waves may be obtained considering only perpendicular incidence on the interface. In this case, the refraction coefficient that accounts for the transmitted waves from the solid medium to the solid medium is defined as [22]:
Being the density and the Rayleigh wave velocity of each medium. These parameters are shown in Table 4. Considering that there exist two interfaces in each trench, the transmission coefficient for concrete as filling material is and for the EPS filler . Although these results have been calculated considering both interfaces for each trench; perpendicular wave incidence; absence of wave mode conversion and neglecting the wave damping into the trench, they may provide an approximated vision of the real behavior of the filling materials as in Real et al. [11]. With these simplifications of the actual performance, it is predicted that EPS would reduce more the amplitude of the incident wave than concrete because of the lower transmission coefficient of the first.
Fig. 6Combined filling materials in 0.5 m wide trenches: a) EPS-CO-EPS and b) CO-EPS-CO
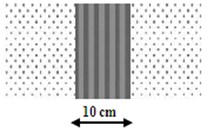
a)
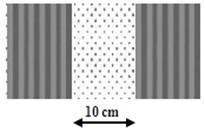
b)
Additionally, combinations of the different filling materials are tested to analyze the effect of the mixed materials on the final results (see Fig. 6). The part of the Rayleigh wave which is transmitted, reflected or converted into body waves is expected to be different from the homogeneous filling cases and therefore the trench behavior altered as well.
Furthermore, all the filling materials as well as the open trenches have been tested in the two possible locations for the trenches: active and passive isolation. The 3D FEM model scheme is shown in Fig. 7.
To evaluate the efficacy of the different alternatives, results obtained from the different scenarios are compared with the accelerations obtained in the checkpoints in the reference case, i.e. without any trench. This comparison is made using the amplitude reduction ratio, which is defined as:
where is the maximum acceleration in each scenario and is the maximum amplitude in the reference case presented in Table 5. Thus, the lower the amplitude reduction ratio is, the better attenuation result is achieved.
Fig. 7Location of the different types of trenches: a) active isolation and b) passive isolation
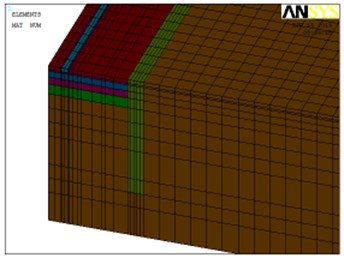
a)
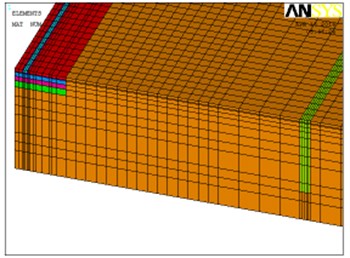
b)
Table 5Reference case A0 values
Reference case | Checkpoint | |||
1 | 2 | 3 | 4 | |
Acceleration (m/s2) | 2.918 | 1.000 | 0.470 | 0.439 |
4.4. Discussion of the results
In this section all the results obtained by the FEM model are discussed and justified. The amplitude reduction ratio is calculated for each alternative for the 4 defined checkpoints in the cases of active isolation and passive isolation. Moreover, the accelerograms corresponding to the open trench and the in-filled trenches with concrete and EPS are also presented to provide a better understanding of the wave behavior when a trench is implemented.
4.4.1. Active isolation
As it can be observed in Table 6, the open trench provides the best results in active isolation of the urban area. However, due to wave reflection phenomenon in the interface, an amplification of the vibration is produced in the checkpoint 1. This amplification may have negative effects on the railway infrastructure or even affect the comfort of the passengers. This undesired effect must be specially considered in ballasted tracks where the degradation of the ballast layer may occur as a consequence of the vibrations according to López Pita [23].
Table 6Active isolation ARR results
Active isolation | Checkpoint | |||
1 | 2 | 4 | ||
Filling material | Open | 1.62 | 0.10 | 0.07 |
Concrete | 0.53 | 0.46 | 0.59 | |
EPS | 0.94 | 0.22 | 0.23 | |
EPS-CO-EPS | 1.21 | 0.11 | 0.17 | |
CO-EPS-CO | 0.58 | 0.20 | 0.35 | |
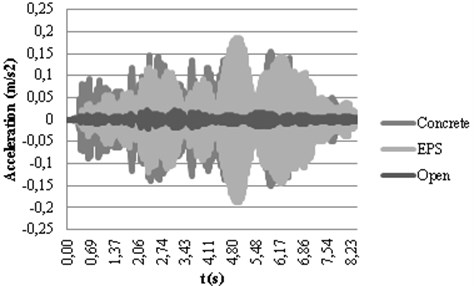
For a better understanding of the dynamic behavior, the calculated accelerograms corresponding to the active isolation have been represented in Fig. 8. In Fig. 8(a), it can be observed how the open trench causes the highest acceleration because of the wave reflection explained before. On the other hand, the concrete absorbs the wave transmitting it to the other side of the trench where the higher accelerations correspond to this type of in-filled trench. Moreover, the lower acceleration at this point corresponds to the open trench since most of the energy has been reflected backwards the track. Trenches filled with EPS provide intermediate results in both checkpoints when compared to concrete filling and the open trench in active isolation.
Fig. 8Calculated accelerograms in checkpoints 1 a) and 2 b) with active isolation
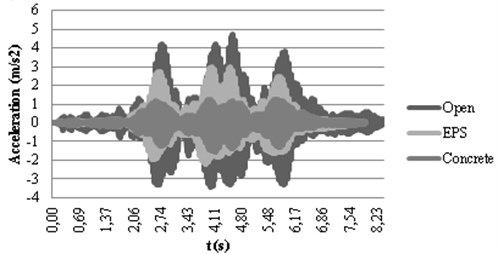
a)
b)
When comparing Fig. 8(a) and (b), it can be seen how the original shape of the accelerogram, where the effect of the different bogies could be observed as in Fig. 4, fades after the trench. This effect is more pronounced in the case of the open trench since the gap totally disrupts the propagation path of the Rayleigh waves and forces the waves to pass beneath the bottom of the trench, altering the vibration response after the trench.
The concrete trench reduces the vibrations about 50 % both in the track and in the urban area, thus achieving an equilibrated solution in both locations. EPS obtains good attenuation results in checkpoint 4 without increasing the accelerations in the track structure. A better solution is achieved by using the combination CO-EPS-CO that drops to 0.154 m/s2 the peak acceleration in checkpoint 4, maintaining low levels in the track.
4.4.2. Passive isolation
Passive isolation, i.e. when the trench is placed in the vicinity of the isolated element, globally presents better results than the active isolation. The mitigation power is more marked in the case of open trenches and stiff filling materials (concrete and CO-EPS-CO). However, soft materials (EPS and EPS-CO-EPS) do not yield as good isolation results as the rest of the materials in checkpoint 4. As it happened in the active isolation, wave amplification is produced before the open trench but, in this case, the possible negative effect on the service road is not as dangerous as on the track in the active isolation.
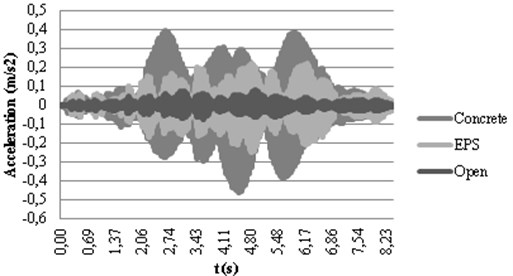
Fig. 9Calculated accelerograms in checkpoints 3 a) and 4 b) with passive isolation
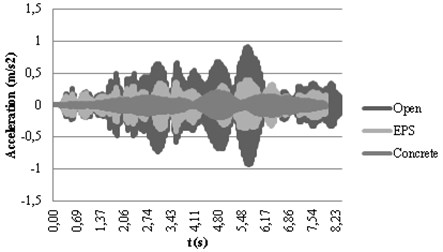
a)
b)
In Fig. 9(a) this effect of amplification for the open trenches in the point 3 can be ascertained since open trenches yield the highest acceleration peak at this point. Results agree with the explained for active isolation regarding the dynamic behavior of the different materials. However, the alteration of the accelerograms shape is more evident in passive isolation. This fact can be explained by the large distance existing between the passive trench and the vibration source where the soil damping mechanisms affect the wave propagation.
In passive isolation, differences obtained in checkpoint 4 for the different filling materials do not vary as much as in the active isolation. An explanation to this fact can be found in the Rayleigh wave propagation path: the Rayleigh wave is completely developed when it reaches the passive trench and a large amount of the energy propagates beneath the bottom of the trench. In the case of the active isolation, the trench is located close to the source and it means that the Rayleigh wave is not yet too deep and propagates in shallow depths. Therefore, in active isolation, the effect of the filling materials is more determining than in the case of passive isolation.
Table 7Passive isolation ARR results
Passive isolation | Checkpoint | |||
1 | 3 | 4 | ||
Filling material | Open | 0.94 | 1.42 | 0.05 |
Concrete | 0.97 | 0.43 | 0.35 | |
EPS | 1.02 | 0.85 | 0.42 | |
EPS-CO-EPS | 0.94 | 0.98 | 0.53 | |
CO-EPS-CO | 0.94 | 1.14 | 0.30 | |
5. Conclusions
On the basis of the previous results, the following conclusions can be established:
• In spite of the existing limitations imposed by the track environment on the trench geometry, significant mitigation results can be achieved. With this purpose, the trench location (active or passive isolation), type (open or in-filled) and the filling materials are varied to assess the mitigation power.
• In passive isolation, results are better in the case of open trenches and stiff filling materials. In active isolation, soft materials perform better than in the passive isolation.
• Filling material is more determining in active isolation. In passive isolation the screening effect of the barrier is not as significant as in the active isolation for shallow trenches.
• In the case of active isolation using open trenches or in-filled trenches with soft materials, the reflection of the waves at the interfaces must be considered. These reflections may negatively affect to the passenger comfort in any case and to the ballast layer degradation in the case of ballasted tracks.
• Soft and stiff combined filling materials contribute to equilibrate the advantages and drawbacks of open and stiff material-filled trenches. In this manner, the reduction of the vibrations in the sensitive area is achieved at the same time that the wave reflection towards the track is avoided.
• Restrictions on the trench characteristics are different in each particular case but the results obtained from this study of a real track stretch can be used in different scenarios to choose the location, typology and, if exists, filling material that produces the highest mitigation.
References
-
Auersch L. The excitation of ground vibration by rail traffic: theory of vehicle-track-soil interaction and measurements on high-speed lines. Journal of Sound and Vibration, Vol. 284, Issue 1-2, 2005, p. 103-132.
-
Galvín P., Domínguez J. Experimental and numerical analyses of vibrations induced by high-speed trins on the Córdoba-Málaga line. Soil Dynamics and Earthquake Engineering, Vol. 29, Issue 4, 2009, p. 641-657.
-
Kouroussis G., Verlinden O., Conti C. On the interest of integrating vehicle dynamics for the ground propagation of vibrations: the case of urban railway traffic. International Journal of Vehicle Mechanics and Mobility, Vol. 48, Issue 12, 2010, p. 1553-1571.
-
Leilei X. Influence of in-filled trench as wave barrier on ground vibrations. MSc Thesis, Royal Institute of Technology, Stockholm, 2012.
-
Murillo C., Thorel L., Caicedo B. Ground vibration isolation with geofoam barriers: Centrifugue modeling. Geotextiles and Geomembranes, Vol. 27, Issue 6, 2009, p. 423-434.
-
Çelebi E., Firat S., Beyhan G., Çankaya I., Vural I., Kirtel O. Field experiments on wave propagation and vibration isolation by using wave barriers. Soil dynamics and earthquake engineering, Vol. 29, Issue 5, 2009, p. 824-833.
-
Ju S. H. Three-dimensional analyses of wave barriers for reduction of train-induced vibrations. Journal of Geotechnical and Geoenvironmental Engineering, Vol. 130, Issue 7, 2004, p. 740-748.
-
Yang Y. B., Hung H. H. A parametric study of wave barriers for reduction of train-induced vibrations. International Journal for Numerical Methods in Engineering, Vol. 40, Issue 20, 1997, p. 3729-3747.
-
Hung H. H., Yang Y. B., Chang D. W. Wave barriers for reduction of train-induced vibrations in soils. Journal of Geotechnical and Geoenvironmental Engineering, Vol. 130, Issue 12, 2004, p. 1283-1291.
-
El Naggar M. H., Chehab A. G. Vibration barriers for shock-producing equipment. Canadian Geotechnical Journal, Vol. 42, Issue 1, 2005, p. 297-306.
-
Real J. I., Galisteo A., Real T., Zamorano C. Study of wave barriers design for the mitigation of railway ground vibrations. Journal of Vibroengineering, Vol. 14, Issue 1, 2012, p. 408-422.
-
El Kacimi A., Woodward P., Laghrouche O., Medero G. Time domain 3D finite modeling of train-induced vibration at high speed. Computers and Structures, Vol. 118, Issue 8, 2013, p. 66-73.
-
Real J. I., Galisteo A., Asensio T., Montalbán L. Study of railway ground vibrations caused by rail corrugation and wheel flat. Journal of Vibroengineering, Vol. 14, Issue 4, 2012, p. 1724-1733.
-
Griffin M. Handbook of Human Vibration. Academic Press, USA, 1996.
-
Ahmad S., Al-Hussaini T. M. Simplified design for vibration screening by open and in-filled trenches. Journal of Geotechnical Engineering-ASCE, Vol. 117, Issue 1, 1991, p. 67-88.
-
Woods R. Screening of surface waves in soils. Journal of Soil Mechanics and Foundations, Vol. 94, 1968, p. 951-979.
-
Adam M., Von Estorff O. Reduction of train-induced building vibrations by using open and filled trenches. Computers and Structures, Vol. 83, Issue 1, 2005, p. 11-24.
-
Beskos D. E., Dasgupta B., Vardoulakis I. G. Vibration isolation using open or filled trenches. Computational Mechanics, Vol. 7, Issue 2, 1989, p. 137-148.
-
Massarsch K. R. Vibration isolation using Gas-filled Cushions. Soil Dynamics Symposium in Honor of Professor Richard D. Woods, Austin, Texas, 2005.
-
Alzawi A., El Naggar M. H. Vibration scattering using geofoam material as vibration wave barriers. GeoHalifax, 52nd Canadian Geotechnical Conference, Halifax, Canada, 2009.
-
Hung C. C., Ni S. H. The horizontal amplitude screening effect of a rectangular strip in-filled trench. Journal of the Chinese Institute of Engineers, Vol. 36, Issue 7, 2013, p. 932-940.
-
Müller G. Theory of Elastic Waves. Frankfurt, Postdam and Hamburg Universities, Germany, 2007.
-
López Pita A., Teixeira P., Robusté F. High speed and track deterioration: the role of vertical stiffness of the track. Journal of Rail and Rapid Transit, Vol. 218, Issue 1, 2004, p. 31-40.
About this article
