Abstract
Driver fatigue is an important cause of traffic accidents and the detection of fatigue driving has been a hot issue in automobile active safety during the past decades. The purpose of this study is to develop a novel method to detect fatigue driving based on electroencephalogram (EEG). The volunteer is asked to perform simulated driving tasks under different mental state while EEG signals are acquired simultaneously from six electrodes at central, parietal and occipital lobe, including C3, C4, P3, P4, O1 and O2. Due to the non-linearity of human brain responses, correlation dimension is estimated with G-P algorithm to quantify the collected EEGs. Statistical analysis reveals significant decreases from awake to fatigue state of the correlation dimension for all the channels across 5 subjects (awake state: 3.87±0.13; fatigue state: 2.76±0.34; 0.05, paired -test), which indicates that the correlation dimension is a promising parameter in detecting fatigue driving with EEGs.
1. Introduction
Fatigue driving is believed to be a major problem in public traffic [1]. Despite the methodological difficulties of reliably assessing the causes of fatal traffic accidents, it is concluded that 1-20 % of fatal traffic accidents are caused by driver fatigue [2, 3]. In China, fatigue driving is the leading cause of fatal traffic accidents on highway and hundreds of thousands of people are killed or wounded from it each year [4]. Consequently, the detection of fatigue driving has been an increasingly hot issue in automobile active safety during the past decades.
Many attempts have been made to solve this problem. For example, changes in vehicle and driver behavior, such as steering angle, vehicle lateral position, vehicle speed and vehicle yaw rates, are used to detect driver fatigue. Fukuda et al. demonstrated that steering wheel movement is correlated with driver fatigue [5]. Takei et al. employed Fast Fourier Transform (FFT) and wavelet transform to analyze steering angle signals and features which can reflect driver fatigue were well extracted [6]. However, fatigue driving detection based on driver behavior is prone to interference by external conditions such as vehicle type, road condition and driving habits.
Another way to detect fatigue driving is based on physical or physiological indicators related to the human body, such as EEG, eye blinking rate, heart rate and pulse rate. In the previous researches, driver fatigue can be subdivided into sleep related and task related fatigue [7]. Wherein, EEG signals are direct measurement of human brains and are widely used in diagnosis of disease related to epilepsy [8-11]. Furthermore, EEG is also regarded as the “golden standard” of the detection of fatigue with high reliability and sensitivity since both sleep related and task related fatigue originated from human brains. Jap et al. measured continuous EEG spectral in 52 drivers (36 males and 16 females) to detect fatigue driving [12]. Results show stable delta and theta activities over time, a slight decrease of alpha activity and a significant decrease of beta activity when the driver got fatigue. Simon et al. used alpha spindle in EEG as indicators of driver fatigue under real traffic conditions [13]. It indicates that alpha spindle parameters increase when the drivers are in fatigue condition. Compared with EEG alpha-band power algorithm, alpha spindle of EEG signals could increase both fatigue detection sensitivity and specificity.
On the other hand, human brains are complicatedly non-linear and dynamical systems. As a result, EEG analysis methods, implementing theory of dynamical systems and, particularly, deterministic chaos allow judging generalization of brain processes or their variability [14]. In this paper, we present a new EEG-based method to detect driver fatigue using correlation dimension. The content of this study is laid out in 4 sections with this section as introduction. We briefly describe the fundamental theory of correlation dimension and determination of parameters when calculating correlation dimension in section 2. In section 3, the simulated driving experiment with simultaneous EEG recording is introduced and EEG analysis result with correlation dimension is discussed in detail. Finally, the conclusions are given in section 4.
2. Methods
2.1. Fundamental theory of correlation dimension
In chaos theory, correlation dimension is a measure of the complexity of a non-linear process which characterizes the distribution of points in the phase space. Correlation dimension is defined as:
where is the total number of hypercubes of slide length that covers the attractor, and is the probability of finding a point in the hypercube . Usually, correlation dimension can be estimated by G-P algorithm proposed by Grassberger and Procaccia in 1983 [15-16].
Given a time series , , the phase space , is constituted as:
where represents the embedding dimension and indicates the time delay. It can be proved that the correlation integral is approximately equal to the probability that the Euclidean distance between a pair of points , in phase space [15], which can be calculated with:
where is the Heaviside step function and represents the maximum norm. is the radius of the sphere and is the number of samples. is determined as:
In order to estimate the correlation dimension, the curve is plotted. With the increment of the embedding dimension , the slope of the curve will tend to be a constant, which represents the value of correlation dimension.
2.2. Parameters optimization
Since EEG signals reflect cortical dynamics in human brains, correlation dimension is often interpreted as a measure of complexity of information processing, and it can used as an index of the integration of information in the brain. Previous studies also show that correlation dimension is very useful in comparing different physiologic states. For correct estimation of correlation dimension, it is necessary to set correct embedding dimension and time delay .
Generally, there are no universal algorithms to estimate the optimal value of time delay . Instead, there are some recommendations to use. The main idea of these recommendations is that the delay vectors should be independent of each other [17]. This could be achieved by analyzing mutual information between the original signal and its shifted versions. According to the most common practice, the first minimum of the mutual information is selected to ensure the components of the reconstruction vectors would be relatively independent [18]. Following this idea, vectors built-up from delay coordinates are used for the reconstruction. As a result, the vectors are constructed with a time delay 20, which corresponds to 20 ms.
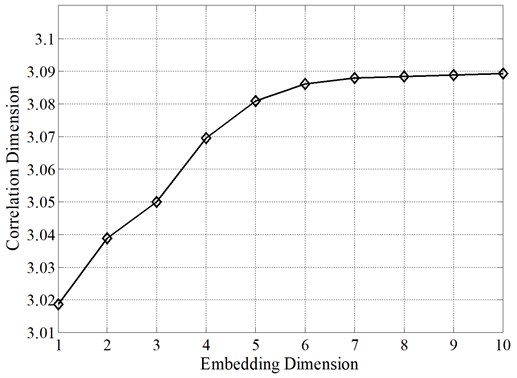
Then, an EEG time series including 60,000 points (sampling frequency 1000 Hz) is used to estimate the optimal embedding dimension. Correlation dimension is calculated by G-P algorithm, with time delay 20 and varied embedding dimension . Results show that the estimated correlation dimension increases with embedding dimension , as shown in Fig. 1. Specifically, correlation dimension increases sharply when embedding dimension ranges from 1 to 7 and becomes relatively stable when embedding dimension is larger than 8. Thus, the optimal value of embedding dimension is set to 8.
Fig. 1Determination of optimal embedding dimension m
3. Experiment design and results
3.1. Experiment design
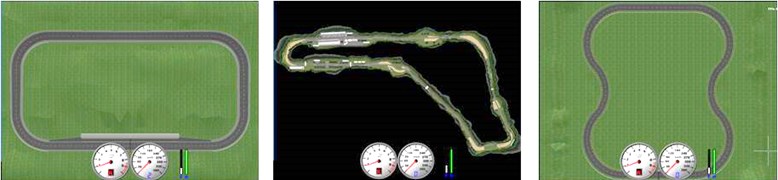
The experiment is carried out on a simulated driving platform which is composed of an electronic steering wheel (Logitech G25) and a car racing simulator software (TORCS). The Logitech G25 is an electronic steering wheel designed for simulated racing video games on the PC using a USB interface (Logitech, Newark, CA). It has a pressure sensitive D-Pad, manual sequential and paddle shifters, 900° steering angle, brake, clutch and accelerate pedal. Here, we use the automatic transmission mode to simplify the operation. TORCS (The Open Racing Car Simulator) is an open source 3D car racing simulator available for Microsoft Windows and developed by Eric Espie and Chritophe Guionneau. It is designed to enable pre-programmed AI drivers to race against one another, while allowing the user to control a vehicle using either a keyboard, mouse, or wheel input like Logitech G25. When the subject performs driving tasks on the simulated driving platform, EEG signals are recorded simultaneously for further analysis, as shown in Fig. 2. Thereinto, one of three different driving roadmaps in Fig. 3 is selected randomly for a driving task. Subjects are asked to finish the experiments in two different cognitive states: awake and fatigue. The awake experiment is conducted at 9:00-11:00 AM and the fatigue experiment is executed when the subject is extremely drowsy after sleep deprivation.
Fig. 2EEG signal acquisition on a simulated driving platform
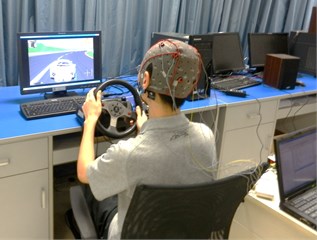
Fig. 3Driving roadmaps
3.2. Subjects and EEG recordings
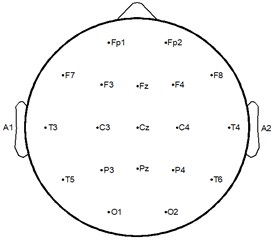
Subjects are studied after giving informed written consent in accordance with a protocol approved by the institutional review board of Xi’an Jiaotong University. Five right-handed healthy male subjects (age 21-26) participated in the experiments. They are requested to sit on a comfortable armchair in an ordinary lighting office room with no electromagnetic shielding. All of them have normal or corrected-to-normal eyesight. The subjects are asked to reduce body movements to collect EEG signals with less noise. EEG signals are acquired with a g.USBamp (g.tec inc., Austria) system and sampled at 1000 Hz. Exploring cup electrodes are fixed to the scalp at C3, C4, P3, P4, O1, O2 according the International 10-20 System, as shown in Fig. 4. The reference electrode is located at left earlobe (A1). The acquired EEG signals are band-pass filtered from 2 to 60 Hz and notch filtered between 48-52 Hz to remove power line interference. All electrode impedances are kept below 5 during experiments.
Fig. 4The international 10-20 system for EEG electrode placement
3.3. Results
Five participants are asked to perform the driving tasks for 10 times under awake and fatigue state, respectively. Each driving task is to finish one lap randomly selected from the driving roadmaps in Fig. 3. Generally it takes 1.5-2.5 minutes to finish on lap. Typical EEG signals while performing driving tasks in awake and fatigue state are shown in Fig. 5. From the acquired time series, it is rather difficult to decide whether the subject is in awake or fatigue state.
Fig. 5Acquired EEG signals while performing simulated driving tasks in (a) awake and (b) fatigue state
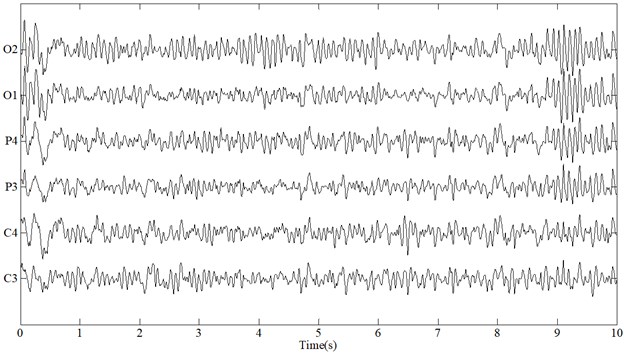
(a)
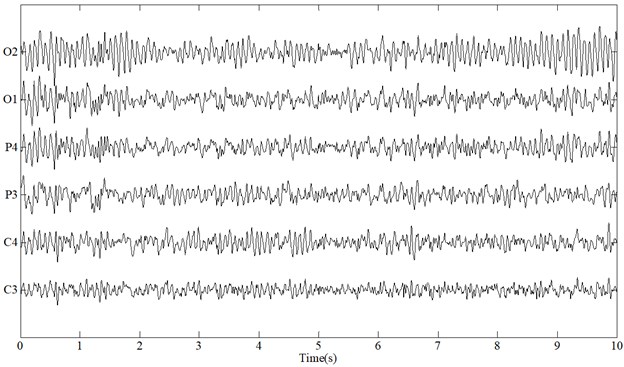
(b)
Then, the middle 1 minute EEG signals, which include less noise, are used to calculate the correlation dimension to differentiate fatigue from awake state. The statistical results of correlation dimension of EEG signals in awake and fatigue state across all 5 subjects are shown in Table 1 and 2. It indicates that the correlation dimension in awake state for all 5 electrodes are larger than 3.5, whereas the correlation dimension in fatigue state for most electrodes are below 3.
Table 1Correlation dimension in awake state
Electrode Subject | C3 | C4 | P3 | P4 | O1 | O2 |
1 | 3.71 | 3.97 | 4.21 | 4.02 | 3.87 | 4.03 |
2 | 3.94 | 3.87 | 3.67 | 3.96 | 3.80 | 3.74 |
3 | 3.52 | 4.09 | 3.81 | 3.97 | 3.73 | 3.67 |
4 | 3.89 | 3.76 | 3.64 | 3.95 | 4.00 | 3.88 |
5 | 3.84 | 4.15 | 3.92 | 3.87 | 3.71 | 3.90 |
Mean | 3.78 | 3.968 | 3.85 | 3.954 | 3.822 | 3.844 |
Standard deviation | 0.1508 | 0.1420 | 0.2062 | 0.0484 | 0.1053 | 0.1265 |
Table 2Correlation dimension in fatigue state
Electrode Subject | C3 | C4 | P3 | P4 | O1 | O2 |
1 | 2.03 | 2.91 | 2.02 | 2.03 | 2.97 | 2.01 |
2 | 2.29 | 3.23 | 2.66 | 3.16 | 3.05 | 2.10 |
3 | 3.08 | 3.12 | 3.22 | 3.07 | 2.53 | 2.75 |
4 | 2.46 | 2.79 | 2.81 | 2.67 | 3.11 | 3.05 |
5 | 3.21 | 2.99 | 2.82 | 2.89 | 2.78 | 2.86 |
Mean | 2.614 | 3.008 | 2.706 | 2.764 | 2.888 | 2.554 |
Standard deviation | 0.4565 | 0.1544 | 0.3901 | 0.4035 | 0.2107 | 0.4195 |
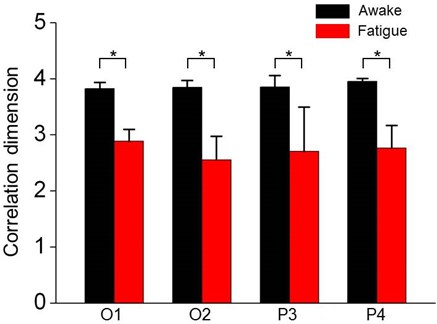
Further, a comparison of correlation dimension between awake and fatigue state is made to see if they are significantly different. Fig. 6 visualizes the results by showing the means for O1, O2, P3 and P4 electrode over all subjects. It indicates that the correlation dimension of awake state is significantly larger than that of fatigue state (0.05, paired -test). Similar statistical results can be found on C3 and C4 electrode. Briefly, there is significant change in EEG on central, parietal and occipital lobe when the subjects get fatigue. More importantly, the correlation dimension of EEG signals is efficient to quantify the difference between awake and fatigue, which indicates that the correlation dimension is a promising parameter in detecting fatigue driving with EEG signals.
Fig. 6Comparison of correlation dimension in awake and fatigue state for O1, O2, P3 and P4 electrode. Values represent averages over all subjects. Error bars indicate the standard deviation of the means (*p< 0.05, paired t-test)
4. Conclusion
In this paper, a novel method to detect driver’s fatigue based on EEG is proposed. Subjects are asked to perform simulated driving tasks under awake and fatigue states while simultaneous EEG at central, parietal and occipital lobe are acquired. Correlation dimension is used to quantify the change of EEGs to differentiate fatigue from awake states and optimal parameters including embedding dimension and time delay when calculating correlation dimension is discussed. Results show that for all the 6 electrodes across 5 subjects, there is significant decrease of correlation dimension when the subjects are getting fatigue (awake state: 3.87±0.13; fatigue state: 2.76±0.34; 0.05, paired -test). Thus, correlation dimension is proved to be a promising parameter in detecting fatigue driving with EEGs.
However, the fatigue state in our experiments is derived by sleep deprivation, which means the subjects are in heavy fatigue condition. It would be better if mild fatigue can be correctly detected. This is what our research work will focus on next.
References
-
S. Folkard Black times: temporal determinants of transport safety. Accid. Anal. Prev., Vol. 29, Issue 4, 1997, p. 417-430.
-
J. Horne, L. Reyner Vehicle accidents related to sleep: a review. Occupational and Environmental Medicine, Vol. 56, Issue 5, 1999, p. 289-294.
-
J. Connor, R. Norton, S. Ameratunga, E. Robinson, I. Civil, R. Dunn, et al. Driver sleepiness and risk of serious injury to car occupants: population based case control study. British Medical Journal, Vol. 324, Issue 5, 2002, p. 1125-1128.
-
X. Yuan, X. M. Sun Development of driver fatigue detection method research. Chinese Journal of Automotive Engineering, Vol. 2, Issue 3, 2012, p. 157-160.
-
J. Fukuda, E. Akustu, K. Aoki Estimation of driver’s drowsiness level using interval of steering adjustment for lane keep. JSAE Review, Vol. 16, Issue 2, 1995, p. 197-199.
-
Y. Takei, Y. Furukawa Estimate of driver’s fatigue through steering motion. IEEE International Conference on Systems, Man and Cybernetics, Waikoloa, HI, USA, 2005, p. 1765-1770.
-
J. F. May, C. L. Baldwin Driver fatigue: the importance of identifying causal factors of fatigue when considering detection and countermeasure technologies. Transportation Research Part F, Traffic Psychology and Behavior, Vol. 12, Issue 3, 2009, p. 218-224.
-
G. H. Xu, J. Wang, Q. Zhang, S. C. Zhang, J. M. Zhu A spike detection method in EEG based on improved morphological filter. Computers in Biology and Medicine, Vol. 37, Issue 11, 2007, p. 1647-1652.
-
J. Wang, Q. Zhang, Y. Z. Zhang, G. H. Xu Automatic artifacts removal from epileptic EEG using a hybrid algorithm. Journal of Vibroengineering, Vol. 15, Issue 1, 2013, p. 477-487.
-
Y. Z. Zhang, G. H. Xu, J. Wang, L. Liang An automatic patient-specific seizure onset detection method in intracranial EEG based on incremental nonlinear dimensionality reduction. Computers in Biology and Medicine, Vol. 40, Issue 11, 2010, p. 889-899.
-
L. L. Li, G. H. Xu, J. Wang, X. W. Cheng Automatic detection of epileptic slow-waves in EEG based on empirical mode decomposition and wavelet transform. Journal of Vibroengineering, Vol. 15, Issue 2, 2013, p. 961-970.
-
B. T. Jap, S. F. Lal, B. E. Peter Using EEG spectral components to assess algorithms for detecting fatigue. Expert Systems with Applications, Vol. 36, Issue 2, 2009, p. 2352-2359.
-
M. Simon, E. A. Schmidt, W. E. Kincses, M. Fritzsche, A. Bruns, C. Aufmuth, et al. EEG alpha spindle measures as indicators of driver fatigue under real traffic conditions. Clinical Neurophysiology, Vol. 122, Issue 6, 2011, p. 1168-1178.
-
A. Mekler Calculation of EEG correlation dimension: Large massifs of experimental data. Computer Method and Programs in Biomedicine, Vol. 92, Issue 1, 2008, p. 154-160.
-
P. Grassberger, I. Procaccia Measuring the strangeness of strange attractors. Physica D, Nonlinear Phenomena, Vol. 9, Issue 1, 1983, p. 189-208.
-
P. Grassberger, I. Procaccia Characterization of strange attractors. Physical Review Letters, Vol. 50, Issue 5, 1983, p. 346-349.
-
F. Takens Detecting strange attractors in fluid turbulence. Lecture Notes in Mathematics, Vol. 898, 1981, p. 366-381.
-
A. Galka Topics in nonlinear time series analysis, with implications for EEG analysis. Advanced Series in Nonlinear Dynamics, World Scientific, Singapore, 2000.
About this article
This work is supported by the National Natural Science Foundation of China (approval No. 51005176), Ph. D. Program Foundation of Ministry of Education of China (approval No. 20100201120003), Overseas Returnees Foundation of Ministry of Education of China and Special Program of the Postdoctoral Science Foundation of China (approval No. XJ2013045).
