Abstract
This paper demonstrates possibilities for evaluation dimensions and shape of metal discontinuities by means of ultrasonic imaging flaw detector with digital focusing of antenna array (DFA). Examples of images with patterns of discontinuities in reference blocks and actual products are presented. Characteristics of these images are given and discussed in detail.
1. Introduction
Ultrasonic (US) imaging flaw detectors with digital focusing of antenna array (DFA) implement an improved option of the synthetic aperture focusing technique (SAFT) [1-7]. They possess with wider possibilities for evaluation of dimensions and type of discontinuities detected in metals as compared with instruments based on the phased antenna array.
Due to various operation algorithms, the US flaw detector “А1550 IntroVisor” based on the DFA technique makes it possible to display on a screen the patterns of discontinuities reflecting US waves diffusively or mirror-like, as well as both types of these discontinuities [8, 9]. Type and orientation of large enough discontinuities can be identified by the shape of their patterns, while their actual dimensions can be evaluated by geometrical parameters of patterns. It is very important for trustworthy diagnostics of hazardous industrial facilities like pipelines and high-pressure vessels or ones containing aggressive media. Unsoundness of small-size discontinuities is calculated with application of two-dimensional DGS-diagram.
2. Properties and possibilities of DFA technique
US flaw detector “А1550 IntroVisor” is designed for operation with linear antenna arrays (AA) of longitudinal and transverse US waves. Images of the TO (test object) vertical sections (V-tomographic presentations) formed on the detector monitor represent the rectangular raster. They are reconstructed from the full set of independent implementations of US oscillations obtained in the every AA position on the TO surface from all possible pairs of its elements (transmitter-receiver). Every point of image is calculated as a result of focusing of the AA aperture into the point of visualized TO section corresponding to it [7, 9]. Therefore, the TO material structure is represented adequately in the Cartesian reference system “depth – distance to reflector on the TO surface”.
Along with ordinary algorithm of the AA aperture synthetic focusing assuming no bottom surface in the TO, reconstruction algorithms operating with US signals reflected from external and bottom boundaries of the TO of thickness are implemented in the instrument. Operation principle of such algorithms is explained by diagram presented in Fig. 1. It shows that probing signal from any AA element comes to the arbitrary point with , coordinates not only by the shortest way, but being reflected several times from the layer boundaries as well. Also, echo signals from the point return to any AA element by different ways. In the process of tomographic image reconstruction, echo signals are summed selectively: signals with even total number of reflections from the TO boundaries are summed for visualization of diffusively scattering discontinuities, while signals with odd number – for mirror-like reflecting ones. Algorithm using all signals (multi-algorithm) provides contouring of discontinuities of both types being maximal close to actual situation [9].
Fig. 1Diagram of emission signal propagation ways within the flat metal layer
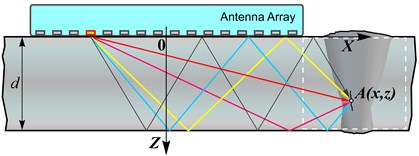
Fig. 2 shows tomographic image of the steel bar of 30 mm thickness having three side holes of 1.5 mm diameter and vertical gap in the bottom surface of 5 mm height. Image is obtained by means of multi-algorithm from signals on the inclined AA of transverse US waves with 4 MHz rated frequency. Diffusively scattering side holes and mirror-like reflecting gap are drawn quite adequately to their actual position in specimen.
Fig. 2Tomographic image of the steel specimen with flaw samples
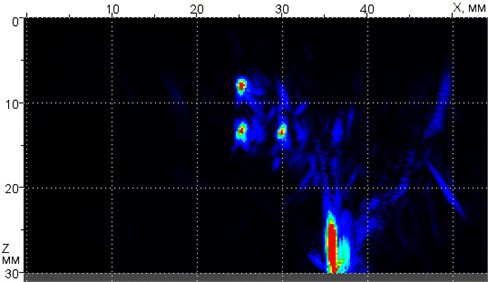
Fig. 3Tomographic images of large-size discontinuity within the steel plate of 40 mm thickness reconstructed under even (left) and odd (central) algorithms, as well as under multi-algorithm (right)
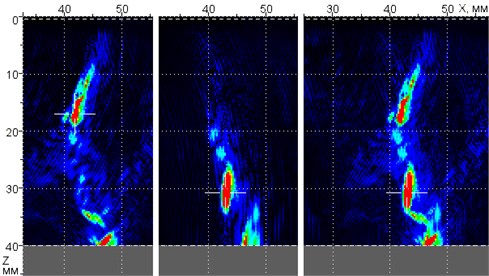
Differences in patterns of large discontinuity in the steel plate can be seen in Fig. 3, where fragments of three tomographic images obtained under different algorithms with AA in permanent position on the TO surface are shown. Left tomographic image is reconstructed from signals with even number of reflections from the plate boundaries, central one – from signals with odd number of reflections, and right one was calculated under multi-algorithm [9].
On these images, it is seen that discontinuity surface has flat, almost vertical section at the depth from 26 to 35 mm. Rough sections of surface are represented only by even algorithm (on the left tomographic image). Central tomographic image does not present at all the part of pattern at the depth from 10 to 19 mm. This indicates that ultrasound is scattered diffusively by this part of discontinuity. Almost horizontal pattern on the left tomographic image with 45 mm, 35 mm coordinates belongs also the rough surface section. Multi-algorithm allowed all sections of discontinuity to be drawn. Following the plate saw-cutting, the cavity with height of about 30 mm was discovered. The shape of its surface fits well with presented images.
3. Preliminary evaluation of discontinuities
When some discontinuity in the actual TO is detected, its pattern on the screen makes it possible to identify preliminarily the ways to be governed by during determination of its dimensions. Experiments have shown the following: if during testing on 4-5 MHz frequencies, the pattern of discontinuity located within the double size of the AA active aperture (it means 80 mm for “А1550 IntroVisor”) is elongated in some direction for more than 4-5 mm, this discontinuity is larger noticeably the wavelength. In this case, its dimensions can be measured directly on the instrument screen. If the on-screen pattern does not exceed 3 mm, discontinuity should be evaluated by the pattern amplitude using two-dimensional DGS-diagram.
Diffusively scattering discontinuities (like side small diameter holes, pores, sharp edges of cracks) provide usually tomographic patterns in the form of ellipse with minor axis depending on duration of emission pulses and with major one – on the angle, at which the AA aperture is “seen” from the part of discontinuity. With increasing of slant distance or reducing of depth at constant distance, this angle decreases and the pattern major axis increases. Discontinuities with dimensions of the order of 2-3 wavelengths provide already patterns being closer to the profile of reflecting surfaces.
Fig. 4Patterns of side holes of 1.5 mm diameter within the steel of 20 grade at slant distance to the nearest hole equal to 60 mm (top) and 173 mm (bottom)
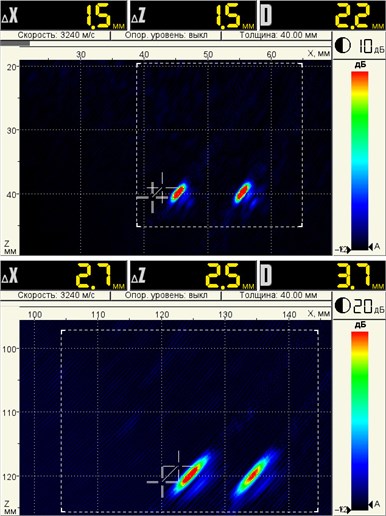
Fig. 5Patterns of the end-face flat-bottom holes of 3 mm diameter within the steel of 20 grade at slant distance to holes equal to 55 mm (top) and 125 mm (bottom)
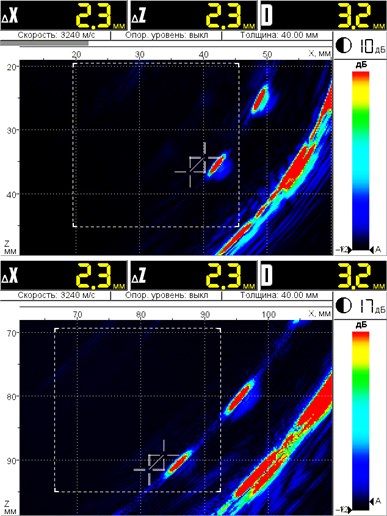
Correspondence of flat reflectors with their patterns on the flaw detector screen was evaluated using steel specimens with flat-bottom holes performed at different inclination angles. Hole bottoms were looking like ellipses lesser than patterns of the diffusively scattering reflectors, i.e. side holes. Their shape was similar mostly with the straight-line segment, while length and inclination corresponded almost with the bottom diameter and inclination.
Figs. 4 and 5 shows tomographic images illustrating difference between patterns of diffusive reflectors and flat ones possessing with some directivity of the scattering indicatrix. Arc-shaped patterns in Fig. 5 belong to the specimen cylindrical surface, where flat-bottom holes are drilled.
Patterns of side holes (Fig. 4) are more compact than patterns of flat-bottom ones (Fig. 5), especially in the case of small slant distance (top tomographic images in Figs. 5 and 6). However, with small and large slant distances, dimensions of side hole patterns are different: 2.2 mm at small distance and 3.7 mm at large distance. Unlike, at small and large distances, dimensions of the flat-bottom hole patterns are almost similar, while their inclination in relation to vertical line is close to actual inclination of hole bottoms.
This correspondence on the reflector patterns with reality starts to manifest itself, when dimensions of flat reflectors exceed the wavelength in 2-3 times. These dimensions can be considered as conventional boundary between diffusively and mirror-like reflecting discontinuities.
4. Evaluation of discontinuities of large wave sizes
In most cases, dimensions of the on-screen patterns of discontinuities correspond with their physical dimensions of the order of three and more US oscillation wavelengths. When volumetric discontinuity is irradiated from different sides by the inclined AA, it is possible to evaluate its shape.
Fig. 6Photo of the cross-section of weld joint with inner cavity discovered in it
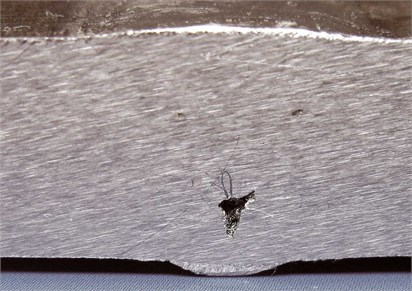
Fig. 7Tomographic sections of the weld joint with cavity shown in Fig. 6 obtained with AA located to the left (left) and to the right (right) from seam
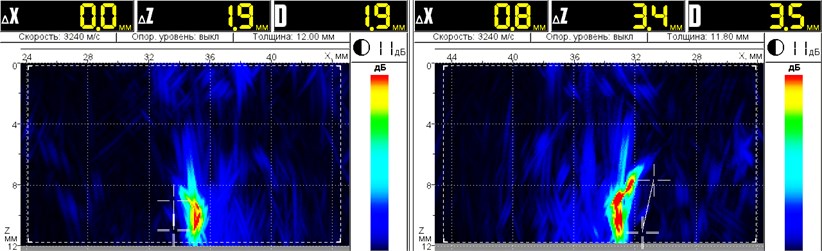
Photo in Fig. 6 demonstrates the microscopic section of weld joint with cavity detected in it. Fig. 7 presents tomographic images of this section located in correspondence with the AA positions to the left and to the right from reinforcing bead. They are obtained prior saw-cutting of the joint by the detected discontinuity. Base metal thickness to the left is equal to 12 mm, while to the right – 11.8 mm. These thicknesses were entered into the instrument memory for correct reconstruction of images.
From comparison of photo and tomographic images, it is seen that pattern shapes of the left and right walls of cavity look like actual shapes of walls. Length of the left wall pattern (1.9 mm) coincides practically with actual height of the cavity left wall, length of the right wall pattern (3.5 mm) appears to be larger by 15 % as compared with its actual size. Larger dimension of cavity did not fall, probably, in the saw-cut section.
5. Evaluation of discontinuities of small wave sizes
Like in traditional flaw detection, dimensions of discontinuities commensurable with a wavelength can be featured only by equivalent dimensions and can be evaluated by amplitudes (intensity) of patterns on the screen. To that end, two-dimensional DGS-diagram is used. Since location of reflectors in the visualized section is defined by two coordinates and , this diagram represents the family of 2D functions.
For elaboration of two-dimensional DGS-diagram in order to introduce it into calculation process of the “А1550 IntroVisor” instrument, numerical simulation of the reconstruction algorithm for image of vertical section of the steel semi-space with disc reflectors of various diameters and with multiplicity of coordinates of their location was performed. Calculated amplitudes of patterns were compared with ones measured in corresponding flat-bottom holes by means of “А1550 IntroVisor”. Maximal difference in amplitudes of calculated and measured patterns did not exceed 4 dB, whereas in most cases they appeared to be significantly lower.
Two-dimensional DGS-diagram obtained from experiments is presented in Fig. 8. It represents the set of six surfaces, one surface for every diameter of flat-bottom holes in used specimens. Diagram is plotted in following coordinates: depth – slant distance . Upper surface along the axis of amplitudes corresponds with 5.0 mm diameter of holes, while lower one – with 1.8 mm diameter. High values of amplitudes are marked with red color, while low ones – with blue color.
Fig. 8Two-dimensional DGS-diagram obtained from experiments using specimens with flat-bottom holes of 1.8 to 5 mm diameter
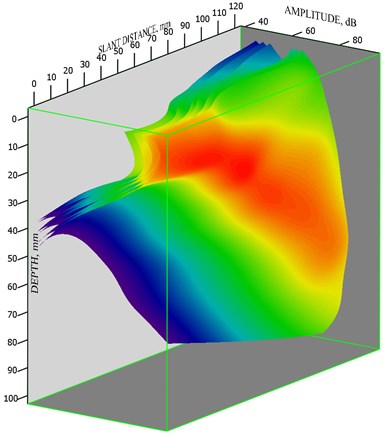
In the process of testing, the following three parameters are assigned automatically to the pattern of discontinuity detected on the flaw detector screen, which is detected within the frame of two-dimensional gate: depth , mm; distance along the entry surface , mm; and, amplitude , dB. Discontinuity coordinates and are recalculated into the value of slant distance , mm. Then, by coordinates and , value of the flat-bottom hole diameter equivalent by reflectivity to the detected discontinuity is selected from the data array of two-dimensional DGS-diagram. This value is calculated by means of linear interpolation among diameter values the diagram was measured for. Result in the form of equivalent diameter or area is indicated on the instrument screen.
In order to improve accuracy of evaluation of discontinuity dimensions during testing process, the AA acoustic contact with the TO surface is monitored permanently for quality. To that end, signal amplitudes of the head US waves presented in implementations of US oscillations from every pair of the AA elements are analyzed.
Examples of evaluation of the equivalent dimensions of actual discontinuities are presented in Figs. 9 and 10. It is the clump of pores within the welding seam of carbon steel of 14.55 mm thickness (Fig. 9) and individual pore within the welding seam of 12C18N10T austenitic steel of 10 mm thickness (Fig. 10). Besides tomographic images, X-ray patterns of seam sections are presented in these figures. Tomographic images are obtained by means of the inclined AA at 4 MHz frequency using even reconstruction algorithm (Fig. 9) and multi-algorithm (Fig. 10). Positions of sections in seams and directions of emission signals propagation are indicated by arrows in the X-ray patterns. Dimensions of pores within the seam of carbon steel evaluated by X-ray pattern amount to approx. 0.5–1.0 mm. Pore diameter within the austenitic seam is equal to 1.5 mm.
Fig. 9Tomographic image of the butt weld joint of carbon steel of 14.55 mm thickness with patterns of pore accumulation and X-ray pattern of this joint. Scan direction is indicated by arrow
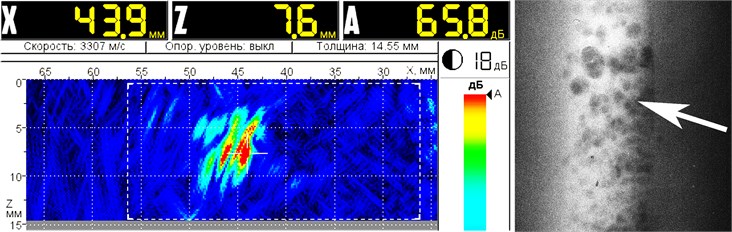
Fig. 10Tomographic image of the butt weld joint of 12C18N10T steel of 10 mm thickness with pattern of individual pore of 1.5 mm diameter and X-ray pattern of this joint. Scan direction is indicated by arrow
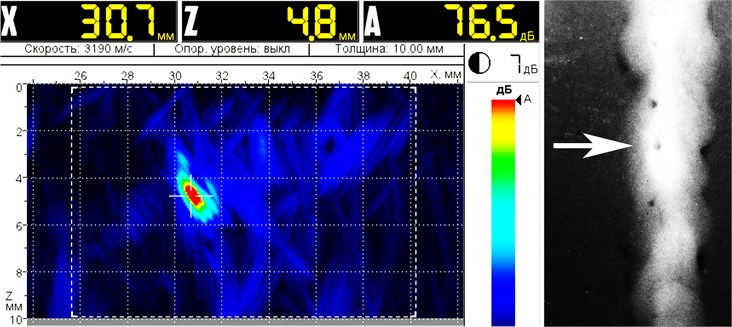
Dimensional evaluation of these discontinuities by amplitudes of their patterns on the screen of “А1550 IntroVisor” by means of two-dimensional DGS-diagram has provided the following results: zone of pore accumulation within the seam of carbon steel (Fig. 9) is equivalent to disc reflector of 0.7 mm diameter, while pore within the austenitic seam (Fig. 10) – 0.8 mm.
Since accumulation of closely located pores that are not resolvable on the screen provides the cumulative pattern, it is not possible to verify the accuracy of equivalence evaluation of this accumulation and single disc reflector. What concerns the individual pore within a seam (Fig. 10), the result of its evaluation correlates well with known fact of weaker echo signal from spherical reflector as compared with disc one of the same diameter. Diameter calculation of the disc reflector equivalent to 1.5 mm spherical one gives the value of 0.66 mm.
6. Conclusions
1. Ultrasonic flaw detector “А1550 IntroVisor” with digital focusing of antenna array (DFA), which, during reconstruction of images, takes into account echo signals multiply reflected from the object boundaries, provides possibility to evaluate directly type and dimensions of discontinuities by their images.
2. With discontinuity sizes exceeding 2-3 wavelengths of US oscillations (more than 3 mm at 4 MHz frequency), “А1550 IntroVisor” makes it possible to perform direct measurement of their dimensions with error of about ±0.5 mm at 4 MHz operating frequency.
3. With discontinuity sizes lesser than 2-3 wavelengths, measurement of their equivalent area is provided by means of two-dimensional DGS-diagram.
References
-
L. von Bernus, А. Bulavinov, D. Joneit, М. Kröning, M. Dalichov, K. М. Reddy. Sampling phased array: a new technique for signal processing and ultrasonic imaging. 9th ECNDT, Berlin, 2006. Vol. 6531.
-
H. Karasawa, T. Ikeda, S. Matsumoto, T. Hamajima, H. Isobe. 3D-SAFT Ultrasonic Inspection Equipment “MatrixeyeTM”. 7th International Conference on NDE in Relation to Structural Integrity for Nuclear and Pressurized Components, Yokohama, Japan, 2009.
-
David Lines, James Wharrie, John Hottenroth, Jesse Skramstad, Ron Goodman, Nancy Wood. Real-Time Ultrasonic Array Imaging using Full Matrix Capture and the Total Focusing Method. Proceedings of 2nd Aircraft Airworthiness & Sustainment Conference, San Diego, 2011.
-
Le Ber L., Roy O., Reverdy F., Mahaut S. Application and Simulation of Advanced Ultrasonic Array Techniques. 10th European Conference on Non-Destructive Testing, Report 1.3.15, Moscow, 2010.
-
Jobst M., Connolly G. D. Demonstration of the Application of the Total Focusing Method to the Inspection of Steel Welds. 10th European Conference on Non-Destructive Testing, Moscow, Report 1.3.4, 2010.
-
E. G. Bazulin. Reconstruction of the Images of Reflectors from Ultrasonic Echo Signals using the Maximum-Entropy Method. Russian Journal of Nondestructive Testing, Vol. 49, Issue 1, 2013, p. 26-48.
-
Kozlov V. N., Samokrutov A. A., Shevaldykin V. G. Thickness Measurements and Flaw Detection in Concrete Using Ultrasonic Echo Method. J. Nondestructive Testing and Evaluation, Vol. 13, 1997, p. 73-84.
-
Ultrasonic tomograph for metals A1550 IntroVisor. http://acsys.ru/eng/production/detail/a1550-introvisor
-
A. A. Samokrutov, V. G. Shevaldykin. Ultrasonic Tomography of Metal Structures Using the Digitally Focused Antenna Array Method. Russian Journal of Nondestructive Testing, Vol. 47, Issue 1, 2011, p. 16-29.
About this article
